Stability and adaptability of runner peanut genotypes
based on nonlinear regression and AMMI analysis
Roseane Cavalcanti dos Santos(1), Alineaurea Florentino Silva(2), Tarcísio Marcos Souza Gondim(1), José Oscar Lustosa de Oliveira Júnior(3), Raimundo Bezerra de Araújo Neto(3), Edvaldo Sagrilo(3), Ramon Araujo de Vasconcelos(1), Péricles de Albuquerque Melo Filho(4) and João Luís da Silva Filho(1)
(1)Embrapa Algodão, Caixa Postal 174, CEP 58428‑095 Campina Grande, PB, Brazil. E‑mail: [email protected], [email protected],
[email protected], [email protected] (2)Embrapa Semiárido, Caixa Postal 23, CEP 56302‑970 Petrolina, PE, Brazil.
E‑mail: [email protected] (3)Embrapa Meio‑Norte, Avenida Duque de Caxias, no 5.650, Buenos Aires, CEP 64006‑220 Teresina, PI, Brazil.
E‑mail: [email protected], [email protected], [email protected] (4)Universidade Federal Rural de Pernambuco,
Rua Dom Manoel de Medeiros, s/no, Dois Irmãos, CEP 52171‑900 Recife, PE, Brazil. E‑mail: [email protected]
Abstract – The objective of this work was to estimate the stability and adaptability of pod and seed yield in runner peanut genotypes based on the nonlinear regression and AMMI analysis. Yield data from 11 trials, distributed in six environments and three harvests, carried out in the Northeast region of Brazil during the rainy
season were used. Significant effects of genotypes (G), environments (E), and GE interactions were detected
in the analysis, indicating different behaviors among genotypes in favorable and unfavorable environmental
conditions. The genotypes BRS Pérola Branca and LViPE‑06 are more stable and adapted to the semiarid environment, whereas LGoPE‑06 is a promising material for pod production, despite being highly dependent
on favorable environments.
Index terms: Arachis hypogaea, genotype x environment interaction, pod yield, seed yield, semiarid adaptation.
Estabilidade e adaptabilidade de genótipos de amendoim rasteiro
baseadas em regressão não linear e análise AMMI
Resumo – O objetivo deste trabalho foi estimar a estabilidade e a adaptabilidade da produção de vagens e de sementes de genótipos de amendoim rasteiro com base em metodologias de regressão não linear e análise AMMI. Foram utilizados dados de produtividade de 11 ensaios, distribuídos em seis ambientes e três safras
agrícolas, realizados na região Nordeste, no período das águas. Efeitos significativos de genótipos (G), ambientes (A) e da interação GA foram detectados nas análises e indicaram comportamento diferente entre os genótipos em condições ambientais favoráveis e desfavoráveis. Os genótipos BRS Pérola Branca e LViPE‑06 são os mais estáveis e adaptados ao ambiente semiárido, enquanto o LGoPE‑06 é material promissor para a
produção de vagens, embora seja altamente dependente de ambiente favorável.
Termos para indexação: Arachis hypogaea, interação genótipo x ambiente, produtividade de vagens, produtividade de sementes, adaptação ao semiárido.
Introduction
High yield is the main goal of most plant breeding programs. Although yield traits are governed by a pool of major genes, the best performance of genotypes often depends on environmental conditions, resulting
in a strong genotype and environment (GE) interaction.
A strategy to reduce this interaction is based on cultivar selection, considering production stability in different locations in order to discriminate cultivars adapted to favorable and unfavorable environments.
Knowledge on the performance and adaptability of genotypes to particular environments is fundamental to
estimate the agronomical value of cultivars and for their
recommendation for specific environments (Murakami et al., 2004). Moreover, performance stability allows for the identification of stable genotypes, with a
predictable performance in different environments. Several methodologies have been used to estimate phenotypic adaptability and stability, and differ as to the concepts and biometric procedures by which the
GE interaction is measured. These methodologies are
principal component analysis, such as the additive main
effects and multiplicative interaction (AMMI) analysis (Eberhart & Russel, 1966; Toler & Burrows, 1998; Pacheco et al., 2005; Oliveira & Godoy, 2006).
Linear regression is the model most often used in the study of adaptability and stability, and provides information important for cultivar recommendation. This methodology describes the average standard
response of each genotype to the environment;
however, it does not contribute to identify the main
relationships of the true causes of GE interaction (Ferreira et al., 2006; Oliveira & Godoy, 2006).
According to Ferreira et al. (2006), among breeders,
the main criticisms of linear regression models are: the dependence of the environmental index on the mean performance of genotypes, and the use of biased
estimators of the regression coefficients, since the
independent variable is measured with error. Simple
and bi‑segmented models were proposed by Toler & Burrows (1998), which use indicator variables for
favorable and unfavorable environments. In these models, the environmental index is a parameter to be estimated and, therefore, not dependent on the phenotypic means of the genotypic group.
Multivariate methods or univariate and multivariate methods are also used to estimate phenotypic stability. Among them, AMMI analysis integrates variance analysis of the main effects – i.e., genotypes and environments – with principal component analysis for the multiplicative effects of
GE interaction (Oliveira & Godoy, 2006). AMMI analysis can contribute in the identification of the
most stable and productive genotypes and in the
further recommendation of region‑specific cultivars.
It also provides more precise estimates of genotypic responses and easy interpretation of the results in
biplot graphs (Zobel et al., 1988). According to Toler & Burrows (1998), there is a relationship between
parameters of the AMMI method and simple and
bi-segmented regression models. Ferreira et al. (2006) recommend the simultaneous use of the Toler & Burrows (1998) and AMMI models to estimate
phenotypic stability.
The objective of this work was to estimate the stability and adaptability of pod and seed yield in
runner peanut (Arachis hypogaea L.) genotypes
based on the nonlinear regression and AMMI analysis.
Materials and Methods
The field trials were carried out in the rainy season,
during three years, in six environments of the Northeast
region of Brazil (Table 1).
Late and early runner peanut genotypes were
cultivated in plots (8‑m row lengths), in which 0.5‑m edges were considered border lines. Each row
was spaced in 70 cm, and the sowing density was eight plants per meter. The evaluated genotypes are shown in Table 2.
Soil correction and fertilization were previously performed according to soil analysis. A randomized block
design, with five replicates, was used in all trials. Crop management was done according to Santos et al. (2006).
Harvest was performed between 115 and 130 days after emergence. After post-harvest treatments, pod and seed yield data were subjected to joint analysis of variance
to check for the presence of significant GE interaction effects, using the SAS software (SAS Institute, 1999).
The heterogeneity of variance for each dependent variable was estimated by the ratio between the highest and lowest mean square observed in the individual analysis. The adjustment of the degrees of freedom for
mean error and GE was done by the Cochran method, as described in Pimentel‑Gomes (1990).
Each experiment was considered a distinct
environment. The phenotypic adaptability and stability
analysis (Toler & Burrows, 1998), and AMMI analysis (Zobel et al., 1988) were used. AMMI analysis joins
additive analysis, to investigate main effects, and
multiplicative analysis, to detect GE interaction.
Therefore, it unites analysis of variance and principal component analysis. The equation proposed by Toler
& Burrows (1998) is Ŷij = a^i + [Zj ^
bli + (1 ‑ Zj) ^
b2i] m^j
+ εij, in which: Ŷij is the mean performance of the ith
genotype as to yield in the jth environment (i = 1, 2,
..., p genotypes; and j = 1, 2, ..., q environments); a^ i is
the parameter that reflects the value of performance of
genotype i on the intercept with m^ j = 0;
^
bli and ^
b2i are the
parameters that reflect the sensibility of the phenotypic
performance of genotype i in unfavorable and favorable
environments, respectively; m^
j is the parameter that
reflects the quality of the jth environment; ε
ij is the mean
experimental error (residue); and Zj is the indicator
variable, in which Zj = 1 if m^j <0, and Zj = 0 if m^j >0.
The genotype classification used in the present study was proposed by Toler & Burrows (1998),
(1990), a promising genotype should have doubly
desirable response, with low response to undesirable
environments (µj <0), and high performance in favorable conditions (µj >0).
In the AMMI model, the effects of interaction deviations are analyzed by singular value decompositions. The variation contained in the sum of squares of interactions is decomposed into “pattern”, when the variation captured by the auto value is
significant, and “noisy”, when this variation is not significant. The interpretation of adaptability and stability
is performed by graphical analysis, with the scores of the
first two principal components plotted in a biplot. The
closer the point is to the biplot origin, the more stable is
the genotype or the environment; the more distant, the greater the contribution to the interaction. Genotypes or
environments close to each other have the same pattern
as to the GE interaction (Dias, 2005).
Results and Discussion
Joint analysis of variance showed significant effect
for all sources of variation for both pod and seed yield, indicating differential behavior of genotypes, which was not consistent with different environments
(Table 4). Auto values, obtained by principal
components analysis, over 70% of the variation found
in GE interactions were captured by the first two principal components for both pod and seed yields;
therefore, the interaction pattern of genotypes in all environments can be analyzed by visual inspection
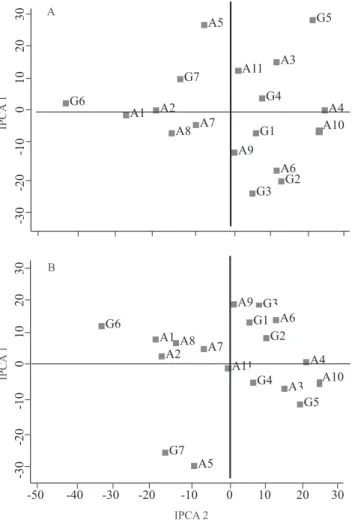
of the AMMI2 biplot (Figure 1). Oliveira & Godoy (2006) worked with 20 peanut genotypes distributed in
ten environments and observed that the AMMI2 model captured almost 59% of variation.
The genotype BRS Pérola Branca (G1) was located
closer to the origin, showing little contribution to
GE interaction, and was also more stable (Figure 1). The best contribution to GE interaction was found in Colinas, MA (A5) and Barbalha, CE (A9), for pod and seed yield; whereas in Petrolina, PE (A1), Monteiro, PB (A2 and A8), and Abreu e Lima, PE (A7), the
behavior of the genotype was very close, indicating
Table 1. Environmental data from peanut trials carried out in the Northeast region of Brazil.
Environment Coordinates Altitude (m) Climate Total rainfall (mm) Sowing Soil
Petrolina, PE 09°23'34"S; 40°30'28"W 376 Semiarid 187 May Oxisol
Abreu e Lima, PE 07°54'43"S; 34°54'10"W 19 Tropical 876 June Entisol
Barbalha, CE 07°18'18"S; 39°18'07"W 414 Semiarid 613 July Vertisoil
Monteiro, PB 07°53'20"S; 37°07'12"W 599 Semiarid 239 March Oxisol Colinas, MA 06°01'33'S; 44°14'57''W 141 Tropical 1,160 February Entisol São João do Piauí, PI 08°21'29"S; 42°19'22''W 222 Semiarid 509 February Oxisol
Table 2. Genealogy and agronomic traits of the evaluated peanut genotypes.
Genotype Genealogy Origin Seed Seeds per pod Pod
Color Size Shape
BRS Pérola Branca Cultivar PB, Brazil White Large Long 34 Large
LB308 Top line PB, Brazil White Medium Round 23 Large
LB408 Top line PB, Brazil White Medium Round 23 Large
IAC Caiapó Cultivar SP, Brazil Tan Large Long 2 Large
Florunner Cultivar USA Tan Large Long 2 Large
LGoPE‑06 Top line PE, Brazil Tan Extra large Round 2 Extra large
LViPE‑06 Top line PE, Brazil Tan Extra large Round 2 Extra large
Table 3. Criteria used for genotype classification according
to Toler & Burrows (1998).
Group Criterion Classification of genotypes
A Reject H (accept bb1 = b2),
1 < 1< b2
Convex and doubly desirable response
B Accept H (b1 = b2),
reject H (b = 1), but b1>1
Simple linear response, desirable in high quality environments
C Accept H (b1 = b2),
accept H (b = 1) from mean response in the environmentsSimple linear response, not deviating D Accept H (b1 = b2),
reject H (b = 1), but b<1
Simple linear response, desirable in poor quality environments E Reject H (b1 = b1),
accept b1 >1 > b2
that, in future trials, only one location of those can be chosen to cut down expenses, without the risk of losing the representativeness of the trials. Silva Filho
et al. (2008) used several methods, besides AMMI
analysis, to compare the stability of cotton genotypes in 23 locations, in several states of Brazil, and also observed that it is possible to reduce the number of trials based on the clustering tendency in the same state.
The stability parameters, based on the nonlinear
model of Toler (1990), for pod and seed yield are
given in Table 5. The highest yields were obtained
for extra‑large seed genotypes – LViPE‑06 (G7) and LGoPE‑06 (G6) –, with 3.1 and 2.2 Mg ha-1 for pod
and seed yield, respectively. The early, large seed genotype BRS Pérola Branca also showed high yield,
with 2.6 Mg ha-1 in pods and 1.8 Mg ha-1 in seeds.
Among the environments, the highest yields were
obtained in Coruripe, AL (A11), Barbalha, CE (A4 and A9), and Colinas, MA (A5). In the semiarid region,
which encompassed the municipalities of Petrolina,
PE (A1), Monteiro, PB (A2), and São José do Piauí, PI (A6), runner genotypes showed lower performance,
with pod and seed yields next to those obtained with
upright genotypes in the rainy season (Santos et al., 2010).
Based on the pattern of the different groups found by
the Toler & Burrows (1998) method, it was observed that LGoPE‑06 (G6) showed convex and doubly desirable response (group A). However, LB308 (G2)
had concave and doubly undesirable response, showing unsatisfactory yield and low stability in all trials.
According Toler (1990), genotypes clustered in
group A were considered stable in favorable and unfavorable environments, and responsive to the improvement of management conditions. However,
Figure 1. Genotype distribution in different environments
regarding pod (A) and seed (B) yield, based on analysis by visual inspection of the AMMI2 biplot. G1, BRS Pérola Branca; G2, LB308; G3, LB408; G4, IAC Caiapó; G5, Florunner; G6, LGoPE‑06; G7, LViPE‑06. A1, Petrolina, PE, 2008; A2, Monteiro, PB, 2007; A3, Barbalha, CE, 2008; A4, Barbalha, CE, 2007; A5, Colinas, MA, 2009; A6, São João do Piauí, PI, 2009; A7, Abreu e Lima, PE, 2007; A8, Monteiro, PB, 2008; A9, Barbalha, CE, 2009 (trial 1); A10, Barbalha, 2009 (trial 2); A11, Coruripe, AL, 2009. IPCA,
Interactive principal component axis
Table 4. Joint analysis of variance of peanut genotypes
evaluated in different environments as to pod and seed yield, and auto values obtained by principal components analysis.
Source of variation Pod yield Seed yield
DF F calculated DF F calculated
Environment (E) 10 52.13** 10 42.84**
Block/E 44 0.69ns 44 0.83ns
Genotype (G) 6 25.43** 6 23.50**
E x G 60 (49)(1) 1.96** 60 (41)(1) 1.84**
Error 257 (209)(1) 257 (173)(1)
R2 . 0.76 . 0.73
CV (%) . 24.3 . 26.58
Mean . 2,543.6 . 1,773.4
Principal component Auto values Auto values % explained % accumulated % explained % accumulated
1 54.74 54.74 46.57 46.57
2 17.45 72.19 24.33 70.90
3 12.52 84.71 13.10 84.00
4 8.86 93.56 9.17 93.17
5 4.51 98.08 5.70 98.87
6 1.92 100.00 1.13 100.00
Rosse & Vencovsky (2000), when using the Toler
model to estimate stability and adaptability in bean genotypes, found that genotypes with double favorable standard had low productivity and that those with double unfavorable standard had higher yields.
Most of the genotypes were situated in group C, with simple linear response, and did not deviate from the average response. This type of clustering often takes place when cultivars or advanced bred lines are evaluated. The yield of these materials is in accordance with the reported environmental average
(Ribeiro et al., 2000; Morais et al., 2008). Based on
pod and seed yields and on the general adaptability to
all environments, the genotypes LViPE‑06 (G7) and BRS Pérola Branca (G1), both located in group C,
showed simple linear response and were more stable, considering the average yield in the environments.
Despite its low adoption by breeders, the stability and adaptability estimates based on Toler (1990) showed
interesting results for plant improvement in several
crops. Ribeiro et al. (2000) studied the adaptability
and stability of 20 divergent corn genotypes, in Minas
Gerais State, Brazil, using the methodologies of Cruz et al. (1989) and Toler (1990). The authors observed
that these models were very similar and efficient to
predict the performance of genotypes. The correlation between both models was close to 97%.
Morais et al. (2008) evaluated 69 different
soybean genotypes in several environments from the
Central‑West Region of Brazil and found different
values for environmental quality. Considering group
classifications based on yield and on response pattern, the authors were able to define genotypes with double desirable response pattern (group A) or with response pattern of mono‑segmented genotypes (B, C, and D), with variable yield. This methodology was
advantageous to estimate soybean adaptability and stability, since it discriminated genotypes with narrow genetics based on groups with different response pattern.
The results obtained in the present work using the
Toler (1990) and AMMI methodologies were consistent
with trimmings of genotypes during the improvement processes, especially for BRS Pérola Branca and
LViPE‑06.
BRS Pérola Branca, a recent early-runner peanut
cultivar developed by Embrapa, was obtained via crossing between BR 1 (upright and short cycle,
Table 5. Stability parameters(1), based on the Toler & Burrows (1998) methodology, regarding pod and seed yields in runner
peanut genotypes.
Genotype Pod yield Ai Bli B2i Bi Group Seed yield Ai Bli B2i Bi Group
BRS Pérola Branca 2.6 2.6 0.9 1.2 1.17 C 1.8 1.18 1.0 0.9 1.0 C
LB308 2.1 2.1 1.3 0.5* 0.8 E 1.4 1.6 1.3 0.5 0.9 C
LB408 2.1 2.3 1.4 0.7 0.9 C 1.5 1.6 1.4 0.6 1.0 C
IAC Caiapó 2.2 2.3 0.8 1.3 1.1 C 1.6 1.6 0.8 0.8 0.8 C
Florunner 2.5 2.5 1.2 1.2 1.2 C 1.7 1.7 1.2 1.3 1.2* B
LGoPE 06 3.0 2.6 0.3* 1.3 0.8 A 2.0 1.8 0.4* 1.3 0.9 A
LViPE 06 3.2 3.2 1.1 0.9 1,0 C 2.3 2.2 0.9 1.5 1.2 C
Environment(2) Mean Ui Mean Ui
A1 1.6 ‑965 1.1 ‑682
A2 1.7 ‑869 1.2 ‑608
A3 1.8 ‑665 1.3 ‑461
A4 2.9 345 2.0 231
A5 3.3 784 2.4 712
A6 1.7 -751 1.2 -513
A7 2.5 -134 1.7 -92
A8 2.7 202 1.9 177
A9 3.0 467 2.0 253
A10 2.7 123 1.9 96
A11 4.0 1,463 2.7 887
(1)Ai, performance of the ith genotype (1, 2, …,7) in an environment of average yield; B1i and B2i, sensibility to the performance of the ith genotype in favorable
and unfavorable environments, respectively; Ui, effect of the ith environment; Bi, the only parameter of the model when B1i and B2i are both not significant.
(2)A1, Petrolina, PE, 2008; A2, Monteiro, PB, 2007; A3, Barbalha, CE, 2008; A4, Barbalha, CE, 2007; A5, Colinas, MA, 2009; A6, São João do Piauí, PI, 2009;
Valência type) and the top line LViPE‑06 (late cycle, Virginia type). The general breeding proceedings for the fitting of this cultivar were performed in Barbalha
and Missão Velha, both located in the semiarid region
of Ceará State, Brazil. In several field trials carried out in the rainy season, ‘BRS Pérola Branca’ (previously named Branco Rasteiro 1/08) showed moderate tolerance to drought (Santos et al., 2012). In a study carried out by Pereira (2010), involving osmotic
adjustment, gas exchanges, and agronomic traits in peanut genotypes subjected to 20 days of water stress,
BRS Pérola Branca (named LBR Branco) showed
reasonable ability to prevent water losses. This trait, added to earliness, was genetically inherited from BR 1, an early drought tolerant cultivar developed by
Embrapa and recommended for semiarid environments (Gomes et al., 2007; Luz et al., 2010; Graciano et al., 2011). From LViPE‑06, ‘BRS Pérola Branca’ inherited
its high tolerance to leaf diseases and high capacity for
oil and pod production (Santos et al., 2010). The choice of LViPE‑06 as a progenitor was due to its large genetic
variability revealed by molecular markers in runner
genotypes (Pereira et al., 2008). Both LViPE‑06 and
BRS Pérola Branca genotypes showed high oil content
(51–52%), with oleic/linoleic ratio >1.6 (Santos et al., 2012), representing an excellent material for edible or
fuel oil markets.
Conclusions
1. The peanut genotypes LViPE‑06 and
BRS Pérola Branca are more stable and adapted to the semiarid environment.
2. The peanut genotype LGoPE‑06 is a promising
material for pod production, but is highly dependent on favorable environments.
Acknowledgements
To Banco do Nordeste do Brasil, for financial
support.
References
CRUZ, C.D.; TORRES, R.A. de A.; VENCOVSKY, R. An alternative approach to the stability analysis proposed by Silva and Barreto. Revista Brasileira de Genética, v.12, p.567‑580, 1989.
DIAS, C.T. dos S. Métodos para escolha de componentes em modelo de efeito principal aditivo e interação multiplicativa (AMMI). 2005. 73p. Tese (Livre Docência) – Escola Superior de
Agricultura Luiz de Queiroz, Piracicaba.
EBERHART, S.A.; RUSSELL, W.A. Stability parameters for comparing varieties. Crop Science, v.6, p.36‑40, 1966.
FERREIRA, D.F.; DEMÉTRIO, C.G.B.; MANLY, B.F.J.; MACHADO, A. de A.; VENKOVSKY, R. Statistical models in agriculture: biometrical methods for evaluating phenotypic stability in plant breeding. Cerne, v.12, p. 373‑388, 2006.
GOMES, L. de R.; SANTOS, R.C. dos; ANUNCIAÇÃO FILHO, C.J. da; MELO FILHO, P. de A. Adaptabilidade e estabilidade fenotípica de genótipos de amendoim de porte ereto. Pesquisa Agropecuária Brasileira, v.42, p.985-989, 2007.
GRACIANO, E.S.A.; NOGUEIRA, R.J.M.C.; LIMA, D.R.M.; PACHECO, C.M.; SANTOS, R.C. Crescimento e capacidade fotossintética da cultivar de amendoim BR 1 sob condições de salinidade. Revista Brasileira de Engenharia Agrícola e Ambiental, v.15, p.794-800, 2011.
LUZ, L.N. da; SANTOS, R.C. dos; SILVA FILHO, J.L. da; MELO FILHO, P. de A. Estimativas de parâmetros genéticos em linhagens de amendoim baseadas em descritores associados ao ginóforo.
Revista Ciência Agronômica, v.41, p.132-138, 2010.
MORAIS, L.K. de; MOURA, M.F.; VENCOVSKY, R.; PINHEIRO, J.B. Adaptabilidade e estabilidade fenotípica em soja avaliada pelo método de Toler. Bragantia, v.67, p.275‑284, 2008.
MURAKAMI, D.M.; CARDOSO, A.A.; CRUZ, C.D.; BIZÃO, N. Considerações sobre duas metodologias de análise de estabilidade e adaptabilidade.Ciência Rural, v.34, p.71-78, 2004.
OLIVEIRA, E.J. de.; GODOY, I.J. de. Pod yield stability analysis of runner peanut lines using AMMI. Crop Breeding and Applied Biotechnology, v.6, p.311‑317, 2006.
PACHECO, R.M.; DUARTE, J.B.; VENCOVSKY, R.; PINHEIRO, J.B.; OLIVEIRA, A.B. Use of supplementary genotypes in AMMI analysis. Theoretical and Applied Genetics, v.110, p.812-818, 2005.
PEREIRA, J.W. de L. Respostas fisiológica e agronômica de genótipos de amendoim sob condição de estresse hídrico. 2010. 64p. Dissertação (Mestrado) – Universidade Federal Rural de Pernambuco, Recife.
PEREIRA, J.W. de L.; MELO FILHO, P. de A.; SILVA, F.A.C.; SANTOS, R.C. dos. Variabilidade genética de acessos de amendoim do tipo runner com base em marcadores RAPD. Revista Brasileira de Oleaginosas e Fibrosas, v.12, p.35-40, 2008.
PIMENTEL‑GOMES, F. Curso de estatística experimental. 13.ed. Piracicaba: Nobel, 1990. 468p.
RIBEIRO, P.H.E.; RAMALHO, M.A.P.; FERREIRA, D.F. Adaptabilidade e estabilidade de genótipos de milho em diferentes condições ambientais. Pesquisa Agropecuária Brasileira, v.35, p.2213-2222, 2000.
ROSSE, L.N.; VENCOVSKY, R. Modelo de regressão não‑linear aplicado ao estudo da estabilidade fenotípica de genótipos de feijão no Estado do Paraná. Bragantia, v.59, p.99-107, 2000.
SANTOS, R.C. dos; REGO, G.M.; SANTOS, C.A.F.; MELO FILHO, P.A.; SLVA, A.P.G.; GONDIM, T.M.S.; SUASSUNA, T.F. Recomendações técnicas para o cultivo do amendoim em pequenas propriedades agrícolas do Nordeste brasileiro. Campina Grande: Embrapa Algodão, 2006. 7p. (Embrapa Algodão. Circular técnica, 102).
SANTOS, R.C. dos; REGO, G.M.; SILVA, A.P.G. da; VASCONCELOS, J.O.L.; COUTINHO, J.L.B.; MELO FILHO, P. de A. Produtividade de linhagens avançadas de amendoim em condições de sequeiro no Nordeste brasileiro. Revista Brasileira de Engenharia Agrícola e Ambiental, v.14, p.589-593, 2010. SAS INSTITUTE. SAS/STAT user’s guide. Version 8. Cary: SAS Institute, 1999. 3811p.
SILVA FILHO, J.L. da; MORELLO, C. de L.; FARIAS, F.J.C.; LAMAS, F.M.; PEDROSA, M.B.; RIBEIRO, J.L. Comparação de métodos para avaliar a adaptabilidade e estabilidade produtiva em algodoeiro. Pesquisa Agropecuária Brasileira, v.43, p.349-355, 2008.
TOLER J.E. Patterns of genotypic performance over environmental arrays. 1990. 154p. Thesis (Ph.D) – Clemson
University, Clemson.
TOLER, J.E.; BURROWS, P.M. Genotypic performance over environmental arrays: a non-linear grouping protocol. Journal of Applied Statistics, v.25, p.131-143, 1998.
ZOBEL, R.W.; WRIGHT, M.J.; GAUCH, H.G. Statistical analysis of a yield trial. Agronomy Journal, v.80, p.388-393, 1988.