UNIVERSIDADE DO ALGARVE
UNIVERSITY OF ALGARVE
FACULDADE DE CIÊNCIAS E TECNOLOGIA
FACULTY OF SCIENCES AND TECHNOLOGY
SHOREBIRDS AS INDICATORS OF ECOLOGICAL STATUS AND
SEDIMENT QUALITY IN THE RIA FORMOSA LAGOON
MESTRADO EM GESTÃO DA ÁGUA E DA COSTA
(CURSO EUROPEU)
ERASMUS MUNDUS EUROPEAN JOINT MASTER
IN WATER AND COASTAL MANAGEMENT
SERGEI DANCHENKO
NOME / NAME: Sergei Danchenko
DEPARTAMENTO / DEPARTMENT: Faculdade de Ciências e Tecnologia
ORIENTADOR / SUPERVISOR:
1) Prof. Dr Alice Newton, Department of Chemistry and Biochemistry, Faculty of Science and Technology, University of Algarve, Portugal.
2) Prof. Dr Jaime Albino Ramos, IMAR – Instituto do Mar da Universidade de Coimbra.
DATE: 30 September 2010
TÍTULO DA TESE / TITLE OF THESIS: “Shorebirds assemblages as indicators of ecological status and sediment quality in the Ria Formosa lagoon”
JURI:
Presidente: Doutor Tomasz Boski, Professor Catedrático da Faculdade de Ciências e Technologia da Universidade do Algarve.
Vogais: Doutor Stephen Michael Mudge, Senior Lecturer, Bangor School of Ocean Science, University of Wales, United Kingdom;
Doutor John David Icely, Investigador Principal do CIMA – Centro de Investigação Marinha e Ambiental da Universidade do Algarve;
Doutor Jaime Albino Ramos, Investigador no IMAR – Instituto do Mar da Universidade de Coimbra, na qualidade de orientador;
Doutora Alice Newton, Professora Auxiliar da Facultade de Ciências e Technologia da Universidade do Algarve, na qualidade de orientadora.
iii ACKNOWLEDGEMENTS
I’m taking this opportunity to express gratitude to my supervisor Prof. Alice Newton for scientific guidance and instant encouragement, as well as project coordination. I’m very thankful to my co-supervisor Prof. Jaime Ramos for ornithological advice and assistance with text preparation.
I’d like to acknowledge Prof. Steve Mudge for statistical help. The constructive advice of Professors John Icely, Sofia Gamito, Delminda Moura and Vivienne Fonseca were invaluable and contributed significantly to the thesis quality.
I acknowledge the contribution of Kateryna Ivanova and Miguel Cañedo-Arguelles, whose work provided basic data on benthos, as well as for help with statistical data treatment. It was a great experience of team work.
Technical stuff of the FCMA and especially Paulo Santana are regarded for laboratory space and assistance.
The completion of the degree would not be possible without funding provided by Erasmus Mundus Program of European Commission. I’d like to thank all administrative and coordination teams of the Erasmus Mundus Program in the Universities of Algarve and Cadiz.
RESUMO
A lagoa da Ria Formosa é um local de importância ambiental internacional, incluido na rede Natura 2000, na Convenção Ramsar e na Directiva – Quadro da Água (DQA). Esta tese é centrada no estudo das comunidades de aves costeiras que se alimentam nos terrenos de interridais em relação com as propriedades dos sedimentos e às comunidades de meiobentos e macrobentos. O lugares do estudo seriam presumivelmente diferentes em estatuto ecológico, ambos localizados perto dos locais de intercalibração da DQA com estatuto ecológico definido. Os lugares não diferem significativamente na granulametria dos sedimentos, mas diferem no seu conteúdo orgânico total e no redox potencial dos sedimentos. As comunidades de aves consistem nas mesmas espécies mas são diferentes na densidade relativa entre locais. No foi encontrada relação entre a densidade das comunidades de aves e a bentos. As outras características do habitat, canais de maré, a mistura dos sedimentos operada pela pesca de bivalves e a distância aos locais de descanso, e a presença de locais complementares de alimentação influenciam as comunidades de aves.
Palavras-chaves: Aves, limicolas, macrobenthos, meiobenthos, estado ecologico, Ria Formosa.
v ABSTRACT
The Ria Formosa lagoon is a site of international environmental importance, included into Natura 2000 Network, Ramsar Convention and European Water Framework Directive (WFD). This thesis focuses on the study of shorebird assemblages feeding on intertidal flats in relation with physical properties of the sediments, meiobenthos and macrobenthos communities. The study sites were presumably different in ecological status, both located close to the WFD intercalibration sites with defined ecological status. The study sites did not differ significantly by sediment granulometry, but differed in total organic content and redox potential of the sediment. Bird communities consisted of the same species but differed in relative densities between sites. No relation was found between bird densities and their benthic prey. The other habitat characteristics, tidal channels, disturbance of sediment by shellfishery and distance to roost sites, presence of complementary feeding sites influenced bird communities.
Keywords: Shorebirds, waders, macrobenthos, meiobenthos, ecological status, Ria Formosa.
CONTENTS
Acknowledgements iii
Resumo iv
Abstract v
Contents vi
List of Figures viii
List of Tables xi
List of Abbreviations xii
1. Introduction 1
1.1. Wetlands and shorebirds conservation 1
1.2. Birds as environmental indicators 2
1.3. Shorebirds and habitat characteristics 5
1.4. Ria Formosa lagoon 9
1.5. Ecological importance and main pressures 11
1.6. Ecological Status according to Water Framework Directive 12
1.7. Benthic fauna community 1.8. Shorebirds of the Ria Formosa 1.9. Aims and objectives of the study
13 15 16 2. Methods 18 2.1 Study sites 18 2.2. Granulometry analysis 21
2.3. Sediment total organic content analysis 23
2.4. Reduction-oxidation potential 23 2.5. Birds census 24 2.6 Macrobenthos 25 2.7 Meiobenthos 25 2.8. Data analysis 25 3. Results 28 3.1. Environmental parameters 28
3.1.1. Sediment particle size 28
3.1.2. Sediment organic content 31
vii
3.2 Benthos communities 37
3.2.1 Macrobenthos 37
3.2.2 Meiobenthos 39
3.3. Birds assemblages 44
3.3.1. Bird densities and species composition 44
3.3.2. Comparison of bird assemblages 56
3.4 Relation between sediment properties, benthos and bird densities 62
3.5. Indicator species 67
4. Discussion
4.1. Sediment particle size and TOC 70
4.2. Reduction-oxidation potential 71
4.3. Meiobenthos 72
4.4. Macrobenthos 73
4.5. Bird assemblages 74
4.7. Relation between benthos and bird densities 74
4.8. High-tide roosts and supplementary feeding areas 76
4.9. Small-scale distribution of shorebirds on the intertidal flats 77
4.10. Indicator species 78
5. Conclusions 80
References 81
Appendix A. Particle size classification diagrams 89
Appendix B. Mean abundance of macrobenthic species and high taxa, ind/m2 91 Appendix C. Abundance of meiofaunal taxa at the study sites, ind.*105/m2 92
Appendix D. Species proportions of Nematoda, % 93
LIST OF FIGURES
Figure 1.1. Geographical position and satellite image of the Ria Formosa lagoon (map
base: Instituto Geografico Portugues).
9
Figure 1.2. Sediment grain size composition in the Ria Formosa lagoon (Environmental
Systems Analysis group, FCT/UNL).
11
Figure 1.3. Effect of sewage discharge on meiobenthos communities. The amount of
variance predicted for each site by the signature of a community influenced by organic matter of a sewage origin, PLS model (Hewitt, Mudge, 2004).
14
Figure 2.1. Location of the study sites in relation to main population centers and sewage
discharges (Map base adapted from Wayland et al., 2008).
18
Figure 2.2. Study site Ramalhete is located in the vicinity of the Water Framework
Directive intercalibration site. (Map base: Google Maps, 2009).
19
Figure 2.3. Study sites in the Ancão basin. Ancão site consists of the transect of 8 square
sampling units, with two benthos sampling points. Ancão-2 site is not divided into quadrats, has one benthos sampling point.
19
Figure 3.1. Sediment particle size distribution at Ancão (A1 to A8) and Ramalhete (R1 to
R8) sites.
29
Figure 3.2. Sediment fraction GS<63 μm distribution at benthos sampling stations R2,
R7and A3. Sample mean and standard deviation (SD).
31
Figure 3.4. Regression between % TOC and % of fraction GS<63μm, R2=0.80. 32
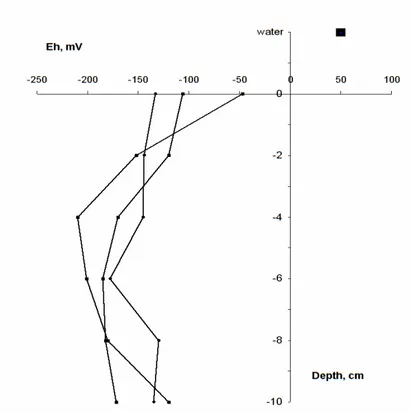
Figure 3.5. Redox profile, Eh (mV) change with depth (cm) at Ramalhete (site R2).
Sediment organic content was 3.72%.
34
Figure 3.6. Redox profile, Eh (mV) change with depth (cm) at Ancão (site A2). Sediment
organic content was 4.38 %.
34
Figure 3.7. Principal Component Analysis of sediment granulometry, TOC and Redox
(Log (x+1) transformed). PC1 and PC2 account for 36.7 and 28.0 % of variance, respectively. VCS – very coarse sand, CS – coarse sand, MS – medium sand, FS – fine sand, VFS – very fine sand, Mud – fraction of GS<63 μm, Eh – redox potential.
36
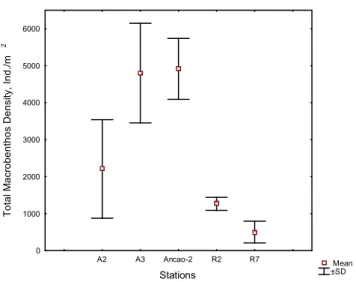
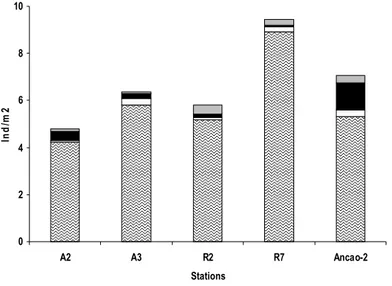
Figure 3.8. Total macrobenthos densities at the study sites, ind/m2: mean ±SD. 37
Figure 3.9. Relative k-dominance curves of macrobenthic communities of the study sites. 38
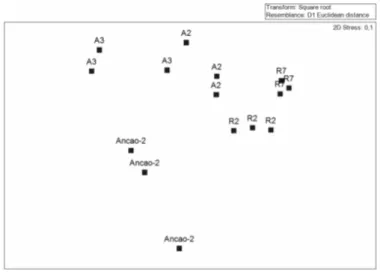
Figure 3.10. Non-metric Multi-Dimensional Scaling ordination plot based upon Euclidian
distance of square-root transformed macrobenthos species density data.
38
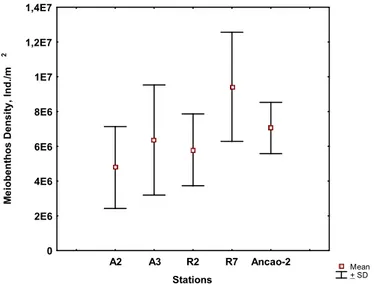
Figure 3.11. Total meiobenthos density at the study sites: mean ±SD. 40
Figure 3.12. Taxonomical composition of meiobenthos by densities for high taxa level,
ind/m2.
41
Figure 3.13. Proportions of trophic groups in the Nematoda communities of the study
sites, %.
41
Figure 3.14. Cluster analysis dendrogram showing similarity of stations by Nematoda
species composition. Stations were grouped by its replicates at the levels of 60 – 90%, and between stations at the levels of 50 to 27%.
ix Figure 3.16. Average bird densities in the sampling quadrats at Ancão in March – May,
birds/ha.
45
Figure 3.17. Average bird densities in the sampling quadrats at Ancão in June – July,
birds/ha.
46
Figure 3.18. Average bird densities in the sampling quadrats at Ancão in August –
October, birds/ha.
47
Figure 3.19. Average bird densities in the sampling quadrats at Ancão site, pooled for all
seasons, birds/ha.
48
Figure 3.20. Average bird densities at the Ramalhete site in spring, birds/ha. 49
Figure 3.21. Average bird densities at the Ramalhete site in summer, birds/ha. 50
Figure 3.22. Average bird densities at the Ramalhete site in autumn. 51
Figure 3.23. Bird densities at Ramalhete, averaged by all seasons, birds/ha. 52
Figure 3.24. Bird densities at Ancão-2 in spring, summer and autumn (birds/ha). 53
Figure 3.25. Cumulative k-dominance plot of bird assemblages at Ancão, Ramalhete and
Ancão-2 sites during all seasons (March – October).
54
Figure 3.26. Cumulative k-dominance plots of bird assemblages at Ancão, Ramalhete and
Ancão-2 sites in spring, summer and autumn.
54
Figure 3.27. PCA plot of bird densities by species pooled for all seasons. Bird codes: T –
Turnstone, S – Sanderling, D – Dunlin, RK – Red Knot, KP – Kentish Plover, RP – Ringed Plover, BarG – Bar-tailed Godwit, BlaG – Black-tailed Godwit, W – Whimbrel, GP – Grey Plover, G – Greenshank, R – Redshank.
57
Figure 3.28. PCA plot of bird densities by species for all seasons; Red Knot excluded. Bird
codes: see Fig. 3.27.
58
Figure 3.29. PCA plot of bird densities by species in March - May. Bird codes: see Fig.
3.27.
59
Figure 3.30. PCA plot of bird densities by species in March – May, Red Knot excluded
from analysis. Bird codes: see Fig. 3.27.
59
Figure 3.31. PCA plot of bird densities by species in June – July. Bird codes: see Fig. 3.27. 60
Figure 3.32. PCA plot of bird densities by species in August-October. Bird codes: see Fig.
3.27.
60
Figure 3.33. PCA plot of bird densities by species in August-October with Dunlin densities
excluded. Bird codes: see Fig. 3.27.
61
Figure 3.34. Cluster analysis dendrogram using Bray-Curtis similarity of log(x+1)
transformed data showing grouping of single counting quadrats by bird densities of 12 species in spring (sp), summer (su) and autumn (au). Season and site were important factors contributing to similarity of bird assemblages.
62
Figure 3.35. PLS plot showing bird average densities in relation with sediment variables,
n=5. Independent variables (X): % GS<63 μm (Mud), TOC, Eh. Dependent variables (Y): average bird density during all study period, n=17. Bird codes as in Figure 3.27.
Figure 3.36. PLS plot showing benthos densities in relation with sediment variables, n=5.
Independent variables (X): % GS<63 μm (Mud), TOC, Eh. Dependent variables (Y): macrobenthos species densities and meiobenthos high taxa densities.
65
Figure 3.37. PLS plot showing average birds densities in relation with sediment and
benthos variables, n=5. Independent variables (X): % GS<63 μm (MUD), TOC, Eh, meiobenthos taxa density (Harpacticoida, Nematoda, Polychaeta, Other taxa), total macrobenthos density (Individuals) and species densities. Dependent variables (Y): average bird density during all period. Bird codes as in Figure 3.27.
xi LIST OF TABLES
Table 1.1. Known food items of common shorebird species. Majority of benthos species identified
at study sites (Appendix B) are known to be taken by observed bird species.
7
Table 1.2 Ecological status of Ponte and Ramalhete intercalibration sites in terms of Water
Framework Directive, based on different Biological Quality Elements (BQE) and Environmental Quality Ratios (EQR).
12
Table 3.1. Sediment particle size distribution (%) and classification of sampling units, Ramalhete,
Ancão and Ancão-2 sites (According to GRADISTAT, by Blott and Pye, 2001).
28
Table 3.2. Comparison of grain size fractions distribution between Ancão and Ramalhete sites:
Mann-Whitney U-test, n=8, df=7. Sites were significantly different by very coarse sand (1 – 2 mm) and very fine sand (0.063 – 0.125 mm) fractions at the level of significance p<0.05 (in bold).
30
Table 3.3. Sediment particle size distribution (%) on the benthos sampling stations. 30
Table 3.4. Mean values (±SD) of total organic content (TOC) and silt-clay (fraction <63 μm)
content at Ancão, Ramalhete and Ancão-2 sampling sites.
32
Table 3.5. Redox potential site average values from three spatial sampling points (±SD) in the
upper 2 cm layer of sediment.
35
Table 3.6. Summary of the U-tests for difference between environmental variables of Ancão and
Ramalhete sites, n=8, df=7. Sites were significantly different by TOC and Redox at significance level of P<0.05.
35
Table 3.7. Diversity measures and indices for macrobenthos communities across all stations: S –
species number, d – Margalef species richness, J’ – Pielou's equitability, H’ – Shannon diversity, AMBI – marine biotic index.
39
Table 3.8. Diversity measures and genus-based indices for Nematoda communities across all
stations: S – species number, d – Margalef species richness, J’ – Pielou's evenness, H’ – Shannon diversity, MI - Maturity index, ITD - index of trophic diversity.
42
Table 3.9. Main shorebird species of the study sites. Abundances recorded during all period of
observations.
44
Table 3.10. Number of species (S), Shannon diversity (H), Sheldon evenness eH’/S and species richness (d) of bird communities.
55
Table 3.11. Summary of U-tests comparing bird densities between Ancão and Ramalhete sites,
n=8. Significant values at p<0.05 are in bold, at p<0.001 marked with (*).
56
Table 3.12. Principal Component Analysis of bird communities structure. Shown is the %
variation explained by the first two principal components (PC1, PC2).
57
Table 3.13. Spearman rank correlation coefficient rs between bird densities and environmental variables, significance given in parenthesis, n=8. Significant values at p<0.1 are in bold.
63
Table 3.14. Indicator values generated by IndVal analysis. The highest values correspond to
indicator species for the site. Significance is according to Monte-Carlo test for observed maximum indicator value of species. Significant values at p<0.1 are in bold, at p<0.05 marked with (*).
LIST OF ABBREVIATIONS
BQE – Biological Quality Element EQS – Ecological Quality Status EU – European Union
IndVal – Indicator Values analysis MI – Maturity index
GPS – Global Positioning System PCA – Principal Component Analysis SD – Standard Deviation
SE – Standard Error
TOC – Total Organic Content WFD – Water Framework Directive WWTP – Waste Water Treatment Plant
1. INTRODUCTION
1.1. Wetlands and shorebirds conservation
Wetlands and coasts are of essential importance for support of population of many bird species and also biological diversity of other taxa. For this reason, Ramsar Convention on Wetlands (1971) was one of the first international environmental agreements to be developed and one of its main focuses is protection and conservation of bird populations. In the European Union the Directive 79/409/EEC on the protection of wild birds (Birds Directive), Water Framework Directive (2000/60/EC), Directive on the Conservation of Natural Habitats (92/43/EEC) form a legislation framework arranged to organize the nature conservation measures at all levels, especially on the level of decision-making. Management of many coastal territories declared a Ramsar site and Natura 2000 sites requires knowledge about bird communities and their response to various human activities. The knowledge of bird communities’ response to human impact should be a basis for implementing the EU Directive on Birds and Habitat Directive at the level of decision making. As per Council Directive 92/43/EEC (Habitats Directive), 1992, “conservation status of a natural habitat means the sum of the influences acting on a natural habitat and its typical species that may affect its long-term natural distribution, structure and functions as well as the long-term survival of its typical species”.
Wetlands and coasts are among the ecosystems under the highest anthropogenic pressure due to their economical goods and services. The impact comes in forms of physical alteration (coastal engineering, sediment dredging, and construction), pollution by urban sewage, agricultural runoff and industrial waste, overexploitation of the biological resources (fish, shellfish), changes at the watersheds which impact hydrological regime (Barnes, 1980).
Shorebirds are one of the most threatened animal groups, dependant heavily on estuarine areas and showing clear decline during last decades, mainly because of habitat loss and side-effects of human activity impact (Stroud et al., 2006; Wader Study Group, 2003). Council
Directive 79/409/EEC (“Bird Directive”) states: ”A large number of species of wild birds naturally occurring in the European territory of the Member States are declining in number, very rapidly in some cases; whereas this decline represents a serious threat to the conservation of the natural environment, particularly because of the biological balances threatened thereby…” The future of this group depends on availability of suitable quality habitat to support sustainable bird populations. Knowledge about the importance of physical habitat characteristics to the site selection of birds is a prerequisite for understanding their habitat ecology and distribution, as well as managing their habitats (Boere et al., 2006; Granadeiro et al., 2007; Lourenço et al., 2005). Shorebirds may represent itself flagship species for conservation of the wetlands and coastal areas, as they can relatively easy attract attention of the broad public (BirdLife Int., 2004) to problems of conservation.
1.2. Birds as environmental indicators
Indicator species in general are considered to be able to provide a cost- and time-efficient mean to assess the impacts of environmental disturbances on an ecosystem (Carignan & Villard, 2002). Birds are considered suitable group to be used as ecological indicators (Koskimies, 1989) in monitoring of ecological integrity and ecosystem change.
Some characteristics of birds as ecological indicators are reported as follows:
Birds are valid indicators of biodiversity, species richness and endemism patterns (Gregory et al., 2003);
Birds have wide geographical distribution in almost all kinds of habitats worldwide; Birds respond to environmental change over large and small spatial scales (Temple
& Wiens, 1989);
Bird populations’ species composition, abundance and reproductive success are influenced by the habitats characteristics (Mazerolle and Villard (1999) and
3 Birds are on top of the trophic chain in ecosystems and so can provide integrated information on the ecosystem status (Temple & Wiens, 1989) and are indicative of more general situation among other taxa;
Changes in bird populations tend to integrate a set of ecological factors, including biotical and physical (Gregory et al., 2009; BirdLife Int., 2004);
Birds are mobile and responsive to environmental changes (BirdLife Int., 2004);
Birds can be effectively censused on different spatial scales (Carignan & Villard, 2002);
Populations can be relatively easily assessed, detected and identified by physical appearance, vocalization and traits, sometimes without requirement of high expertise of observer (Hutto, 1998);
Scientific knowledge available on birds’ biology and ecology make them one of the best studied groups of indicator organisms (BirdLife Int., 2004);
Many bird species are specialized in their requirements and have narrow distributions or ecological niches, potentially being sensitive indicator of local ecosystem change (Cramp and Simmons, 1983; );
Some bird species are of economical importance, linking natural and socio-economic components (BirdLife Int., 2004), or can serve as “flagship” species to rise public attention to the conservation problems.
Ecological indicators based on birds were used in study and monitoring of various ecosystems. Birds were used as indicators to assess forest ecological integrity (Canterbury et al., 2005; Florenzano, 2004) using population trends of multiple species. Bird assemblages are reported to respond to landscape patch characteristics in forest and agricultural landscapes (Mazerolli & Villard, 1999). Songbird assemblages were used for assessment of the conditions of forested watersheds (Bryce et al., 2005). Some groups of birds (woodpeckers) were shown to be reliably indicative of avian diversity of forests (Drever et al., 2008). Aquatic birds have been
used as indicators of trophic change of the estuarine food-webs, and were found to respond to nutrient impact and density of plankton and fish, as well as habitat alteration (Fernandez et al., 2005). Seabirds were suggested to be used as indicators of the status of the marine environment, and as indicators of the food supply of vertebrate predators (Parsons et al., 2008).
Bird population trends of 124 European species were shown to respond to recent climatic change in the way of divergent trends (populations respond positively or negatively) and biological indicator of climatic change impacts was developed (Gregory et al., 2009). Geographical range of species and population size were parameters used as indicators of climatic change. In some countries, indicators based on birds were included in the national monitoring schemes, e.g. UK wild bird indicator (Gregory et al., 2005). Parameters used for assessment of bird indicators were species occurrence, abundance (Gregory et al., 2003), population size, population trends, geographical range (Gregory et al., 2009), reproductive success, nest abundance, predation (Mazerolle & Villard, 1999).
There were identified constraints that arise form the use of indicator species as integrative measure for ecosystem status (Hutto, 1998): 1) There is not possible to monitor all species, and choice of several indicator species requires excessive time and effort; 2) The narrow group of chosen species usually does not represent the conditions required by all others; 3) The costs required to monitor rare species which are usually used as indicators are high, and 4) The research attention given to the indicator species group is diverted from other species, environmental requirements of which could be different. Therefore, it was suggested to use wide species groups, including birds as indicators. The principal problem regarding using birds’ population change data as bio-indicators is that the exact cause of detected change is usually unclear, and is a function of many complicating factors, including natural population cycles. There is also a difficulty in associating the observed effect with acting factors, as well as which direction of population change corresponds to adverse change in the environment (Temple &
5 Shorebirds’ ecological peculiarities suggest this group as suitable ecological indicator. According to International Wader Study Group (2003), “Knowledge of the status of wader populations can provide important information on the wider environment, including those caused by climate change as well as from habitat loss, and degradation of habitat quality as well as those caused by climate change.“
Shorebirds are closely connected to their habitat and linked to environmental changes, abundant and can be relatively easily counted. As a consequence of long-distance migrations, they can be used as indicators at the breeding grounds, on the stopover sites where they tend to concentrate with high density and in the wintering grounds (Flint, 1998). Shorebirds and wading birds represent high trophic level predators in the intertidal ecosystem (Reize, 1985) and therefore can provide integrative measure of condition of the entire ecosystem. Most shorebirds species migrate on long distances between breeding and wintering grounds (Cramp and Simmons, 1983) and therefore depend on habitats located along the flight paths in different geographical zones. Thus they are considered (Piersma & Lindstrom, 2004) to provide information about environmental change occurring over a large spatial scale. The extremely long flight distances of several species (Red Knot, Bar-tailed Godwit, Ruff, Ruddy Turnstone, Greater Knot and others) impose energy requirements thus making these species highly dependant on quality of feeding habitats, including at stopover sites (Evans, 1976; Hedenstrom, 2010; Piersma & Jukema, 1990).
1.3. Shorebirds and habitat characteristics
Shorebirds are closely related to the environmental characteristics of their habitat. Many shorebird species depend on coastal estuarine areas in different seasons, including winter, summer breeding season and resting periods during migration (Granadeiro et al., 2004).
The distribution of shorebirds in the intertidal areas depends to a large extent on the patterns of occurrence of their invertebrate prey (Piersma et al., 1993; Yates et al., 1993). This
relationship exists in different spatial scales (Goss-Custard & Yates, 1992; Moreira, 1993; Yates et al., 1993).
Physical sediment parameters of the feeding areas directly influence the distribution and occurrence of birds´ invertebrate prey, and mediate the density of shorebirds (Goss-Custard & Yates, 1992; Yates et al., 1993). For example, the densities of birds are known to respond strongly to the particle size of surface sediments. This is both due to their preferences in terms of sediment penetrability and wetness (often related to their bill morphology) but also to the indirect effect that these parameters exert in the abundance of their invertebrate prey (Myers et al., 1980; Sutherland, 1982; Hicklin and Smith, 1984; Goss-Custard and Yates, 1992).
There were found responses of shorebirds to habitat properties at fine scale (Mouritsen & Jensen, 1992; Santos et al, 2009). The prey density and availability were the main factor of bird distribution, but physical sediment characteristics, such as penetrability and water content, also were important because they can influence detectability and capture rate of the prey (Mouritsen & Jensen 1992). Wader distribution at fine scale has been reported (Mouritsen & Jensen 1992) to strongly respond to microhabitat features. One of these aspects is association of waders with intertidal channels and epistructures that cross mud flats. Waders were reported to occur in higher density and apply more foraging effort in close proximity of the drainage channels (Granadeiro et al., 2005), suggesting the higher density or accessibility of their prey in close range to the channels.
Feeding habitat use of shorebirds is not restricted to intertidal areas and shores, very often birds use supratidal habitats such as salt pans. The three hypotheses for such a behavior are species specific site preference, complementary food supply and avoiding disturbance on the main foraging grounds (Masero et al., 2000).
The energetic requirements of feeding make shorebirds restrict their choice to invertebrate prey that is not only available, but also profitable, e.g. is of sufficient size (and energy content) to
7 This leads to the choice of prey of particular size, and therefore restricts the birds to fraction of the total available benthic biomass (Zwarts & Wanink, 1993), reducing total available food resource.
Table 1.1. Known food items of common shorebird species. Majority of benthos species identified
at study sites (Appendix B) are known to be taken by observed bird species.
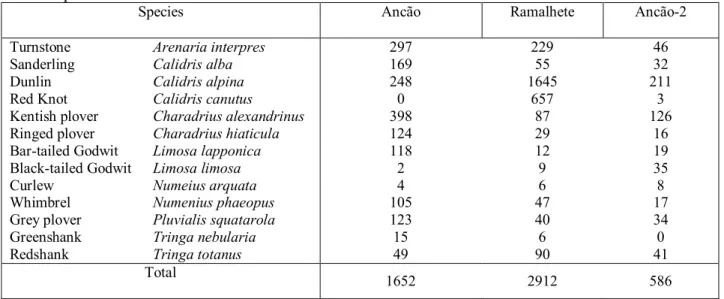
Bird species Food items References
Turnstone Arenaria interpres
Insecta, Mollusca (Hydrobia ulvae, Cerastoderma, Scrobicularia), Amphipoda, Decapoda
Sanderling Calidris alba
Insecta, Crustacea (Gammaridae,), Mollusca (Dreissena, Hydrobia, Mytilus), Polychaeta, Cnidaria, fish.
Cramp, Simmons (1983)
Dunlin Calidris alpina
Polychaeta (Nereis diversicolor), Mollusca (Hydrobia ulvae, Cerastoderma, Scrobicularia), Amphipoda, Decapoda (Carcinus maenas), Diptera Luis et al (2002) Cramp, Simmons (1983) Kentish Plover Charadrius alexandrinus
Polychaeta (Nereidae), Crustacea (incl. Carcinus maenas), Mollusks (Hydrobia, Littorina, Cardium), Amphipoda, Insecta
Ringed Plover
Charadrius hiaticula
Polychaeta (incl. Nereis, Notomastus, Scolopsos, Arenicola, Phyllodoce) Amphipoda (incl. Corophium, Batyporeia), Isopoda, Mollusca (Hydrobia, Littorina, Macoma, etc.) Oligochaeta, Insecta
Bar-tailed
Godwit Limosa lapponica
Mollusca (Littorina, Macoma, Hidrobia,)
Crustacea (Balanus, Gammarus, Jaera, Corofhium, Carcinus, Crangon, Talitrus)
Polychaeta (Arenicola, Nereis, Lumbricus, Heteromastus)
Cramp, Simmons (1983)
Whimbrel Numenius phaeopus Decapoda, Mollusca (Litorina,
Nucella), Polychaeta (Arenicola) Cramp, Simmons (1983)
Grey Plover Pluvialis squatarola
Polychaeta (incl. Notomastus, Arenicola, Phyllodoce, Nereis), Mollusca (Gastropoda, Hydrobia, Macoma, Cerastoderma edule, Scrobicularia plana, etc.), Crustacea (incl. Amphipoda)
Cramp, Simmons (1983) Lopes et al. (1998) Moreira (1996)
Greenshank Tringa nebularia Insecta, Polychaeta, Mollusca, Crustacea, fish
Redshank Tringa totanus Insecta, Polychaeta, Mollusca, Crustacea
Cramp, Simmons (1983) Moreira (1996)
Invertebrate prey activity can influence foraging behavior of waders (especially visual foragers) on the intertidal flats (Evans & Dugan, 1984). Sediment drainage has effect on the activity of invertebrate prey and therefore influences the foraging behavior and intertidal flat use
by waders (Rosa et al, 2007). Many species were reported to follow the tidal water line during feeding (Granadeiro et al, 2006).
Food items of the most common shorebirds in the study area obtained from the literature are presented in Table 1.1.
9 1.4. Ria Formosa lagoon
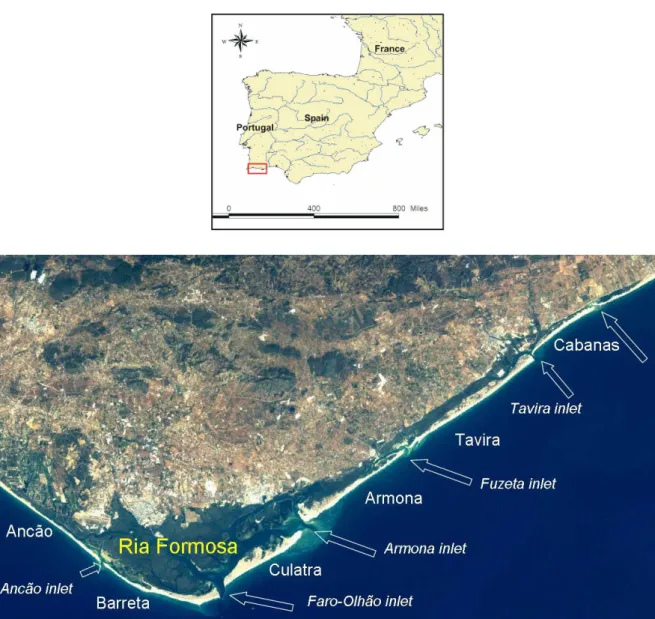
The Ria Formosa lagoon is situated in the South-West of Iberian Peninsula in the Algarve region of Portugal. It is located between the coordinates of 37o 02’ N latitude and 36o 57’ and 7o 31’ and 7o 52’ W longitude (Figure 1.1). The Ria Formosa is a shallow, mesotidal barrier lagoon system. This is one of the largest coastal lagoons of this type in Europe; it has the length of 55 km and 6 km maximum width (Mudge and Bebianno, 1997). The area of the lagoon is approximately 100 km2.
Figure 1.1. Geographical position and satellite image of the Ria Formosa lagoon (map base:
The lagoon has 14,522 ha of wetlands, including 11,800 ha of intertidal area (Mudge et al., 1997). The average depth is 3.5 m overall and 2 m in the shallow Eastern part. The watershed covers an area of approximately 864 km2 (Duarte et al, 2008).
This coastal lagoon is separated from the Atlantic Ocean by several barrier islands (Barreta, Culatra, Armona, Tavira and Cabanas) and peninsulas (Ancão and Cacela). Water is exchanged by the tides with the oceanic waters through six inlets, four natural (Armona, Fuzeta, Cacela and Tavira) and two artificial (Faro-Olhão, INDIA) (Cristina, 2006; Garcia, 2002). The artificial INDIA inlet was artificially constructed in 1997 during the Inlet Dynamics Initiative project for the Algarve (INDIA), partly with the aim of improving the water quality in the Ancao Basin.
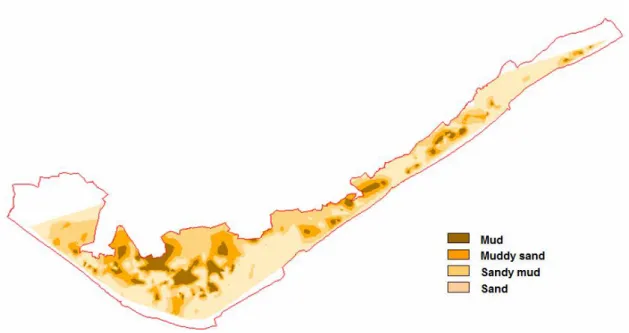
The lagoon is mesotidal, with tidal range from 1 to 3.5 m. Tides are semi-diurnal, water residence times normally vary from 6 hours to 2 days, but can be as high as 4 – 6 days in zones of restricted exchange (Mudge et al., 2008, Loureiro, et al, 2006). During each tide 50 – 75% of water mass exchanges with ocean. Intertidal area consists of salt marshes, intertidal flats, sand spits. The sediments type are mostly sandy on the barrier islands, and sandy-muddy or muddy in the intertidal area (Figure 1.2).
The Ria Formosa coastal lagoon is classified as coastal water according to the Water Framework Directive (European commission, 2000). There are no significant freshwater inputs sources and the salinity gradient in the lagoon is insufficient to be classified as transitional water (Newton & Icely, 2002). Freshwater inflow system consists of one river and 14 temporal streams. The one small permanent river Rio Gilão flows into Eastern part of the lagoon. The other fourteen small, torrential streams flow into the lagoon only after heavy rainfall, mainly in the Western part. Another permanent stream, Ribeira de São Lourenço, used to flow into the West of the lagoon (Ancão basin), but was completely dammed in the 1800s with a dyke, and now is an irregular source of freshwater inflow. The salinity of the water ranges 35.5 – 37.8 ‰, depending on the tidal stage and season (Mudge et al, 2007).
11 The Algarve region is characterized by a Mediterranean climate, with hot dry summers and warm wet winters. Based on annual and monthly data there seems to be an increase in irregularity in annual precipitation in the basin, the average annual precipitation values are between 600 and 800 mm. The month with most precipitation is December with about 17% of total annual, followed by November and January with about 15% (Duarte et al., 2008).
Figure 1.2. Sediment grain size composition in the Ria Formosa lagoon (Environmental Systems
Analysis group, FCT/UNL)
1.5. Ecological importance and main pressures
The Ria Formosa has been designated as a Natural Park in 1987. Internationally, it forms part of the Natura 2000 European network for nature conservation, it is a Ramsar wetland and it is the Special Bird Protection Area (European Directive 79/409/EEC). The Ria Formosa Natural Park has 78,000 ha in area, with 10,000 ha of lagoon, 5,000 of salt marsh and aquaculture ponds (Caetano et al., 2002).
This lagoon is exposed to different types of anthropogenic impact of various degrees. The main pressures affecting the ecological conditions are urbanization, sewage discharge, coastal alterations, tourist activities, aquaculture and shellfishery (Gamito, 2008; Serpa et al, 2005; Cristina et al., 2006).
Major contaminants include untreated sewage and discharges from industrial units, agriculture, ports, marinas, aquaculture, and the associated road network. The discharge of sewage is one of the major anthropogenic impacts affecting the lagoon. During the summer months tourism increases the population from 150,000 to 450,000 people. Most sewage only receives primary screening, especially during summer months when capacity at the treatment plants is exceeded. Consequently, there are numerous sources of sewage-derived organic matter identified in the western part of the lagoon (Mudge and Bebianno, 1997). Despite these pressures, because of the high water exchange and the absence of industry the Ria Formosa can be classified as showing no or only very minor human impact (Newton & Icely, 2002).
1.6. Ecological Status according to the Water Framework Directive
The Water Framework Directive (2000/60/EC) is a common framework of measures undertaken by the EU member states, and aims at achieving a good ecological qualitative and quantitative status by 2015. Under the Common Implementation Strategy of the WFD, the mesotidal Ria Formosa lagoon has been classed as a very sheltered, shallow, coastal water due to absence of significant freshwater inflow (Newton et al., 2003).
Table 1.2. Ecological status of Ponte and Ramalhete intercalibration sites in terms of Water
Framework Directive, based on different Biological Quality Elements (BQE) and Environmental Quality Ratios (EQR)
EQR Ecological status EQR Ecological status BQE Ponte Ramalhete Source
General 0.8 High 0.6 Good Commision Decision
2005/646/EC Physico-chemical and
Phytoplankton 0.8 High 0.6 Good Loureiro et al., (2006) Phytoplankton 0.7 Good 0.7 Good Newton et al. (2007) Benthic invertebrate 0.66 Good 0.73 Good Newton et al. (2007)
13 On the basis of historical and current research data, two sites in the Ria Formosa lagoon have been identified as intercalibration sites for WFD (Table 1.2): Ponte de Praia de Faro (High/Good boundary conditions, Code C3978, Type NEA26) and Ramalhete (Good/Moderate boundary status, Code 3979, Type NEA26).
1.7. Benthic fauna community
Austin et al. (1989) examined both macrofauna and meiofauna communities along a pollutant gradient in Ramalhete channel and the channel leading to the main inlet of the lagoon. Indicators of community structure were determined for two size benthos groups and compared between each other. The macrofauna and meiofauna are distinct ecologic components of the benthos (Warwick, 1984) and so may respond to pollution in a different way. In the study by Austin et al. (1989) it was suggested that not sewage but shellfisher’s digging affected the macrofauna community by physical disturbance. Meiofauna and macrofauna communities did not respond to the organic enrichment in the same way and ecological factors affecting these benthos groups were concluded to be different.
The existence of sewage discharge sources in the Ancão basin in the extreme western part of the lagoon affects the meiofaunal communities. The research of meiofauna by Hewitt and Mudge (2004) showed that there were 2 regions in the basin where meiobenthos community structure responded to organic enrichment of sewage origin (Figure 1.3). One was located in the NW part close to Quinta do Lago complex (points 39, 50, 57) and another near the Esteiro do Maria Nova stream, contaminated with sewage (points 41, 42). Points 40 and 26 located at the study site Ancão were charachterized by signature of a community influenced by organic matter of a clean community (Figure 1.3).
Figure 1.3. Effect of sewage discharge on meiobenthos communities. The amount of variance
predicted for each site by the signature of a community influenced by organic matter of a sewage origin, PLS model (Hewitt, Mudge, 2004).
The same work suggests that meiofauna, due to its small size does not respond to mechanical stress caused on the sediments by the shellfisheries disturbance. It is concluded that it makes meiofaunal communities well suited to diagnostic application in assessment of organic (including sewage) and chemical pollution. At the same time, univariate measures such as diversity indexes, evenness, and species richness were found to show little response to physical and pollution differences between the sites (Hewitt & Mudge, 2004).
15 1.8. Shorebirds of the Ria Formosa
Ria Formosa coastal lagoon is one of the most important sites in the Iberian peninsula used by shorebirds during wintering and migration. It is situated in the East-Atlantic migratory flyway of the migrating birds, and represent important stopover point as well as wintering ground for many species, it supports up to 20,000 wintering birds every year, and considerable proportion of European population of several of them (Rufino, 1979). Considering the number of overwintering birds it satisfies the 1% criterion of the site of international importance by the Ramsar Convention (Costa & Rufino, 1997). The lagoon is part of Natura 2000 Network, Special Protection Area for birds, Ramsar site and a National park.
Based on morphometric characteristics (wing length in adult and juvenile birds) Batty (1993) found that Dunlins Calidris alpina migrating through Ria Formosa belong to different races: juveniles during autumn migration belonged to race C. a. schinzii.
Fonseca et al. (2005) recorded following species breeding on the salt pans near Tavira wetland: Black-winged Stilt Himantopus himantopus, Pied Avocet Recurvirostra avosetta, Kentish Plover Charadrius alexandrinus, Little Tern Sterna albifrons, Mallard Anas platyrhynchos and Little Grebe Tachybaptus ruficollis.
1.9. Aims and objectives of this study
This study is focused on comparison of environmental quality of the intertidal flats habitats of the Ria Formosa lagoon using shorebirds assemblages, physical sediment properties and benthic communities, considering known environmental status defined in terms of Water Framework Directive. The habitat quality and bird assemblages were compared between two sites in the western part of the lagoon, with presumably different ecological status (Newton et al., 2007; Loureiro et al., 2006) and consequently difference between sediment quality and shorebird communities was expected.
The main goals of the study are:
1. To study shorebirds assemblages in relation with intertidal habitat environmental properties, including benthic prey component, on the sites with different ecological status;
2. To compare the birds communities between sites;
3. To consider the possibility to use shorebirds communities as an indicator for assessment of ecological status of intertidal habitats of the Ria Formosa lagoon. To achieve these goals, the following specific objectives were addressed:
1. To study shorebirds assemblages of the intertidal habitats on sites with different ecological status, including spatial and seasonal variation;
2. To study physico-chemical parameters of the intertidal flat habitats: sediment particle size distribution, total organic content and reduction-oxidation potential; 3. To study meiobenthic and macrobenthic communities of the sediments at the same
study sites as birds assemblages, including abundance and species diversity; 4. To compare the study sites in terms of environmental parameters obtained; 5. To compare birds communities of the study sites;
17 6. To consider the relation between biotic components (birds and benthos) and
environmental parameters of the ecosystems;
7. To discuss feasibility of use the shorebirds assemblages as indicator for ecological status of intertidal habitat.
2. METHODS
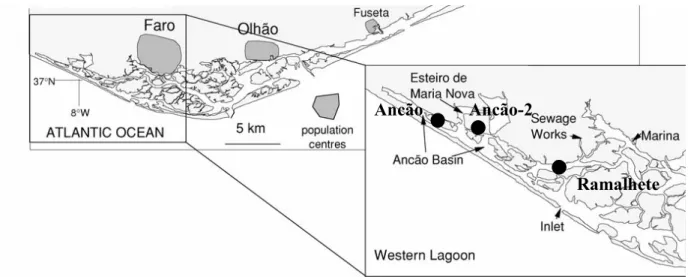
2.1. Study sites
Three intertidal study sites were chosen in the Western part of the lagoon (Fig.3.1). To test the hypothesis of a relationship between the birds’ community with the lagoon ecological status, the study sites were located close to the known intercalibration sites for Water Framework Directive (WFD), for which ecological status has been defined (Table 1.1).
Figure 2.1. Location of the study sites in relation to main population centers and sewage discharges
(Map base adapted from Wayland et al., 2008).
The choice of sites was made in order to have similar tidal regime, extension of the mudflats and exposition from one side to the water edge during low tide. Accessibility was taken into account, so that both sites could be visually inspected from the salt marsh or dyke without disturbing birds feeding on the mudflats.
Ramalhete
19 Figure 2.2. Study site Ramalhete is located in the vicinity of the Water Framework Directive
intercalibration site. (Map base: Google Maps, 2009)
Figure 2.3. Study sites in the Ancão basin. Ancão site consists of the transect of 8 square sampling
units, with two benthos sampling points. Ancão-2 site is not divided into quadrats, has one benthos sampling point.
Ramalhete site (Fig. 2.2) is situated on the Northern side of the channel with the same name, at the place of intercalibration site, used for monitoring within the WFD. The boundary status for the site was defined as Good/Moderate (Table 2.1). The Ramalhete channel has restricted water exchange compared to outer parts of the lagoon, with higher water residence times, especially of the deep layer of water (Mudge et al., 2008). This can lead to a decrease in the level of dissolved oxygen, and affect the sediment benthic fauna.
The Faro Noroeste waste water treatment plant is located in 1.5 km from the Ramalhete channel, and though it does not discharge directly into the channel, the water contaminated with sewage organic matter may enter the channel due to tidal movements (Mudge et al., 2008; Pires, 2004). This can lead to organic matter accumulation and nutrient enrichment combined with restricted water exchange, causing increased oxygen demand and nutrient enrichment.
Ancão site is situated in the upper part of the Ancão channel, on its Northern bank and is adjacent to the salt marsh and former fish ponds recently converted into shellfish grounds (Fig.3.3). The Ancão and Ancão-2 sites are located in the part of the lagoon which belongs to the same water body as the Ponte de Praia de Faro WFD intercalibration site with High ecological status, and boundary conditions being defined as High/Good (Commission Decision 2005/646/EC, Newton et al., 2007). The choice of the sampling area directly at the Ponte WFD site was not feasible because of the busy road and bridge proximity that influence the abundance of birds due to disturbance effect.
Ancão-2 site was chosen for comparison with the values obtained on the two main sites, being different in location relatively to low water mark and having a different configuration, mud flat extent and exposition to the tide (Fig. 2.3). It was not practical to establish square sampling units there, because of complicated shape, larger size and absence of suitable landmarks at the site. The observer could not move along the shore as in case of two other sites, hence the counts were done from two vantage points at distance up to 200 m.
21 Ancão and Ramalhete sites were divided into 8 square sampling units each, used for bird counts. The quadrats were grouped into transects, parallel to the shore and with one side exposed to the water edge at low tides. The transects length on both sites was 400 m, with sampling quadrates 50 x 50 – 80 m in size, depending on the mud flat extension. The borders of the quadrates in many cases coincided with the landmarks of shellfishery possessions, and therefore differed in the rate of sediment disturbance, because the activity of different fishermen was not the same. In some cases the intertidal creeks intercepted transects, increasing the length of water edge in the quadrates, which may have important consequences on ecological conditions, including particle size and accessibility of the prey for birds (Zwarts and Wanink, 1993; Lourenço et al, 2005). Benthic samples were taken from two quadrates on Ancão (A2, A3) and Ramalhete (R2, R7) sites, one sample was taken at the Ancão-2 site.
Distance to the suitably located high-tide roosts can limit the access of shorebirds to feeding habitats (Dias et al., 2006). At Ramalhete the available roosting sites were salt pans adjacent to the site and salt marsh at distance 50 – 200 m (Fig.3.2). The distance to sandy shore was 1,800 m. At Ancão site (Fig.3.2), the closest roosts were salt marsh (adjacent to the transect), fishponds (50 – 400 m), salt pans ( 1 km ), freshwater wetland (400 m) and sandy shore (200 m). Ancao-2 site was located close to salt marsh (50 m), salt pans and freshwater wetland (200 m), and sandy shore (500 m).
2.2. Granulometry analysis
Granulometry (particle size distribution) of the mud flat sediments is known to affect the benthic fauna communities and as a result, spatial distribution of shorebirds assemblages (Yates et al, 1993; Granadeiro et al, 2007).
Sediment granulometry samples were taken approximately in the center of each quadrate, one sample per quadrat. In the quadrates A-2, A-3, R-2, R-7, Ancao-2 with the benthos sampling stations, the granulometry samples were taken within 5 m from the center of the benthos
sampling station, in three replicates. The A3, R2 and R7 sites were sampled for sediment granulometry in three spatial replicates to provide coverage of mud flats surface variability. The stations were located using known landmarks and GPS unit Garmin 48. The core of 20 cm diameter was pushed to the sediment to the depth of 5 cm, the sediment was then extracted to the plastic bag, closed without air, carried to the laboratory within 2 hours and kept frozen at -20 oC before the analysis.
The sub-sample of 100 g from sandy and 150 g from muddy water-saturated samples were taken for particle size analysis. The whole sample was previously homogenized by mixing. Organic matter was destroyed by treatment with hydrogen peroxide 130V water solution. The destruction was considered completed when the gas stopped to run out and the color of the sample changed from black to mineral yellow or brown. The sample was then wet-sieved with distilled water through 0.063 mm mesh. The coarse fraction remaining in the sieve was dried at 60 oC to constant weight. It was then dry-sieved through a series of 2, 1, 0.5, 0.25, 0.125 mm sieves using mechanical shaker. Each fraction was weighted with accuracy of 0.01 gram. The fine fraction in suspension which passed through the 0.063 mm sieve was put to volumetric flask, diluted to 1 L volume with distilled water if necessary and mixed with added anticoagulant (Calgonite) during 5 minutes with spinning mixer and left to settle down for 24 hours. Then it was mixed until homogeneity and after 20 seconds a volume of 20 ml was taken from the depth of 20 cm to the glass of known mass, dried and weighed. The obtained sediment mass was multiplied by 50 to equalize it to the 1 L volume and considered as a measure for the total mass of finer than 0.063 mm fraction of silt and clay in the sample. The rest of the suspension was analyzed with laser granulometer (Malvern Instruments Mastersizer) to obtain the distribution diagrams of the fraction finer than 0.063 mm. The resulting volumetric distribution of particles was assumed to be equal to the mass distribution.
23 2.3. Sediment total organic content analysis
Sediment total organic content (TOC) was measured by combustion of organic matter (Hewitt and Mudge , 2004).
Samples were taken in three spatial replicates within each quadrate. One replicate sample was subsampled from the granulometry core. Other two replicated samples were taken from cores 5 cm in diameter and 5 cm in depth, closed in a plastic bag without air and frozen before analysis. Samples were wet-sieved through 2 mm sieve to remove big invertebrates and algae, then homogenized. Approximately 25 – 30 g of the sediment was put into thick aluminum foil containers of known weight and dried in the oven to constant weight at 50 oC, then kept in desiccator to remove moisture and weighed. Samples were then combusted at 440 oC during 4 hours in the ventilated muffle furnace, then cooled in a desiccator for several hours and weighed. Total organic content was calculated as the difference in dry weight before and after combustion divided by initial dry mass and expressed as a percentage value:
TOC = [m (dry sediment) – m (combusted sediment)]*100% / mass of dry sediment.
2.4. Reduction-oxidation potential
Reduction-oxidation potential was measured to give an indication of the reducing properties of the sediments. Redox measurements were made in situ with a CellOx325 probe at three random locations within sampling quadrats. One of the replicates was made at the same point and simultaneously with granulometry and TOC sampling. Three sub-replicate measurements were made within 20 cm around the sediment cores positions. Redox was determined in the uppermost sediment layer between the surface and 2 cm depth. At stations A2 and R2 it was also measured at depth of down to 10 cm to examine the change of reduction-oxidation conditions with depth.
2.5. Birds census
Bird census was conducted from late March to early October 2008. Counts were made during periods of spring tides. In spring (March - May) and autumn (August - October) two visits were made to each site every two weeks, in summer (June – July) normally one visit was made fortnightly at Ramalhete and Ancão-2 sites because of low birds numbers. Two sites could not be visited at the same day during low tide, so visits covered four consecutive days every two weeks, according to the tidal cycle. From March to July one count was done during a visit, from late July till September two counts were normally carried out during a visit with 30 minutes interval between them. The sampling scheme resulted in 34 counts at Ancão site (9 in spring, 11 in summer and 14 during autumn), 22 counts at Ramalhete (9 in spring, 4 in summer and 9 in autumn) and 12 at Ancão-2 site ( 2 in spring, 6 in summer and 5 in autumn). Counts were made when the mudflats were open to their maximum extension between 2 hours before and after the predicted time of low water. All the counting quadrats at Ancão and Ramalhete sites had similar exposition time.
Birds were counted from the dyke of the salt pans on Ramalhete, and from the salt marsh on Ancão, from the distance 20 – 100 m using 12x binoculars. Local landmarks were used to determine the borders of counting units, distances were measured using GPS Garmin 48. Birds foraging near the water edge at the side of the quadrats were considered to be within the quadrat. In case when there was an intertidal channel between quadrats, birds feeding on the different banks were considered to belong to the respective quadrats. The observer slowly walked along the transect of counted quadrats making stops for counting. Birds were generally not disturbed by the observer. There were often shellfishers present on the tidal flats, usually 2 – 3 persons along the transect. The presence of shellfishers has been found to have no significant disturbing effect on feeding birds distribution (Dias et al, 2008), so this factor was not considered as obstacle for counting. The presence of fishermen was recorded for each quadrat.
25 2.6. Macrobenthos
(Sampling, identification and calculations of macrobenthos were done by M. Cañedo- Arguelles.)
Macrobenthos was sampled on 5 stations, in quadrats A2 and A3 at the Ancão site, R2 and R7 at the Ramalhete site and at Ancão-2 site. For taking benthos samples a core sampler was used. Samples were taken in three spatial replicates at each station. The sample was washed through the 0.5 mm mesh in situ. All the taxa were preserved in 70 % ethanol. Once in the lab samples were rinsed through 250 micrometers mesh size net, benthos individuals were shorted, identified to species level and counted for density calculation.
2.7. Meiobenthos
(Sampling, identification and calculations of meiobenthos were done by K. Ivanova.) Meiobenthos was sampled on the same 5 stations as macrobenthos and simultaneously with it. Sediment samples for meiofauna analyses were collected at mudflats during low tide by plastic syringe (diameter 2 cm) with three replicates on each station, preserved in the 70% ethanol. Sediment samples were sieved through 63 mm mesh size. Retained fraction was centrifuged with Ludox as described by Heip et al. (1985). Nematodes were extracted and mounted on microscope slides following Warwick et al. (1998). Identification guides Warwick et al. (1998) and recent publications on Nematode taxonomy were used for Nematoda identification to genus level.
2.8. Data analysis
Bird count data was averaged according to season, meaning counts from March to May corresponding to spring pre-nuptial migration were considered “Spring”, from June and July (summer breeding period) “Summer” and from August to October (autumn migration) as “Autumn”. Bird densities were obtained by division of abundance of every species in a particular
sampling quadrat by its area. The area of Ancão-2 site was determined using program ArcView version 3.2a by ESRI, based on scaled satellite image.
Classification of samples by sediment particle size distribution was done using GRADISTAT (Excel version 11) program. The relationship between fraction grain size <63 μm and TOC was explored using regression analysis. Abundance of taxa, diversity (Shannon-Wiener index H´), species richness (Margalef index d) and evenness eH/S were calculated using PRIMER version 6.0 and Past version 2.02.
Hypothesis about significant differences between sites by environmental variables (particle size, TOC, redox) were investigated by means of Mann-Whitney U-test and Kruskal-Wallis non-parametric ANOVA (Quinn and Keogh, 2002). The non-non-parametric methods were used because sample size was small (n=3 for individual quadrats, n=8 for the whole sites) and data was not assumed to be normally distributed due to its nature.
Spearman rank correlation analysis was used to check relation between bird species densities with environmental parameters. The non-parametric correlation was used because of small sample size. Two independent correlations were calculated for Ancão and Ramalhete sites, using sampling quadrates (n=8) as correlation units in order to avoid the spatial factor. The location of them along the transect lines could lead to intercorrelation induced by spatial dependency of the sampling sites. This aspect was not considered an obstacle, because environmental variables were obtained from sampling locations in the centres of every quadrat at the range of not less than 50 m and though were considered independent. Bird counts were also considered independent between quadrats, having regard to their ability to move in choice of habitat without any physical barriers within site. Non-parametric analyses were done using Statistica version 6.0.
Principal Component Analysis (PCA) was used to investigate the differences between bird communities. Bird density data was previously log10 (x+1) transformed to downweight the
27 (MDS) were used to investigate environmental variables and structure of benthos and bird communities. Software used for multivariate statistics was PRIMER v. 6.0.
Partial Least Squares analysis implemented in Umetrics SIMCA-P software was used to investigate data for relations between environmental variables, benthos and birds.
The Individual Values analysis (IndVal) was conducted to determine indicator bird species associated with particular site. This analysis provides measurement of each species site fidelity and specificity, resulting indicator species are indicative of particular groups of sites (Dufrene & Legendre, 1997). Monte-Carlo randomization test (N permutations = 999) was run to determine significance level of obtained indicator values. Software used for IndVal analysis was PC-ORD version 5.
3. RESULTS
3.1. Environmental parameters 3.1.1. Sediment particle size
Table 3.1 and Figures 3.1 and 3.3 illustrate sediment particle size distribution and classification of the sediment at the study sites, according to Blott and Pye (2001).
Table 3.1. Sediment particle size distribution (%) and classification of sampling units, Ramalhete,
Ancão and Ancão-2 sites (According to GRADISTAT, by Blott and Pye, 2001). Particle size, mm
Gravel Sand Silt Clay
Station
>2.0 1.00-2.00 0.02-0.063 <0.002
Classification
A1 3.6 55.2 32.9 8.3 Slightly Gravelly Muddy Sand
A2 - 62.8 32.4 4.8 Muddy Sand
A3 4.8 21.3 60.1 13.8 Slightly Gravelly Sandy Mud A4 2.4 63.5 27.1 6.9 Slightly Gravelly Muddy Sand
A5 7.5 58.1 27.9 6.4 Gravelly Muddy Sand
A6 6.1 62.1 26.1 5.7 Gravelly Muddy Sand
A7 1.0 58.7 33.6 6.7 Slightly Gravelly Muddy Sand A8 2.0 71.3 20.7 6.0 Slightly Gravelly Muddy Sand R1 3.0 48.0 40.6 8.5 Slightly Gravelly Sandy Mud R2 0.4 78.9 15.6 5.0 Slightly Gravelly Muddy Sand R3 0.6 27.7 63.6 8.2 Slightly Gravelly Sandy Mud R4 4.3 74.6 16.3 4.8 Slightly Gravelly Muddy Sand R5 2.1 64.8 25.9 7.3 Slightly Gravelly Muddy Sand R6 0.5 43.2 43.8 12.5 Slightly Gravelly Sandy Mud R7 0.01 33.6 53.9 12.4 Slightly Gravelly Sandy Mud R8 3.6 63.5 26.0 6.9 Slightly Gravelly Muddy Sand Ancão-2 1.3 59.0 31.7 8.0 Slightly Gravelly Muddy Sand
Most quadrats on the Ancão site were classified as muddy sand with small content of gravel, the % of fraction <63 μm ranged from 27 to 42 %. The A3 quadrat was classified as sandy mud, with 85 % of clay and silt fraction. This contrast of sediment type is probably due to location at the bank of intertidal channel and absence of regular shellfish cultivation. At the Ramalhete site, four quadrats were considered sandy mud, the most muddy were quadrats R3 (72%) and R7 (66%), both located next to the intertidal channels. The other four quadrats were classified as muddy sand, with R2 being the most sandy (21% fraction <63 μm). The large sand
29 cultivation, in course of which the upper sediment layer wass mixed shellfishers and seagrass collectors or algae cover was removed. The quadrat R4 was likely affected by sand and gravel deposition during the construction of the salt tanks adjacent to the site, which can explain 28 % high sand fractions content. The silt and clay content showed a trend to increase from quadrat R4 to R7 from 21 to 66%. Mean content of the fraction GS<63 μm was 41.4 ± 18.0 for the whole Ancão site (A1 – A8), and 43.9 ± 19.9 % for Ramalhete site (R1 – R8).
0% 20% 40% 60% 80% 100% A1 A2 A3 A4 A5 A6 A7 A8 R1 R2 R3 R4 R5 R6 R7 R8 Ancao Ramalhete
Gravel Sand Silt Clay
Figure 3.1. Sediment particle size distribution at Ancão (A1 to A8) and Ramalhete (R1 to R8) sites. To compare the sediment particle size distribution between Ancão and Ramalhete sites Mann-Whitney U-test was conducted. Proportions of all defined fractions ranging from gravel (coarser than 2 mm) to silt (<2 μm), as well as total sand (0.063 – 2 mm) and mud content were compared (Table 3.2). The difference in granulometry between the two sites was significant only for the very coarse sand (1 – 2 mm) and very fine sand (0.063 – 0.125 mm) fractions (U=9, p=0.016 and U=8, p=0.012 respectively, n=8, df=7). The sites did not differ significantly by other fractions, including total sand and mud (GS<63 μm). The variation between different sampling
quadrats within each site was high, as illustrated in the Figures 3.1 and 3.2. Therefore, Ancão and Ramalhete as a whole were not different statistically in terms of sediment composition, but constituting sampling units demonstrated high within-site variability.
Table 3.2. Comparison of grain size fractions distribution between Ancão and Ramalhete sites:
Mann-Whitney U-test, n=8, df=7. Sites were significantly different by very coarse sand (1 – 2 mm) and very fine sand (0.063 – 0.125 mm) fractions at the level of significance p<0.05 (in bold).
Grain size fraction U z-value p
Gravel 23.0 0.95 0.345
Very coarse sand 9.0 2.42 0.016
Coarse sand 25.0 0.74 0.462
Medium sand 18.0 -1.47 0.142
Fine sand 32.0 0.00 1.000
Very fine sand 8.0 2.52 0.012
Silt 30.0 0.21 0.834
Clay 24.0 -0.84 0.401
Total Sand % 31.0 -0.12 0.916
GS<63 μm % 32.0 0.00 1.000
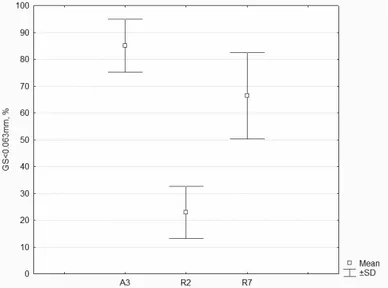
Sediment particle size composition at the quadrats with benthos sampling stations (average values with classification) is presented in the Table 3.3 and Figure 3.2. and illustrates mud flats surface grain size variability.
Table 3.3. Sediment particle size distribution (%) on the benthos sampling stations
Particle size, mm
Gravel Sand Silt Clay
Station code
>2.0 1.00-2.00 0.02 - 0.063 <0.002
Classification
A2 - 62.8 32.4 4.8 Muddy Sand
A3 2.5±2.1 12.5±7.8 68.1±7.1 17.0±2.8 Slightly Gravelly Sandy Mud
R2 0.4±0.4 78.9±10.1 15.6±6.8 5.0±2.9 Slightly Gravelly Muddy Sand
R7 0.01±0.02 33.6±16.1 53.9±12.9 12.4±4.0 Slightly Gravelly Sandy Mud
Ancão-2 1.3 59.0 31.7 8.0 Slightly Gravelly Muddy Sand
Comparison of sediment grain size distribution between three quadrats with benthos sampling stations was made by means of Kruskal-Wallis test using three spatial replicates within each unit (A3, R2, R7). The test revealed significant difference at P<0.05 (K=6.49, N=9, df=2, p=0.04) for both sand % and %GS<63μm fractions between the sites. This suggests that on the