Department of Marketing, Operations and Management
MAIN DRIVERS FOR MICROTRANSACTIONS AS IMPULSE
PURCHASES IN E-COMMERCE
Dissertation submitted as a partial requirement for the conferral of Master in Marketing
Ricardo Gil Fonseca Caetano
Supervisor:
Paulo Rita, Full Professor, Department of Marketing, Operations and Management Instituto Universitário de Lisboa (ISCTE-IUL)
Co-supervisor:
João Guerreiro, Assistant Professor, Department of Marketing, Operations and Management Instituto Universitário de Lisboa (ISCTE-IUL)
Abstract
With mobile technology evolving at a very fast-paced level, consumers now have many choices of entertainment on their mobile devices. Thousands of games are available to download free of charge on virtually every smartphone and with them a new revenue model has emerged: microtransactions.
Characterized by low price points, microtransaction have seldom been studied extensively. With great potential in the future, this type of revenue model is currently outgrowing traditional pay-to-play model types.
By focusing on several types of mobile game item drivers (Lehdonvirta, 2009) and adapting some previous research and models (Wu, Chen & Chiu, 2016; Yoo, 2015), this study intends to identify and create a model with the main drivers of microtransactions that lead to impulse purchases in mobile game applications and understand if a price increase will lead to a lower purchase intention.
A PLS-SEM analysis was conducted on a sample of 301 individuals. The measurement model showed a good fit of parameters, with AVE above 0.50 for all components, composite reliability superior to 0.70 for all components as well as an HTMT value inferior to 0.90 present in each component relationship. The six components considered explained 53.3% of the variance in impulse buying tendency. Significant component drivers from strongest to least robust were flow experience, social, hedonic/emotional and performance drivers. Functionality and low perceived risk were not drivers of impulse buying tendency.
Impulse buying tendency is also moderately associated with normal price purchase intention whereas a price increase of 5€/5$ decreases purchase intention significantly.
Keywords: Microtransactions; Mobile Commerce; Mobile Games; Impulse Purchases; Impulse Buying Tendency; Content Drivers; Mobile Commerce.
Resumo
Com a tecnologia móvel a evoluir a um passo cada vez mais acelerado, os consumidores têm agora várias escolhas de entretenimento nos seus dispositivos móveis. Milhares de jogos estão disponíveis para descarregar de forma gratuita em virtualmente qualquer smartphone e com isso, um novo modelo de negócio tem emergido: microtransações.
Caracterizado pelos seus preços baixos, as microtransações têm raramente sido estudadas extensivamente. Com um grande potencial no futuro, este tipo de modelo de negócio está a ultrapassar no presente os modelos tradicionais de comprar-para-jogar.
Ao focar-se em vários tipos de drivers de itens de jogos móveis (Lehdonvirta, 2009) e adaptando pesquisas e modelos anteriores (Wu, Chen & Chiu, 2016; Yoo, 2015), este estudo pretende identificar e criar um modelo com os principais drivers das microtransações que originam compras por impulse em aplicações de jogos móveis e compreender se um aumento de preço leva a uma intenção de compra reduzida.
Uma análise de PLS-SEM foi efetuada numa amostra de 301 indivíduos. O modelo medido demonstrou um bom índice dos seus parâmetros, com um AVE superior a 0.50 para todos os componentes, confiabilidade composta também superior a 0.70 para todos os componentes e um valor de HTMT inferior a 0.90 para cada relação entre os componentes. Os seis componentes originais considerados explicam 53.2% da variância da tendência de compra por impulso. Os drivers de conteúdo significantes do mais forte para o menos forte foram: fluidez de experiência, social, hedónico/emocional e performance. Funcionalidade e baixa perceção de risco não foram drivers de tendência de compra por impulso.
A tendência de compra por impulso também está moderadamente associada a uma intenção de compra com preço normal enquanto que um aumento de preço no valor de 5€/5$ reduz de forma significativa a intenção de compra.
Palavras-chave: Microtransações; Comércio Móvel; Jogos Móveis; Compras por Impulso; Tendência de Compra por Impulso; Drivers de Conteúdo; Comércio Mobile.
Acknowledgments
I would like to thank my parents and brother in the first place, not only for their support since the beginning of this dissertation but also for helping me thrive and aim always higher every step of the way.
A big thanks to Emmi Sveholm for the support and emotional backing whenever I needed it.
I would also like to thank my friends for their encouragement and motivation along this long path.
Last but not least, I express my gratitude to all my teachers at ISCTE – University Institute of Lisbon, for their inspiration and enthusiasm and, obviously, a special thanks to my supervisors prof. Paulo Rita and prof. João Guerreiro for their much-needed orientation, assistance and vision throughout the evolution of this dissertation.
I
I – Table of contents
I – Table of contents ... I II – List of figures ... II III – List of tables ... III
1 – Introduction ... 1
2 – Literature review ... 5
2.1 – E-commerce, game market and mobile market ... 5
2.2 – Microtransactions ... 7
2.2.1 – Microtransactions as a business model ... 9
2.2.2 – Literature gap concerning microtransactions ... 11
2.3 – Impulse purchases ... 19
2.3.1 – Perceived risk in impulse purchases ... 24
3 – Preliminary conceptual model and research hypotheses ... 27
4 – Methodology ... 33
5 – Results ... 39
5.1 – Descriptives and frequencies ... 39
5.2 – Statistical tests and structural model ... 42
6 – Conclusions ... 53
6.1 – Main research contributions ... 53
6.2 – Managerial implications ... 55
6.3 – Limitations of the study ... 55
6.4 – Future research suggestions ... 56
References ... 58
II
II – List of figures
Figure 1 - 2017 global games market forecast adapted from Newzoo's (2017) global games market report.
... 6
Figure 2 - Purchase drivers for virtual items, adapted from Lehdonvirta (2009). ... 14
Figure 3 - Structural model of key drivers of online impulse purchasing. (Wu et al, 2016). ... 20
Figure 4 - Proposed structured model for mobile game-driven microtransaction impulse buying components... 31
Figure 5 - Stacked bar chart for the IBT Likert items. ... 40
Figure 6 - Stacked bar chart for the Likert items of each component/driver. ... 41
Figure 7 - Stacked bar chart: normal vs higher price purchase intention. ... 42
Figure 8 - SmartPLS structural model. ... 48
III
III – List of tables
Table 1 - Business models for e-commerce applications. ... 11
Table 2 - Consumer perceived value model adapted from Sweeney and Soutar (2001). ... 16
Table 3 - Summary of contributions towards microtransactions or related topics. ... 18
Table 4 - The impulse buying tendency (IBT) scale and factor loadings for a single-factor and a two-factor solution adapted from Verplanken and Herabadi (2001). ... 22
Table 5 - Types of perceived risks and their meanings, adapted from Jacoby and Kaplan (1972)... 24
Table 6 - Summary of proposed hypotheses. ... 30
Table 7 - Model concepts with their respective definitions and sources. ... 32
Table 8 - Measurement model metrics for PLS-SEM (SmartPLS 3). ... 34
Table 9 - Structural model metrics for PLS-SEM (SmartPLS 3). ... 35
Table 10 – Cronbach’s alpha reliability analysis of each component. ... 43
Table 11 - Common factor analysis for Likert items. Extraction of 7 factors. ... 45
Table 12 - Spearman's rank correlation coefficient. ... 46
Table 13 - Wilcoxon rank test. ... 50
Table 14 - Wilcoxon significance test. ... 50
Table 15 - Hypotheses summary and respective outcomes. ... 52
Table 16 - Component correlations matrix. ... 73
Table 17 - KMO and Bartlett's test for common factor analysis (Eigenvalue of 1). ... 74
Table 18 - Extracted factors and explained variance of common factor analysis (Eigenvalue of 1). ... 74
Table 19 - Pattern matrix of common factor analysis (Eigenvalue of 1). ... 75
Table 20 - Factor correlation matrix for common factor analysis (Eigenvalue of 1). ... 75
Table 21 - KMO and Bartlett's test for common factor analysis (7 factors extraction). ... 76
Table 22 - Extracted factors and explained variance of common factor analysis (7 factors extracted). ... 76
Table 23 - Factor correlation matrix for common factor analysis (7 factors extracted). ... 77
Table 24 - SmartPLS 3 outer loadings (10 item IBT component). ... 78
Table 25 - Construct reliability and validity (10 item IBT component)... 79
Table 26 - SmartPLS 3 outer loadings (revised model). ... 80
Table 27 - Construct reliability and validity (revised model)... 81
Table 28 - Discriminant validity - Heterotrait-Monotrait Ratio (HTMT) (revised model). ... 81
Table 29 - Effect size (f2) (revised model). ... 81
Table 30 - Outer variance inflation factor (VIF) (revised model). ... 82
1
1 – Introduction
Our society is living in an age that heavily relies upon electronic devices. It is safe to say consumers have entered a digital age where information sharing and transactions are performed online to a large extent. Consumers are now even offered the option to buy digital products or upgrade digital services just like they can with physical goods or club memberships.
The world of virtual commerce is commonly named e-commerce or online commerce and it is largely widespread at this point in time, being present in nearly every market segment. E-commerce is comprised of all online interactions and connections based on computer services with the goal of trading products, services and information (Buettner, 2017).
E-commerce has many advantages to consumers and businesses – it grants easier and faster access to information, more transparency in product comparisons, a wide array of data available and quicker communications, faster and more fluid transactions, among other benefits (Niranjanamurthy et al, 2013) – and although it represented only 7.4% of total retail sales worldwide in 2015 with a value of 1.548 trillion dollars, it is expected to grow tremendously by 2020 (eMarketer, 2016), with e-commerce representing nearly 15% of total retail sales with a value of 4.058 trillion dollars.
Among the possible types of transactions in e-commerce, microtransactions have been growing considerably in recent years (Business Insider, 2017). A microtransaction can be defined as a payment of a very small amount of money – a micropayment – that is performed online (Cambridge Dictionary, 2016), usually within a game-like environment. Microtransactions go hand in hand with the concept of micropayments. Microtransactions are just a common term employed mostly in game-driven applications, associated with a business model of revenue based on micropayments.
What this means is that microtransactions, and therefore micropayments, are all included in the electronic commerce (e-commerce) universe. One of the most common applications of microtransactions are mobile games, specifically free-to-play games.
According to Valadares (2011a), free-to-play based games were already outpacing premium based games in terms of total revenue in June of 2011. What this means is that more money was being spent on free game-driven applications than non-free game-driven applications. In the latter,
2 it is required to pay beforehand in order to play the game. The same research by Valadares (2011a) showed that 65% of game revenues in the entire Apple iOS app store were originated from free-to-play games. This means consumers had to be engaged with microtransactions inside those games as they are probably the only transaction method available in them.
This can represent a considerable shift in the digital marketing approach to consumers and how they handle their expenditures. If microtransactions are indeed becoming a successful revenue model for game-driven applications it becomes important for marketers and managers to understand why and how that happens.
Mobile games also have a different nature than console or personal computer games. Users can bring them along, they boot up quickly and are played in shorter session times and spontaneously throughout the day (PwC, 2012). Frequently, most mobile games have a sort of real-time online integration with other users or with game servers in order to create a richer experience. Users spend less time and do not plan how or when they will play their mobile games (PwC, 2012). These factors can potentially predispose mobile game-driven applications to impulse purchases and this is a matter that can be studied further. At the time of this study, there is a very limited number of articles that focus on microtransactions or the link between them and impulse buying. The main drivers of mobile-game microtransactions that can lead to impulse buying have not been analyzed to this date and it is this important identified gap that will be addressed.
Do consumers purchase mobile game content quickly and out of impulse or is it a more rational purchase? What are the main drivers of microtransactions that result in higher impulse purchases regarding mobile games? Is the perceived risk of microtransactions low and does it influence impulse buying tendency? Do the low microtransaction prices influence purchase intention? Or maybe even a combination of multiple factors?
All of these questions can be crucial for businesses who rely heavily on microtransactions as their main source of revenue in mobile games.
As such, focusing specifically on microtransactions and game-driven applications, the main objectives of this study are to explore the main motivations and factors that influence users towards these transactions in a manner linked with impulse buying. There have been studies conducted on online impulse buying (Chan, Cheung & Lee, 2017; Wu, Chen & Chiu, 2016; Ozen & Engizek,
3 2013; Park et al, 2012) but none of them address online impulse buying in microtransaction mobile games or their driving factors. A few microtransaction specific studies have been performed (Guo & Barnes, 2007; Yoo, 2015) and also on virtual game items (Lehdonvirta, 2009) but not on the link that exists between microtransaction characteristics and which ones are more responsible towards generating impulsive behavior. Lehdonvirta (2009) identified drivers for virtual items in game worlds, but not which ones are more prone to impulse buying while Yoo (2015) studied which of those factors were considered more valuable to consumers. Nonetheless, neither of them make specific reference to impulsive buying. Certain items might be considered valuable but not lead to impulse buying. This gap in literature is the main study area of this dissertation: what factors leads to impulse buying – and consequently microtransaction purchases – in mobile games.
A study of this sort will enable a clearer understanding of a microtransaction buying process and what are the most important key factors leading up to impulse buying within this universe. Specifically, the practical highlights that stem from this work are knowing which types of microtransactions are more associated with an impulse buying tendency and to understand if impulse buying tendency leads to purchase intention and, at the same time, comprehend if a price increase will influence purchase intention significantly or not. It was found that 4 components in specific (performance, hedonic/emotional, social, flow experience) are correlated with impulse buying tendency and impulse buying tendency itself is also associated with purchase intention. A price increase also seems to significantly reduce the intention to purchase.
In a managerial point of view, this will allow businesses to adapt their microtransaction content to more adequately lead to impulse buying behaviors and thus create a higher profit level. This will also enable the creation of a work base in a field where there is not yet much information available, which can then be expanded and further studied in the future based on these findings.
The following work will be divided in several sections. Initially, a literature review will be conducted where vital topics such as microtransactions, mobile games and impulse buying will be examined. From this, the formulation of hypotheses and a structural model will be devised, taking into consideration the literature gap identified. Subsequently, a methodology will be presented that will enable the answer and a positive or negative validation of the presented hypotheses and model. Afterwards, the results will be examined and then followed by a discussion of the contributions and implications that have originated from this work.
5
2 – Literature review
2.1 – E-commerce, game market and mobile market
With consumers having an increased level of action regarding online shopping and activities (Cho, 2003), businesses have resorted to using several types of mechanisms to encourage online shopping, drive sales and intensify interaction and communication with the market. These include data mining tools (R, RapidMiner), customer relationship management (CRM) systems (salesforce, SAP AG) and consumer behavior analysis programs (Google Analytics, SDL) (Buettner, 2017).
This is greatly reflected in market values. Regarding e-commerce, in 2000, a mere 27.62 billion dollars in sales were generated in the United States alone. Fourteen years later in 2014, this same value stands at 298.6 billion, an increase of more than a decuple (Statista, 2016a). Comparing with total retail sales in the US, they stand at 4.636.35 billion in 2014, meaning the e-commerce sales for that same year accounted for nearly 6.5% of the sales. Data by the U.S. Census Bureau News – U.S. Department of Commerce (2016) also states that during the first quarter of 2016, e-commerce sales represented 7.9% of total retail sales in the US. Focusing on mobile e-e-commerce spending only, a similar pattern can be seen. Statista (2016b) data shows a spending of 13.4 billion dollars in the US in 2011. In 2015, also in the US, mobile e-commerce spending totaled 49.2 billion dollars, an increase of over three times as much.
The basic conclusion observed is that there is both an increase in retail sales, e-commerce sales and mobile e-commerce sales. However, e-commerce sales have been increasing their share inside retail sales, and the same happens for mobile e-commerce in regard to total e-commerce sales.
Narrowing down even more the mobile spending by focusing solely on game-driven application revenues, a report by Newzoo (2016a) described that worldwide, in 2015, mobile game-driven applications (in smartphones and tablets) accounted for 33% of all gaming revenue worldwide, with a value of 30.4 billion US dollars. Additionally, supplementary information by Newzoo (2016b) predicted that mobile games will be responsible for generating 37% of the global games market value in 2016 – which will stand at 99.6 billion US dollars – meaning it generates 36.9 billion US dollars. This forecast was correct (mobile games accounted for 38% of the global games market in 2016) and the prediction for the year 2017 states that mobile games will account
6 for 42% of the global games market (Newzoo, 2017). This represents an outstanding growth in the mobile games market, with a volume increase in 2016 of 21.3% over the year of 2015. This is visible in figure 1 below where it shows the forecast for the games market volume and share per segment.
Figure 1 - 2017 global games market forecast adapted from Newzoo's (2017) global games market report.
Moreover, by 2020, the mobile game market will soar and achieve a total revenue worth of 64.25 billion US dollars, representing 50% of the global videogame market (Newzoo, 2017.). A big part of this revenue is created in the Chinese market – 10 billion US dollars in 2016 and an estimate of 13.9 billion US dollars in 2020. The Chinese market is a good benchmark for the video game business model of microtransactions due to much of their revenues originating from mobile platforms – 41% in 2016 and an estimated 48% in 2019 (Newzoo, 2016b). Furthermore, extra information by Newzoo (2016c) indicates that mobile gaming will be responsible for 40% of the total revenues made by the top 10 video game companies, which include Google, Apple, Microsoft, Sony, Activision Blizzard and Tencent, the latter being the number one game company worldwide with a revenue of 5.3 billion US dollars in the first half of 2016.
On top of all this, the video game industry has gradually gained momentum in the current decade and has now managed to rival and even surpass in some respects the film industry. Data and forecasts by Statista (2016f) show a value of the global games market of 71.27 billion in 2015 and predicts a value of 90.07 billion US dollars in 2020 while the global movie industry stands at
7 38.3 billion US dollars in 2015 concerning box office revenue (Statista, 2016g) and is forecasted at 49.3 billion US dollars in 2020 (Statista, 2016h). It should be noted nonetheless that box office revenues do not include DVD or Blu-ray sales. All this signals that the video game industry is growing immensely but, more importantly, that mobile game-driven applications are one of the major forces contributing to this growth.
By focusing solely on game spending, mobile game-driven applications have a very promising future and are expected to be the top performer in terms of revenue values, outperforming even console and personal computer revenues. Since most of these mobile game revenues come in the form of microtransaction models, they are a valuable component to understand and to study. It is the fastest growing segment in the gaming industry, with the largest number of users – 1.9 billion – and possibly the highest revenue presently or in the very near future (Newzoo, 2016d).
Now that a general overview has been established regarding e-commerce, game and mobile markets, it becomes important to focus on key aspects concerning the topic at hand, namely microtransactions and impulse purchases.
2.2 – Microtransactions
There are several methods or business models to create revenue on apps, games and programs. The most common are try-and-buy downloadables, sponsored advertising, subscriptions and more recently, microtransactions (Kapralos, Katchabaw & Rajnovich, 2007: 108).
According to Hauser, Steiner and Waidner (1996: 1), “micro-payments have a broad application area in the marketing of information distributed in an electronic form”. This type of revenue model struggled initially to succeed (Mills, 2016). Recently however, it has developed and expanded not just from information distribution but to actual purchases of goods and services, whether they are real or virtual (Wauters, 2007).
Micro-payments are characterized by low monetary values and have been implemented to enable products or services to be purchased with real currency (Newman et al, 2016) or through virtual currency bought beforehand (Pou et al, 2007). Microtransactions is the term commonly employed to identify a revenue model of a game based on micro-payments. This has become a constant form of revenue in most free-to-play or free-to-download game-driven applications.
8 Commonly, with a typical microtransaction-based monetization model, consumers can use an application free of charge but then have to pay for incremental in-app content by using the application's branded points or virtual currency (Redman, 2016). It allows consumers to access the free basic content, maintaining high visitor traffic, while generating revenue from the interested users towards their preferred content (Waltner, 1996).
On top of that, consumers are becoming less resistant to paying for online content due to small charges made by companies such as Apple and Skype, who charge for music and calls respectively on their online websites or stores (Gelles, 2009). Moreover, recent technology has allowed payment systems to become swift and strong enough to handle multiple requests (Hauser et al 1996; Gelles, 2006; Pou et al, 2007; Huang et al, 2016). A good microtransaction platform is one that supports a high-volume of operations comprised of generally low-cost per-item transactions. There has been an increasing number of electronic micro-payment protocols proposed recently suited for exactly this type of operations (Huang et al, 2016). All of this signals a paradigm shift in the e-commerce and mobile world with the entrance of microtransactions to the gist of possible revenue models and transactions with consumers, especially in the gaming environment.
There is evidence that supports this. Valadares (2011a) shows a study demonstrating that free-to-play games with microtransactions in the iOS app store started earning more revenue than their pay-to-play counterparts in mid-2011. Furthermore, more in-depth analysis by Valadares (2011b) revealed that users were spending an average of 14 US dollars per transactions on iOS and Android free-to-play games. This is a significantly higher amount then the usual price points of most pay-to-play mobile games and apps (in June 2016), which are in the range of 0.55$ and 1.13$ respectively (Statista, 2016c). Microtransaction revenues in the UK regarding game applications only have also increased vastly from 384.3 million £ in 2010 to 908.7 million £ in 2014 (Statista. 2016d). League of Legends, one of the most popular free-to-play PC games with embedded microtransactions, reported a revenue of 1.6 billion dollars in 2014 (Colagrossi, 2016). Other games with microtransaction models, such as CrossFire and Hearthstone among many others, are also making millions of dollars in revenues (PC Gamer, 2014). All this is also a sign that microtransactions are starting to be widely accepted and used in the video-game universe.
According to Freese (2012) and Moran (2013), microtransactions have several advantages both to users and producers. To producers, it grants them two major advantages. Firstly, it allows
9 them to fight piracy with a higher efficiency level. A microtransaction embedded software requires an online connection which in turns allows producers to verify the quality of the software installed and have a more assertive control regarding illegal actions performed. Secondly, it facilitates updates to the software. Developers can expand their software with new content and attributes, make changes to mechanics and offer content that users might be looking for, helping to create an experience that meets the user’s expectations. New paid content can be added regularly, creating an ecosystem for users where they will be logging in frequently to see what new changes have taken place, give feedback about it and purchase it (or not). Developers can then analyze performance and make new changes, starting the cycle again.
2.2.1 – Microtransactions as a business model
Companies need to have a business model in place if they want to create revenue. Regarding mobile applications, the same premise stands. With the exception of very specific utility applications available (such as calendar, compass or time zone applications), all applications have a form of generating revenue and it is important to understand what forms of business models there are in order to perceive how and why the microtransaction business model is successful in the mobile market of applications, specifically game-driven applications. Special attention must be given to the types of microtransactions available, especially in game-driven apps. A certain balance must be achieved between the content available and the game itself (Tassi, 2013). Paid content should not deter from the game experience, more so if the game is playable in a multiplayer format. Each form of business model, however, does not exclude the use of other business models at the same time, meaning applications might have more than one business model in place and operating at the same time.
One of the simplest and oldest forms of business model that exists is the pay-to-play model (Newlands, 2015; Munir, 2014). It is a very straightforward method and it simply means that the user must pay prior to using the application. Users can buy the content on retail stores or game shops and more recently also online through digital distribution platforms (Osathanunkul, 2015).
Another business model that has endured for a long time has been the in-app advertising model (Rhodes, 2015; Newlands, 2015; Osathanunkul, 2015; Munir, 2014). With this model, advertisement adds can be inserted in the applications and displayed to users. It is a popular widespread strategy according to data from Developer Economics (2016).
10 A different model which has proven successful is the subscription based model (Osathanunkul, 2015; Munir, 2014). This revenue model is capable of generating a good profit value while at the same time enabling an easier prediction of future revenues according to Serafimov (2015). This happens because subscription based models work on the basis that users will pay on a regular schedule for content (a good successful example can be Netflix). This can happen weekly, monthly and even annually and it allows a prediction of revenues with a good level of accuracy. Most of the times, the user is allowed access to some content for a limited time before deciding to subscribe. When a user subscribes to a service, he has access to all the content available for the duration of the subscription and in some cases, when the subscription is close to terminating, it is renewed automatically.
Finally, there is the microtransaction business model (Rhodes, 2015; Serafimov, 2015; Osathanunkul, 2015), which encompasses a variety of sub-models, some of them more prone to be used in game-driven applications. Among some of the microtransaction business models used in games, the most significant can be highlighted:
- Gated content: the user has access to the game for free up until a certain point, where the user will then need to pay to unlock more gameplay content. Usually all features remain the same and the user can still access all previous content, he merely pays for more story progression or extra levels (Newlands, 2015; Munir, 2014);
- In-game purchases: users can buy virtual goods within the game. They can range from visual or cosmetic accessories that allow for character or game customization to extra abilities or boosters that enhance gameplay and give actual advantages inside the application to the user (Newlands, 2015; Scholz, 2015a; Munir, 2014);
- Episodic games: the game is split into several different episodes or chapters which users must buy in order to complete the story. Usually the game is not completed upon the first chapter release but is rather worked on by developers using user feedback and experience gathered during previous development stages (Scholz, 2015b).
Focusing more on mobile games, gated content and in-game purchases are the most popular models employed (Newlands, 2015). They easily adapt to the quick and casual style of play of most mobile games – the average play time in mobile game-driven applications is nearly 8 minutes
11 (Statista, 2015e). In fact, the success of these types of microtransaction models is so evident that even other big successful game companies are considering implementing them on a daily basis in platforms other than mobile (Karmali, 2013; Ho, 2013). A summary of the business models is viewable below in table 1.
Table 1 - Business models for e-commerce applications.
2.2.2 – Literature gap concerning microtransactions
There are several different articles published regarding microtransactions. The social effects of microtransactions in video games have been studied already. It appears that users tend to dislike players in the same game who use microtransactions (Evers, Van de Ven & Weeda, 2015). This disapproving force is especially high when it comes to microtransactions that grant in-game advantages but it is not so strong concerning cosmetic or visual benefits in the game. These findings remark to the planning and thoughtfulness that must be given regarding the various types of benefits that microtransactions offer in order to create a balanced and enjoyable experience for everyone throughout the lifespan of games.
Factors that influence purchase behavior in virtual game worlds are also important. The purchase behavior of virtual items has a wide range of variability and involves a range of factors
12 at different stages. Some of the identified factors are performance expectancy, effort expectancy, social influence and the quality of the virtual world system (Guo & Barnes, 2009). “Trust was not perceived as an important factor influencing personal purchase decisions” (Guo & Barnes, 2009: 91). Seemingly, trust still matters but not as much as expected, with some reasons being that virtual items are always reliable and function as expected. This study was focused on game virtual worlds such as World of Warcraft and Second Life and did not have mobile microtransactions as a direct emphasis, however some elements are shared between the two – in both games, users must access in-game shops and use a microtransaction system to purchase the virtual items or goods being studied.
Trust was also investigated further in commercial transactions, from which microtransactions are a part of. To be highlighted here is the importance of recurring transactions which establish trust between both parties – the more transactions performed between the parties involved, the higher the level of trust will be (Orzil & Andalécio, 2013). On the other hand, a sense of opportunism in a transaction can negatively impact trust.
The types of consumers who make microtransactions and their motivations have also been assessed. These can give potential insights and indications regarding microtransaction motivations by players. Conclusions drawn showed that the players who were involved in microtransactions had reported higher levels of impulsivity, reward sensitivity and problems with gambling severity. Their motivations for performing the transactions were mainly linked with a desire to extend the play time and access additional features as well as chasing previously lost credits and also to speed up play (Kim, Hollingshead & Wohl, 2017). Although the research study was fixated on microtransactions in social casino games, some key elements are also common in mobile games and, due to that, valuable information can be extracted to help guide and formulate possible research questions. Some of the findings also seem to correlate microtransactions in social casino games with acts of impulse buying, a significant point in this research.
Several other subjects regarding microtransactions have been studied. Focusing more specifically in the architecture systems of microtransactions and how they can be made more efficient, the first point of difference is that microtransactions are different when it comes to the processing of electronic payments, primarily due to their peculiar low monetary values. Essentially, processing a microtransaction is not as efficient as processing a regular payment due to the
13 transaction handling costs being very high in proportion with the microtransaction value (Huang et al, 2016; Chiejina, 2013; Hauser et al, 1996). New technologies and systems have found ways to minimize these costs (Paypal, 2017) and a good solution for this is to pool together several microtransaction payments and only process them after they reach a certain value (Newman et al, 2016). This has allowed a higher safety and efficiency in the transactions which can potentially create less concerns on the consumer side.
The likelihood to abort online shopping transactions by measuring influences of cognitive evaluations, attitudes and behaviors is also important. Factors such as better product and value offering, control in information search and effort saving lead to a better attitude towards e-shopping and consequently less chance to abort an online transaction (Cho, 2004). These factors were assessed through e-shopping in general and do not specifically focus on microtransactions, which differ in some aspects when compared to traditional e-commerce. Still concerning online shopping, the biggest barriers are the lack of direct contact between the customer and enterprise and the inability of seeing, touching or testing/trying a product (Kułyk & Michałowska, 2016). Regarding microtransactions however, these do not seem to apply in its full extent.
Consumers engaging in a microtransaction do so because they are users of an application or game belonging to a certain company. They are using their products and have contact with it. Although they are not dealing with enterprises directly, they do so indirectly through their products and will probably have conceived a mental image about the company, such as its quality and positioning. If costumers are satisfied with the product and its perceived quality, they will develop higher loyalty towards the brand and consequently a positive brand image (Halim et al, 2014). This makes the first barrier ineffective to a large extend. Additionally, when consumers are purchasing virtual goods or services – a common microtransaction purpose in game-driven applications – they likely know exactly what they will purchase with the transaction and thus are well informed. On top of that, microtransactions tend to happen mostly inside applications or software, meaning consumers are already familiarized with the product and need to have used it before already. As such, the second barrier does not necessarily apply, more so because the goods are not physical and cannot be touched and every user can easily see what they look like and what they will offer or grant before buying. Because microtransactions are peculiar and not similar to a traditional online
14 purchase, these barriers might not apply correctly to them and only through a microtransaction specific study can new barriers or drivers be investigated.
Another crucial component are the purchase drivers for microtransaction game content. Purchase drivers for virtual items have been studied already and they correlate highly with microtransactions. Lehdonvirta (2009) conducted a study about virtual item sales as a revenue model, which directly correlates with microtransactions. In the article, a list of virtual item attributes is presented which act as purchase drivers.
Figure 2 - Purchase drivers for virtual items, adapted from Lehdonvirta (2009).
The list divides attributes in two categories, as seen above in figure 2, which are functional attributes and decorative attributes. These two attribute categories can then be split further, with decorative attributes having two opposite sides – hedonic and social attributes. They cannot be spliced entirely and must share some common ground due to some of their traits being blurred and subjective according to personal preference – some decorative items can have a more social or hedonic attribute than others according to the user and/or the situation. This attribute division can be useful further ahead in this study due to the fact that some attributes might predispose users to buy more out of impulse than others, a situation that is worth investigating further.
Another important concept that can be applied to microtransactions is the Technology Acceptance Model (TAM). Davis (1989) states that perceived usefulness (PU) and perceived ease of use (PEU) are the main factors contributing for an individual’s behavior intentions to embrace new technologies. Perceived usefulness refers to “the extent to which a person believes that using
15 the system will enhance his or her job performance” while the perceived ease of use refers to “the extent to which a person believes that using the system will be free of effort” (Davis, 1989: 320). The results indicated that perceived usefulness as well as perceived ease of use were significantly correlated with the use of systems. Out of the two factors, perceived usefulness had a better correlation strength with system usage than perceived ease of use. The same source states this makes sense seeing as that even though a difficult to use service can discourage adoption of a useful system, a super easy to use system will not be used at all if it does not provide a useful function. While the TAM model is applied generally to new systems such as computer software and programs, it can also be used in the scope of microtransactions in the sense that people will make use of them if they prove to be easy to use or provide a useful benefit.
One of very few articles directly regarding microtransactions and its perceived value of items was performed by Yoo (2015). In it, the Consumer Perceived Value model is used to establish which dimensions play a bigger role in the purchase intentions of free-to-play game items and if those purchased items increase the intention of playing games. The results garnered that the higher the perceived value of items by gamers, the higher the probability of them purchasing items. Emotional, social and functional monetary values were found to correlate positively with purchase intentions of items. Functional value of performance, on the other hand, did not and it even had the opposite effect of detracting from purchasing intention. Functional performance value should have a positive effect on people who have not yet purchased a microtransaction item (Artz & Kitcheos, 2016) and the author concluded that due to the broad concept of functional value, questions about perceived value must be modified specifically to adjust to a game context. However, there could be other reasons for this result, specifically two reasons:
- The questioned users were mostly playing games that had no microtransactions that granted functional benefits in-game and as such they could not be influencing their purchase intention, or;
- Individuals who were surveyed believe that the functional benefits granted by the microtransactions gave an unfair advantage to players or made the game less enjoyable. This goes in line with previous findings by Evers et al (2015) that state microtransactions should be fair for everyone, carefully balanced or used more towards cosmetic items. A gamer might find an item to
16 be beneficial before purchasing but consider it to be unfair to others after purchasing, resulting in a lower purchase intention in the future.
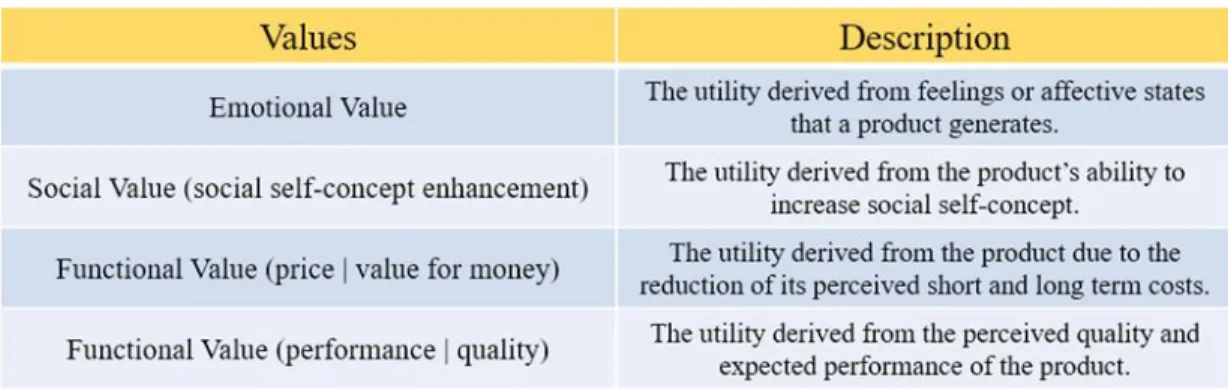
As stated before, this study by Yoo (2015) used as a base the Consumer Perceived Value Model (PERVAL). This model was created by Sweeney and Soutar (2001) based on the popular Theory of Consumption Values model of Shet, Newman and Gross (1991). The PERVAL model has four dimensions: emotional value; social value; functional value (price/value for money); and functional value (performance/quality). In table 2, a synthesis of the PERVAL model can be seen along with a description. According to Sweeney and Soutar (2001), some values are more relevant than others depending on the situation. For example, the emotional value dimension was more significant when predicting willingness to buy an item while the functional value of quality dimension was more relevant in user’s expectations of problems, or lack thereof.
This model can prove useful for creating a potential microtransaction model in this study. It has several values that can be applied to microtransaction content offered on games and additionally it is in line with Lehdonvirta’s (2009) purchase drivers for virtual items, which also include functional and cosmetic values.
Generally speaking, mobile microtransactions do not usually have high price points (Onebip, 2014; Swrve, 2015) and that can be a positive influence on consumers. When it comes to price, there is still no literature available to this day regarding price influences on mobile microtransactions. Despite this fact, there is other literature available that can give cues to the effects of the price points used in microtransactions.
17 For once, microtransactions are always price transparent. In traditional online shopping, there might be hidden fees such as minimum shopping price values or shipping fees. These hidden costs and fees are perceived as negative and can reduce the trust of the consumer (Nguyen & Klaus, 2013). But these types of charges can never take place in microtransactions – there are no actual physical goods involved, everything takes place online and the user has access to the virtual goods or extra content after purchasing them in a manner of seconds.
Price also seems to have an impact on consumers’ online purchase intentions, at least as a moderator. According to Ekpe, Adubasim and Adim (2016), reduced prices positively influenced online purchase intentions. Guo (2011) also supports this, stating that competitive prices online are one of the primary factors influencing consumers’ purchase decisions and that by making their prices more competitive, online retailers can make their advantages more prominent and increase the number of consumers. Furthermore, the influencing factor of product price on the customer motivation to scrutinize more closely the content of trust-assuring arguments has also been investigated and it was concluded that customers are more influenced by the content of trust-assuring arguments when the price of a product is relatively high than when it is relatively low (Kim & Benbasat, 2009), meaning they care less about actual facts when prices are lower and do less research before buying. Price discounts also seem to result in a better impulse buying intention when the considered products are hedonic-based (Xu & Huang, 2014). Additionally, price discounts also cause a higher impulse buying intention when the products are inexpensive.
With all this information considered regarding price, it becomes an interesting component to measure regarding potential microtransaction impulse buying intention since microtransactions are notoriously low value transactions and possibly have an inherently lower risk for the consumer. Hansen (2005) identifies four main reasons for the emerging popularity of online shopping: convenience; more choice; lower prices; and ability to compare prices/products. These four advantages might possibly occur generally in microtransaction game menus but they are still not focused directly on a microtransaction driven environment, making a microtransaction focused study more relevant and meaningful.
All of these articles and studies cover a good ground for user buying motivations, intentions and perceived value, although most of them do not deal with microtransactions directly. There are indicators of the main motives for buying, but not those that create higher impulse buying
18 tendencies. This means there is no indicator of whether a microtransaction purchase is made on-the-fly out of an impulse or urge or if it is a thought-out process that involves a more planned and rational approach. Moreover, there is no information about the time users take to purchase microtransaction content.
Basically, there are no studies referring to the impulsiveness of microtransactions, specifically in mobile games, and the main drivers that result in impulse buying for microtransactions. Below, in table 3, a summary of the contributions towards mobile microtransactions or other related topics can be seen.
Table 3 - Summary of contributions towards microtransactions or related topics.
It is easily visible that no work exists to study the link between mobile microtransactions and the realm of impulse purchases, hence the choice of the present study is more clearly justified and rational to perform since it will address this specific gap.
19
2.3 – Impulse purchases
Switching attention now to impulse purchases, these can be defined as purchases performed suddenly, being hedonically complex and without a strong factor of consideration, thoughtfulness and planning (Sharma et al, 2010). Floh and Madlberger (2013) also assert that impulse purchases are unplanned and abrupt, accompanied by strong sensations of pleasure and exhilaration but that they are also driven by environmental stimuli and cues during the shopping period. Additionally, impulse purchases can also be influenced by other elements such as social visibility, cultural factors and personality (Yu & Bastin, 2010). There is a high degree of shoppers, around 40% according to Verhagen and van Doulen (2011) and Liu, Li and Hu (2013), that can be rated as impulse buyers. It does not necessarily imply that all those 40% of shoppers only buy out of impulse but instead that they have, at one point in time, partaken in a purchase that could be graded as an impulse purchase.
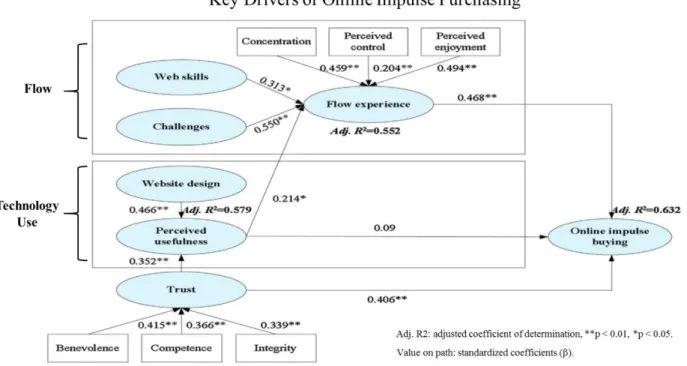
These types of purchases stem from high hedonic urges to achieve satisfaction, well-being and a positive disposition (Taute & McQuitty, 2004; Punj, 2011). Additionally, impulse purchases are seen in the eyes of buyers as purchases which are very hard to resist acquiring, preceded by high urges and needs. Buyers feel powerless to struggle with those urges and find a lack of arguments and behaviors to not purchase in the moment (Park et al, 2011; Roberts & Manolis, 2012). Wu et al (2016) devised a research model conveyed from other previous research and investigation that attempts to identify the main factors contributing to an online impulse purchase.
20
Figure 3 - Structural model of key drivers of online impulse purchasing. (Wu et al, 2016).
In the model shown in figure 3, trust and flow experience directly contribute to online impulse purchasing. Trust refers to the e-vendor’s ability to be reliable. The more consumers trust and believe in a vendor, the more they are willing to purchase from them. As such, they will only share private and sensitive information when they trust the company and consequently that their online systems are safe (Palvia, 2009).
Regarding flow experience, it can be characterized by the state of immersion of a user within an activity. The more they are immersed, focused and enjoying what they do, the higher the flow experience. It can be an important metric of online consumer experience and according to Chang and Wang (2008), flow experience leads to a higher attitude towards use and a stronger behavioral intention to act, especially in entertainment-oriented software – where most of microtransactions take place. Some elements that comprise the core of flow experience are: feeling in control, focusing attention on the activity, feeling curiosity, and being intrinsically interested in the activity (Webster & Trevino, 1995). Although perceived usefulness – a component present in the Technology Acceptance Model (TAM) – did not directly lead to online impulse buying, it did have an effect on the flow experience (Wu et al, 2016).
21 The study by Wu et al (2016) was applied on a traditional online shopping setting. As such, some of its components might not correlate with microtransactions. For example, while this study implies that trust plays a good role on online impulse buying, Guo and Barnes (2009) found this might not apply in virtual world purchases. Still, some elements can prove useful for future studying, such as flow experience, which is likely represented in games by their overall quality, gameplay and entertainment level – the higher these elements, the higher the flow experience and the possibility of users purchasing extra content for the games, thus using microtransactions in mobile games. Su et al (2016) also studied the effects of flow experience on player loyalty in mobile game applications and results showed that the more players enjoy and concentrate on playing a game, the more loyal they might become to that game, demonstrating again that flow experience is an important component in games.
Verplanken and Herabadi (2001) devised a scale with the purpose of measuring an individual’s Impulse Buying Tendency (IBT). This scale is composed of 20 items, with 10 of them having a cognitive facet (lack of planning, a tendency not to deliberate or think) and the other 10 an affective aspect (feelings of pleasure, urge to buy and difficulty to control impulses). This scale was reportedly efficient in measuring impulse buying tendency: after the items were subjected to a principal component analysis and using a two-factor solution with an Oblimin rotation, the cognitive factor accounted for 29.24% of variance and the affective factor for 20.94%. As such, this scale has the potential to be used when testing impulse purchases in the medium of microtransactions, adapting beforehand the language and context of the scale. Thus, by identifying certain factors or values surrounding microtransactions, these can then be used to try to explain how they influence or affect a person’s impulse buying tendency, using the IBT scale as the basis for impulse buying.
22
Table 4 - The impulse buying tendency (IBT) scale and factor loadings for a single-factor and a two-factor solution adapted from Verplanken and Herabadi (2001).
The IBT scale has since been studied deeper and applied in other article studies. For example, Dincer (2010) studied the IBT cognitive and affective factors regarding impulse buying behavior against people who considered themselves impulse buyers and those who did not. Results showed that impulse buying is purely affective. This same IBT scale was also used as a basis for impulse buying behavior when studying the effects of price discounts and promotions on consumer’s impulse buying levels (Xu & Huang, 2014). Additionally, Arnold and Reynolds (2003) investigated hedonic shopping motivations, although focused on a retail environment. They classified shoppers based on their hedonic motivations (adventure shopping, gratification shopping, role shopping, value shopping, social shopping and idea shopping) and identified five groups of shoppers: minimalists; gatherers; providers; enthusiasts; and traditionalists.
23 Another study was conducted to determine whether hedonic motivations of Turkish consumers would have an impact on their impulse buying tendencies (IBT) (Ozen & Engizek, 2013). However, only items of the IBT scale regarding the affective facet were used on the research, as it was claimed that impulse purchases are mainly hedonic and emotional despite a higher or lower cognitive value of individuals. Their findings stated that adventure shopping, value shopping and relaxation shopping are correlated with a higher IBT while social shopping and idea shopping are not. A similar research was performed but with an emphasis on online shopping and what factors would lead to research intention and purchase intention (To, Liao & Lin, 2007). The study was based on not just hedonic factors alone but also utilitarian factors. The conclusion was that utilitarian factors are an important determinant of consumer intention to search and to purchase. Hedonic factors also have a direct impact on intention to search but only an indirect impact on intention to purchase.
Finally, another important aspect regarding impulse purchases is the self-regulatory resources (Muraven et al, 1998). These non-physical, invisible resources available in a person’s mind allows them to struggle and repel actions that are deemed negative or considered erroneous (Baumeister & Vohs, 2004). However, after resisting and countering those foul or negative actions, the individual will have less and less of the self-regulatory resources. The less resources available, the more inclined the person is to conduct personal urges or give in to other sorts of temptations, such as impulse purchases.
A study by Vohs and Faber (2007) on this matter showed that individuals with supposedly lower or depleted self-regulatory resources “felt stronger urges to buy, were willing to spend more and actually did spend more money in unanticipated buying situations”. This can also be an important aspect to consider since mobile and tablet devices have a higher usage rate at the end of the day according to data retrieved by Chaffey (2016). This can potentially be the time when most people have lower self-regulatory resources available due to the daily stress of work and other activities and thus are more inclined to buy out of impulse. It then becomes interesting to inquire microtransaction purchasers when is their preferred time of day to purchase game content and see if a pattern can be detected. If purchases are mostly done at the end of a work day, for example, a self-regulatory resource study might be interesting to formulate in the future due to the fact they might play a role in impulse purchasing in mobile games.
24
2.3.1 – Perceived risk in impulse purchases
When a user is purchasing a certain product or service, there is an associated risk with that act in the sense that any action of a consumer will produce consequences that will be viewed with some degree of uncertainty (Bauer, 1960). Additionally, perceived risk can vary by product category or class (Jacoby & Kaplan, 1972; Dowling & Stealin, 1994; Ueltschy, Krampf & Yannopoulos, 2004) and by a person’s ability to absorb a monetary loss (Dowling & Staelin, 1994). There are several types of perceived risk as stated by Jacoby and Kaplan (1972): financial risk; performance risk; physical risk; psychological risk; social risk; and an overall perceived risk of all factors combined. Financial risk is concerned with the loss of money in the case of a bad product choice. Performance risk regards the loss incurred when the product does not perform as expected. Physical and psychological risk regard the safety/health of the individual and their self-disappointment, respectively, in the case of a poor product choice.
Table 5 - Types of perceived risks and their meanings, adapted from Jacoby and Kaplan (1972).
On a cross-national study performed using the aforementioned perceived risk factors towards online purchasing, it was found that financial risk and performance risk were the more pronounced risk factors across all types of different products (clothing, computers, airline tickets) (Ueltschy et al, 2004). However, Jacoby and Kaplan’s (1972) study saw that the cheaper the product, the lower the perceived financial risk. This makes logic from a commonsense point of view: the cheaper something is, the less someone worries about the money lost on the purchase if it ends up being a bad product. It can be interesting to investigate if the same applies to microtransactions and if a low perceived risk overall leads to higher purchases by impulse.
25 Further studies have been developed regarding perceived risk, namely in the e-commerce universe. Glover and Benbasat (2010) have studied and developed a model of perceived risk of e-commerce transactions and state that e-e-commerce risk is an aggregate factor comprised of three dimensions: risk of information misuse (personal and financial information revealed in the transaction), risk of functionality inefficiency (difficulties of finding, ordering, receiving, returning and maintaining the products purchased), and risk of failure to gain product benefit (the purchased goods will not meet expectations or will not arrive at all). Suki and Suki (2007: 88) also assessed that the consumers perceived risk associated with online shopping has a critical effect on their decision making.
Focusing specifically on the perceived risk of impulse buying, there have been contradictory results on the few studies performed. Chen and Zhang (2015) have studied the influential factors for online impulse buying in the Chinese population, in which they included perceived risk as a factor. Results have showed that perceived risk was not an influential factor in online impulse buying. On the other hand, Lee and Yi (2008) analyzed specifically the effects of shopping emotions and perceived risk on impulse buying. One of their main conclusions was that perceived risk was indeed negatively associated with impulse buying behavior but no link was established between perceived risk and impulse buying intention. They argue that when perceived risk is high, consumers become more risk averse. Therefore, users with high perceived risk would show risk aversion and display a lesser impulse buying level while users with a low perceived risk show increased impulse buying behavior.
Perceived risk within the realm of mobile payments has also been studied by Yang, Liu, Li and Yu (2015). Again, perceived financial risk and perceived performance risk where the most notorious negative influencers of acceptance intention to perform payment. This can be important considering microtransactions are performed often through mobile devices. Also worth noting is that a virtual good does not have the same risk factors as a normal purchase. There is for example no physical risk present for a virtual purchase on a mobile game world.
Additionally, Forsythe, Liu, Shannon and Gardner (2006) developed a scale to measure perceived benefits and risks of online shopping. Their risks of online shopping included, yet again, financial risk and product performance risk, as well as time/convenience risk. As such, it can be seen that performance and financial risk are some of the most highlighted. This is in line with other
26 studies by Bhatnagar and Ghose (2004a, 2004b) that identified performance risk and financial risk as being associated frequently with online shopping.
27
3 – Preliminary conceptual model and research hypotheses
Despite the existence of numerous research conducted on impulse purchases, both in retail and online, there has not been a thorough investigation regarding impulse buying towards microtransactions, which happen almost entirely online through game-driven applications. Moreover, regarding mobile microtransactions directly, there is not a great research on the matter regarding buying motivations and which ones are more prone to lead to acts of impulse.
It is this gap in the literature that this dissertation study intends to start filling – what factors lead to a higher impulse buying in a microtransaction mobile environment. This will be particularly important considering that microtransactions might very well be an important component in e-commerce and the digital market and are already a key component in mobile game-driven applications (Grubb, 2014).
Seeing as this is a study to identify impulse buying behavior towards mobile game-driven applications, it becomes vital to be able to ascertain a person’s impulse buying behaviors. Verplanken and Herabadi’s (2001) Impulse Buying Tendency (IBT) scale has 2 facets: cognitive and affective. These 2 factors are a good predictor of the level of impulse buying of a user (Hausman, 2000; Verplanken & Herabadi, 2001; Kim & Eastin, 2011). As such, it makes sense to use that scale to identify the respondent’s IBT level concerning mobile game microtransactions and subsequently see what are the main components of microtransactions that fuel their impulse buying behavior.
Lehdonvirta’s (2009) Purchase Drivers for Virtual Items are a good starting point to link with microtransaction impulse buying behavior – identifying which types of content are more likely to create a bigger impulse feeling and lead to a faster and more sudden purchase – especially seeing as these attributes are in some ways linked with the Consumer Perceived Value model by Sweeney and Soutar (2001). In that model, four dimensions are identified (emotional, social, value for money and performance) that can potentially lead to a higher perceived value of products and consequently enhance the purchase intention of game items as seen in Yoo (2015). The values and drivers from the previous sources can then be coupled with the Impulse Buying Tendency (IBT) scale of Verplanken and Herabadi (2001) to discover the impact that each of them have on an individual’s IBT level. Having this into account, several hypotheses can be formulated based on those sources.
28 Lehdonvirta (2009) divides the drivers of virtual items in two main categories: functional and cosmetic. Functional drivers have two sub branches: performance and functionality. These sub branches are in line with Sweeney and Soutar’s (2001) CPV model, which has a functional value for performance/quality (perceived value and expected impact of the product) as well. However, in Yoo’s (2015) study, this specific value was found to have a negative effect on purchase intention, with one claim being that there is a broad concept of functional value and that it should be modified specifically to adapt to a game context. As such, it makes sense to divide this functional value and use Lehdonvirta’s (2009) functional drivers instead, which already have a gaming environment in mind.
The basic premise behind performance traits and functionality traits is that, respectively: powerful characters or actions are more competent against other players or perform better in-game and allow better performances overall; and that extra game content and functionalities will lead to a more entertaining and enjoyable experience (Lehdonvirta, 2009; Evers et al, 2015; Yoo, 2015). With this, the first 2 hypotheses can be formulated:
H1: Microtransaction performance based content has a positive influence on microtransaction impulse buying tendency (IBT) of consumers.
H2: Microtransaction functionality based content has a positive influence on microtransaction IBT of consumers.
Going back to Lehdonvirta’s (2009) item drivers, the cosmetic drivers also have two sub branches: hedonic and social attributes. In the CPV model, there are also two similar values: an emotional value (feelings or affective states a product generates) and a social value (the products ability to enhance social self-concept).
In these cases, social items – those who are rare or confer a sort of social status – can increase the enjoyment of the game (Lehdonvirta, 2009; Guo & Barnes, 2012; Chen, Lu & Wang, 2016) while hedonic items – customizability and aesthetic objects – if sufficiently compelling, can give users self-indulging pleasure from experiencing them (Lehdonvirta, 2009; Guo & Barnes, 2012). Mobile microtransaction based content offers quite a lot of these two types of content and, as such, two more hypotheses can be generated:
29 H3: Microtransaction hedonic/emotional personalization content has a positive influence on microtransaction IBT of consumers.
H4: Microtransaction social personalization content has a positive influence on microtransaction IBT of consumers.
Perceived risk can also be a hindrance towards impulse buying behavior (Lee and Yi, 2008). There are several factors that compose perceived risk (Jacoby & Kaplan, 1972) although some of them might not apply to the same extent to microtransactions such as physical risk – game items are virtual goods that cannot harm a human being, for example. Of the several types of perceived risks, financial risk and performance risk appear to be the most influential ones across several types of products (Yang et al, 2015; Forsythe et al, 2006; Ueltschy et al, 2004; Bhatnagar & Ghose, 2004a, 2004b). It makes sense to include these two risks within the realm of mobile game microtransactions since users can experience a risk of a microtransaction purchase not performing as expected in-game and/or losing money if the purchase was not considered useful after buying or was considered unsafe to perform.
As such, these two types of risk will be combined to form the perceived risk of mobile microtransactions. Bearing this in consideration, the following hypothesis is devised:
H5: A perceived low microtransaction risk has a positive influence on microtransaction IBT of consumers.
An additional factor affecting online impulse buying tendency is the flow experience (Wu et al, 2016). Moreover, flow experience seems to matter more in entertainment services where mobile games are inserted (Chang & Wang, 2008). Flow experience is assessed through factors such as curiosity, interest and focused attention on the activity at hand (Webster & Trevino, 1995). These can be roughly translated to a user’s interest in the mobile game, the game’s quality and its ability to absorb and addict the player, creating a pleasurable experience. A sixth hypothesis can be created:
H6: A mobile game that provides a high flow experience leads to a positive influence on microtransaction IBT of consumers.
Furthermore, because price is what in great part defines a microtransaction, it should also be taken into account in the proposed model. Microtransactions are low cost purchases and