Carlos Pestana Barros & Nicolas Peypoch
A Comparative Analysis of Productivity Change in Italian and Portuguese Airports
WP 006/2007/DE _________________________________________________________
Susana Santos
Macro-SAMs for modeling purposes. An
application to Portugal in 2003
WP 17/2007/DE/UECE _________________________________________________________
Department of Economics
W
ORKINGP
APERSISSN Nº 0874-4548
School of Economics and Management
Macro-SAMs for modelling purposes. An application to Portugal in 2003∗.
Susana Santos
ISEG (School of Economics and Management)/TULisboa - Technical University of Lisbon;
DE – Department of Economics, UECE – Research Unit on Complexity in Economics
Rua Miguel Lupi, 20, 1249-078 Lisboa, Portugal.
Tel. +351 21 392 59 53; Fax: + 351 21 392 28 08; E-mail: [email protected].
Abstract
Knowledge of the quantifiable side of a market economy greatly depends on the form of
macro-economic modelling that is used. This, in turn, should have an underlying database.
Such a database should include the interrelated subsystems that exist within that economy
and, at the same time, it should be adaptable for modelling purposes, whilst also being flexible
and consistent, in order to allow for aggregations and disaggregations.
Based on the geographical limits of a European country and the time limit of one year (1
January to 31 December), this paper proposes, as a possible database, a Social Accounting
Matrix (SAM) constructed from the national accounts, operating within the framework of the
European System of National and Regional Accounts in the European Community of 1995
(ESA 95).
Using a numerical version of a SAM, constructed from the Portuguese national accounts for
2003, at a highly aggregated level, the aim of this paper is to show the differences between a
matrix format of the national accounts, as proposed by the ESA 95 and the United Nations
System of National Accounts for 1993 (SNA 93), from which it is constructed, and the SAM,
emphasizing its potentialities as a database for modelling purposes.
Some considerations will also be made about the relationship between SAMs and
Input-Output tables.
Key words: Social Accounting Matrix; National Accounts; Economic Modelling
JEL classification: C68; C82; E01
(September 2007)
∗
1. Introduction
The results of economic modelling could be more efficient if developed with an underlying
database.
In macroeconomic modelling, such a database should comprise the interrelated subsystems
that exist within the economy as a whole and be adapted to the methodology chosen by the
modeller. In the case of general equilibrium methodology, and for computable general
equilibrium modelling in particular, a suitable database may be the Social Accounting Matrix
(SAM). This statement is justified by the specific characteristics of such a matrix, namely the
fact that it describes the whole circular flow of a market economy and is considered to be a
flexible accounting framework. Working with the SAM makes it possible to use either
top-down or bottom-up methods to break top-down or aggregate each account into categories without
losing the consistency of the whole system.
The SAM is a square matrix in which, by convention, the entries made in rows represent
resources, incomes, receipts or changes in liabilities and net worth, whilst the entries made in
columns represent uses, outlays, expenditures or changes in assets. Each transaction is
recorded only once in a cell of its own. These figures include both production accounts and
institutional accounts, which are further subdivided into yet other accounts, defined in
accordance with the modelling purposes and the available information.
An application will be made of this method to Portugal, at a highly aggregated level, to
show how a SAM can be constructed from the national accounts and to explain the main
differences between a SAM and a National Accounting Matrix (NAM) – the matrix format of
national accounts.
After specifying the possibilities offered by the national accounts for the disaggregation of
both NAM and SAM accounts, and before drawing some concluding remarks, this paper will
also analyse the relationship between SAMs and Input-Output tables.
2. SAMs as databases for economic modelling
Each SAM can be expressed in two versions: numerical or algebraic. In the numerical
version, each cell assumes a specific numerical value, with the sums of the rows being equal
to the sums of the columns. In the algebraic version, each cell is represented by algebraic
expressions that, together with those of all the other cells, represent a SAM-based model, the
At the same time, as Pyatt (1991) stressed, “a SAM is a framework both for models of how
the economy works as well as for data which monitor its workings. Recognition of this duality
is of basic importance for quantitative analysis. It implies, inter alia, that the accounting
identities which are captured by a SAM are not to be regarded simply as consistency
requirements which must be imposed on a model, but rather they should be seen as a logical
consequence of the paradigms which economists have adopted for analyzing society.”
When working at a macroeconomic level, national accounts are the most convenient source
of basic information, although additional sources can also be used to support the
disaggregation of the SAM values and several methodologies can be used to complement each
other. Moreover, the basic structure of the macro-SAM, which is constructed from the
national accounts, provides all the consistency required for such a database. It is possible to
extract from this all the macroaggregates and other economic indicators that are essential for
improving our knowledge of the quantifiable side of the economy. Furthermore, it is also
possible to identify the national accounting transactions included in each cell in some detail,
representing an important advantage in the use of the algebraic SAM version.
For the algebraic version, additional complementary data can also be used. One such
example is population, which can be classified or not by categories (educational level, gender,
occupational status, etc.).
3. The Social Accounting Matrix (SAM) and the National Accounting Matrix (NAM)
This paper will consider national accounts within the framework of the European Union, based
on the European System of National and Regional Accounts in the European Community of 1995
– ESA 95 (Eurostat, 1996), which is an application of the 1993 version of the United Nations
System of National Accounts – SNA 93, prepared by the Inter-Secretariat Working Group and
published by the United Nations Statistical Office (ISWG, 1993). The matrix format is presented
by ¶ 8.100 – 8.155 of the former system (ESA 95) and Chapter XX of the latter system (SNA 93).
Being applied to the case of Portugal in 2003, at a highly aggregated level, the
above-mentioned matrix format of the national accounts, as shown in Table 1, will be associated
with the National Accounting Matrix (NAM) in order to distinguish it from the SAM, as
shown in Table 2, which was constructed for macro-modelling purposes in accordance with
the work of Graham Pyatt and his associates (Pyatt, 1988 and 1991; Pyatt and Roe, 1977;
Pyatt and Round, 1985) and was itself inspired upon Sir Richard Stone’s works, pioneered by
Table 1. The NAM (National Accounting Matrix) for Portugal in 2003 (in millions of euros)
SNA Account (1) (2) (3) (4) (5) (6) (7) (8)
0. Goods and services (1)
Trade and transport margins (0 = t0,0)
Intermediate consumption (133 219 = t0,I)
Final consumption (115 951 = t0,II.4)
Gross capital formation (31 715 = t0, III.1)
Exports of goods and services (38 790 = t0,V)
I. Production (2)
Output of goods and services + Net taxes
on products (253 683+18 118=tI, 0)
II.1. Primary
distribution of income (3)
Gross added value (138 582 =tII.1 ,I)
Property income (18 508 = tII.1,II.1)
Primary income from the RW (6 733=t II.1,V) II.2, II.3. Secondary
distribution of income and redistribution of income in kind
(4)
Gross national income (136 630 =
tII.2&3,II.1)
Current transfers (67 704 = tII.2&3 ,II.2&3)
Current transfers from the RW (5 554= tII.2&3 ,V)
II.4. Use of income (5)
Gross disposable income (139 037 = tII.4 , II.2&3)
Adjustment for the change in the net equity of households
in the pension fund reserve (273 = tII.4 ,II.4)
III.1. Capital (6) Gross saving
(23 087 = tIII.1 ,II.4)
Capital transfers (6 575 = tIII.1,II.I.1)
Capital transfers from the RW (3 433 = tIII.1 ,V)
III.2. Financial (7)
Net borrowing (- 5 352=
tIII.2 ,III.1)
Financial transactions
(55 871= tIII.2 , II.2)
Financial transactions from
the RW (35 266= tIII.2 ,V)
V. Rest of the world
(RW) (8)
Imports of goods and services (47 874 = t V ,0)
Primary income to the RW ( 9 007- 80 - 242 =
tV ,II.1)
Current transfers to the RW (3 148 = t V ,II.2&3)
Capital transfers to the RW (156= t V, III.1)
Financial transactions to
the RW (29 914=tV III.2)
Total 319 675 271 801 163 823 209 889 139 311 33 094 85 785 89 776
Table 2. The SAM (Social Accounting Matrix) for Portugal in 2003 (in millions of euros)
Outlays (expenditures) Incomes
(receipts)
Production and Trade (di.) Institutions
rw. Rest of the World
(7) TOTAL
p. Products (1)
a. Activities (2)
f. Factors (3)
dic. Current A. (4)
dik. Capital A. (5)
dif. Financial A. (6) P rodu ction an d T rad
e p. Products (1)
Trade and transport margins (0 = tp,p)
Intermediate consumption (133 219 = tp,a)
0
Final consumption (115 951 = tp,dic)
Gross capital formation (31 715 = tp,dik)
0 Exports
(38 790 = tp,rw )
Aggregate demand (319 675)
a. Activities (2)
Production
(253 683 = ta,p) 0 0 0 0 0 0
Production value (253 683)
f. Factors (3) 0 Gross added value
(120 944 = tf,a)
0 0 0 0
Compensation of factors from the
RW (6 733 = tf,rw)
Aggregate factors income (127 677) (d i.) In stitu tions dic. Current Account (4)
Net taxes on products (18 198 = tdic,p)
Net taxes on production (-238 = tdic,a)
Gross national Income (118 670 = tdic,f)
Current transfers (67 704 + 273 =
tdic,dic)
0 0
Current transfers from the RW (5 554 = tdic,rw)
Aggregate income (210 161)
dik. Capital
Account (5) 0 0 0
Gross saving (23 087 = tdik,dic)
Capital transfers (6 575 = tdik,dik)
- Net borrowing (5 352 = tdik,dif)
Capital transfers from the RW (3 433 = t dik,rw)
Investment funds (38 447)
dif. Financial
Account (6) 0 0 0 0 0
Financial transactions (55 871= tdif,dif)
Financial transactions from
the RW (35 266= tdif,rw)
Total financial transactions
(91 137)
rw. Rest of the World (7)
Imports + net taxes on
products (47 874 – 80=trw,p)
Net taxes on production (-242=trw,a)
Compensation of factors to the RW
(9 007=trw,f)
Current transfers to the RW (3 148= trw,dic)
Capital transfers to the RW (156= trw,dik)
Financial transactions to the
RW (29 914= trw,dif)
Value of transactions
to the RW (89 777)
TOTAL Aggregate supply
(319 675) Total costs (253 683) Aggregate factors income (127 677) Aggregate income (210 163) Aggregate investment (38 446) Total financial transactions (91 137) Value of transactions from the RW (89 776)
In accordance with the “SAM terminology”, the first three accounts of both matrices are
the production and trade accounts, while the others, except in the case of the rest of the world,
are the (domestic) institutional accounts. There is direct correspondence for all the accounts,
except for the secondary distribution of income account, the redistribution of income in kind
account (II.2&3) and the use of income account (II.4), which are all included in the current
account of the institutions (dic). As shown in Table 3, a correspondence is established
between the cells and the identification of the national accounting transactions (the respective
codes and valuation systems are shown in brackets), which can in turn be complemented or
justified through observation of the corresponding T-accounts, given by the traditional tables
of national accounts. All of these are joined together, with the Integrated National Accounts
Table (Appendix), which shows a highly aggregated level of transactions, being the one that
is adopted here.
Table 3: Correspondence between the cells of the SAM and the NAM for Portugal in 2003 (in
millions of euros)
Cell
Description (ESA – SNA code; valuation) SAM NAM
0 = tp,p 0 = t0,0 trade and transport margins
253 683 = ta,p 253 683 = tI,0 output of goods and services (P1; basic prices)
133 219 = tp,a 133 219 = t0,I intermediate consumption (P2; purchasers’ prices)
115 951=tp,dic 115 951=t0,II4 final consumption (P3; purchasers’ prices)
31 715 = tp,dik 31 715 = t0,III1 gross capital formation (P5; purchasers’ prices)
47 874 = trw,p 47 874 = tV,0 imports ( P7; cif prices)
38 790 = tp,rw 38 790 = t0,V exports (P6; fob prices)
120 944 = tf,a 138 582 = tII1,I gross added value or gross domestic product (B1g; D1, D4;
factor cost in the SAM; purchasers’ prices in the NAM)
118 670 = tdic, f 136 630 = tII.2&3,II.1 gross national income (B5g; factor cost in the SAM;
purchasers’ prices in the NAM)
- 18 508 = tII.1 II.1 net property income (D4)
9 007 = trw,f 9 007 = t V,II.1 compensation of factors or primary income (D1, D4) paid to the
rest of the world
6 733 = tf,rw 6 733 = t II.1,V compensation of factors or primary income (D1, D4) received
from the rest of the world
67 977 = tdic,dic
67 704 = tII.2&3,II.2&3 current transfers (including adjustments made for the change in the net equity of households in pension fund reserves) within domestic institutions (D5, D6, D7, D8)
273 = tII.4 II.4 Sum = 67 977
3 148 = trw,dic 3 148 = tV,II.2&3 current transfers to the rest of the world (D5, D6, D7)
Cell
Description (ESA – SNA code; valuation) SAM NAM
23 087 = tdik,dic 23 087 = tIII.1,II.4 gross saving (B8g)
6 575 = tdik,dik 6 575 = tIII.1,III.1 capital transfers within domestic institutions (D9)
156 = trw,di k 156 =tV,III.1 capital transfers to the rest of the world (D9, K2)
3 433= tdik, rw 3 433= tIII.1,V capital transfers from the rest of the world (D9, K2)
55 871 = tdif,dif 55 871 = tIII.2,III.2 financial transactions within domestic institutions (F1, …, F7)
29 914 = trw,dif 29 914 = tV,III.2 financial transactions to the rest of the world (F1, …, F7) +
statistical discrepancy
35 266 = tdif,rw 35 266 = tIII.2,V financial transactions from the rest of the world (F1, …, F7) +
statistical discrepancy
5 352 = tdik,dif - 5 352 = tIII.2,III.1 net borrowing/lending (B9)
- 139 037 = tII.4,II.2&3 gross disposable income (B6/7g)
- 238 = tdic,a - net taxes on production paid to domestic institutions (general
government) (D29-D39)
- 242 = trw,a - 242 = tV,II.1
net taxes on production paid to the rest of the world (D29-D39)
18 198 = tdic,p 18 198 = tI,0 net taxes on products paid to domestic institutions (general
government) (D21-D31)
- 80 = trw,p - 80 = tI,0,tV,II.1 net taxes on products paid to the rest of the world (D21-D31)
Source: Santos (2006a and 2007); Tables 1 and 2
Because of the modelling purposes of the SAM, its main differences in relation to the
NAM have to do with the valuation system underlying production and trade. Three levels can
be distinguished in that system: factor cost; basic/cif/fob prices and purchasers’ or market
prices.
The first of these levels is that of the compensation of the factors used in the production
process of the domestic economy in the accounting period. In analysing those factors, one can
distinguish between labour (employees and own-account workers and/or employers) and
capital. In this case, compensation is respectively the compensation of employees (wages and
salaries and employers’ social contributions – transactions D11 and D12 of the National
Accounts), mixed income (balance B3 of the National Accounts) and the gross operating
surplus (balance B2of the National Accounts).
At the second level, one can distinguish between the production of the domestic economy
and imports. In the first case, this is measured by the factor cost from the previous level, plus
(other) taxes on production (transaction D29 of the National Account) net of subsidies on
production (transaction D39 of the National Accounts), as well as by intermediate
transacted in the domestic market and the fob (free on board) price level of the production that
will be exported. Imports, valued at cif (cost-insurance-freight included) prices, are added, at
this level, to the above-mentioned unexported part of domestic production that will be
transacted in the domestic market.
The third level relates to products, either domestically produced or imported, that are
transacted in the domestic market. Here, the basic/cif prices (referred to in the previous level)
will be increased by adding to them the trade and transport margins and the taxes on products
(transaction D21 of the National Accounts) net of subsidies (transaction D31 of the National
Accounts.
The identification of these three levels will make it possible to break down the values of
domestically transacted products and can be useful for analysing the causes of their evolution
in real and nominal terms, as well as in terms of their implicit prices, since the national
accounts provide information about these through current and previous year prices.
In the SAM, the net indirect taxes (on production and products) have their own
submatrices, so that it is perfectly possible to work upon these in isolation, something that is
not possible in the case of the NAM.
On the other hand, the current account of (domestic) institutions in the SAM, which takes
into consideration almost all of the flows shown in the III.2-III.4 accounts of the NAM,
benefits from a much more simplified treatment, with obvious repercussions at the modelling
level.
The remaining differences are not relevant, since they essentially have to do with the
modeller’s way of working and interpreting reality, as, for example, in the case of “net
lending/borrowing”. This item is considered in the SAM’s capital account to be a resource or
a component of the investment funds required/not required to cover aggregate investment,
whereas it is considered as a use in the NAM. In the SAM’s financial account, however, it is
considered as a use, because it is used to cover/absorb the financing requirement/capacity of
the economy, with financial transactions from/to the rest of the world, whereas it is
considered as a resource in the NAM.
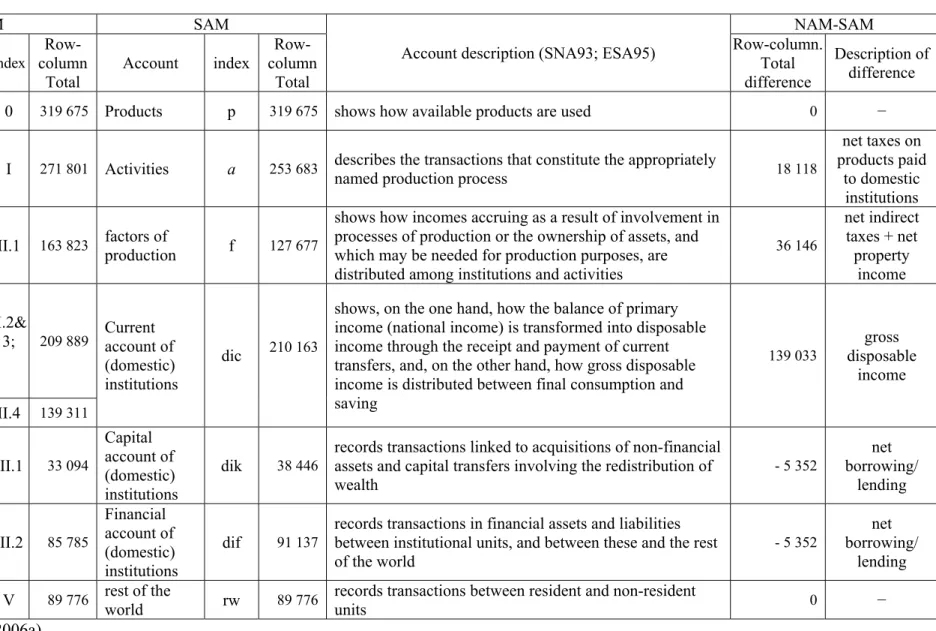
Table 4 systematizes the relevant differences between these two matrix approaches to the
Table 4. The differences between the accounts of the SAM and the NAM for Portugal in 2003 (in millions of euros)
NAM SAM
Account description (SNA93; ESA95)
NAM-SAM
Account index
Row-column Total Account index Row-column Total Row-column. Total difference Description of difference goods and
services 0 319 675 Products p 319 675 shows how available products are used 0 −
Production I 271 801 Activities a 253 683 describes the transactions that constitute the appropriately
named production process 18 118
net taxes on products paid to domestic institutions primary distribution of income
II.1 163 823 factors of
production f 127 677
shows how incomes accruing as a result of involvement in processes of production or the ownership of assets, and which may be needed for production purposes, are distributed among institutions and activities
36 146
net indirect taxes + net property income secondary distribution of income, redistribution of income in kind account
II.2&
3; 209 889 Current account of
(domestic) institutions
dic 210 163
shows, on the one hand, how the balance of primary income (national income) is transformed into disposable income through the receipt and payment of current transfers, and, on the other hand, how gross disposable income is distributed between final consumption and saving
139 033
gross disposable
income
use of income II.4 139 311
capital III.1 33 094
Capital account of (domestic) institutions
dik 38 446
records transactions linked to acquisitions of non-financial assets and capital transfers involving the redistribution of wealth
- 5 352
net borrowing/
lending
financial III.2 85 785
Financial account of (domestic) institutions
dif 91 137
records transactions in financial assets and liabilities between institutional units, and between these and the rest of the world
- 5 352
net borrowing/
lending
rest of the
world V 89 776
rest of the
world rw 89 776
records transactions between resident and non-resident
units 0 −
4. Possible disaggregations
By either top-down or bottom-up methods, it is possible to break down or aggregate each
account into categories, using on occasion sources of information other than the SNA, without
losing the consistency of the whole system. In other words, "a crucial feature is the wide
range of possibilities for expanding or condensing such a matrix in accordance with specific
circumstances and needs" (ISWG, 1993, ¶ 20.6).
Nowadays, the ESA in general and the Portuguese National Accounts in particular provide
several (mutually exclusive) possibilities for the disaggregation of products and activities, a
few possibilities for the disaggregation of the institutional accounts and a very limited number
of opportunities for the disaggregation of the factors of production.
Therefore, production accounts, which are drawn from supply and use tables, can be
broken down into 60 activities and products, which in the case of some transactions can have
yet more levels of disaggregation. In the case of production and trade accounts, however, the
factors of production may only be broken down into labour (employees) and others. This
includes compensation of own-account workers and/or employers, interest, profits, rents….
This is why the classification of “other” has been preferred here to the term “capital”, which is
also used frequently.
In turn, the institutional accounts can be disaggregated into five institutional sectors, each
with similar economic behaviour: households, non-financial corporations, financial
corporations, general government, and non-profit institutions serving households (NPISHs).
General government can be further disaggregated into central government, local
government and social security funds, whilst financial corporations can be disaggregated into
the central bank, other monetary financial institutions, other financial intermediaries (except
insurance corporations and pension funds), financial auxiliaries, and insurance corporations
and pension funds. The rest of the world can also be broken down into the European Union
(member states and institutions), non-member countries and international organisations.
It is therefore easy to conclude that "a SAM applies the properties of a matrix format to
incorporate specific details on various economic flows" (ISWG, 1993, ¶ 20.26).
One can therefore consider that an important step forward in SAM-based modelling is
provided by the possibility, on the one hand, of constructing a consistent macro-SAM from
the national accounts, with the necessary disaggregation required for specific modelling
purposes, and, on the other hand, of identifying the SNA transactions within each of its cells,
process of disaggregation (from other sources) will be made easier, without any loss occurring
in the consistency of the system as a whole, since the transactions or cells of the matrices will
be transformed into submatrices, with the sum of all their cells being equal to the former cell.
Several methods can be used for making the necessary adjustments to these submatrices in the
macro context, with the cross-entropy method, extensively used and developed by Sherman
Robinson, probably being the most suitable.
Given the possibility of constructing consistent SAMs from the SNA, we are now certainly
experiencing the beginning of a new analytical phase in the development of this work
instrument – perhaps the third such phase, since Richard Stone, who initiated the first one,
identified the beginning of the second phase with the work of Pyatt and Roe in 1977, as he
mentions in his foreword to their book “Social Accounting for Development Planning with
special reference to Sri Lanka” (Pyatt and Roe, 1977).
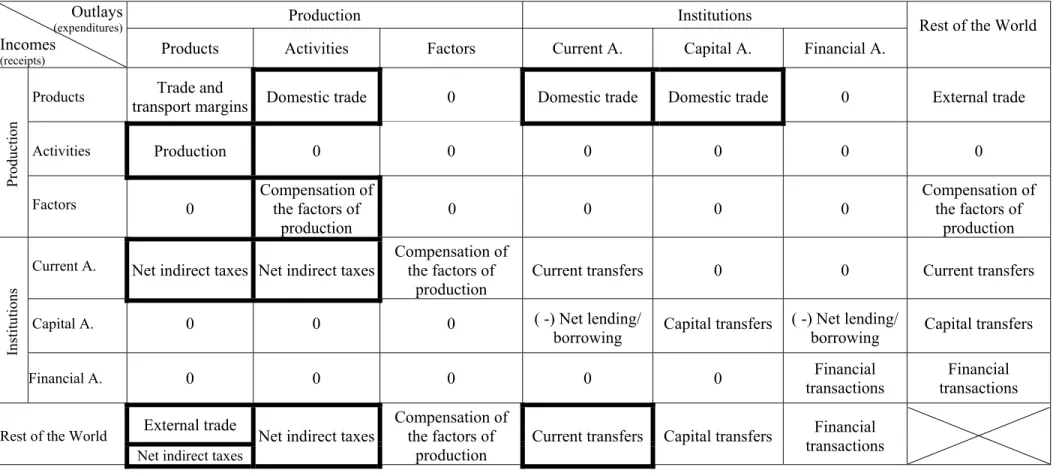
5. The SAM and the Input-Output table
SAMs are commonly considered as being a form of extended Input-Output tables, which is
not true.
Table 5 identifies blocks of submatrices or sets of submatrices that have the same
characteristics as the SAM represented in Table 2, with those that are either totally or partially
"covered" by the Input-Output (IO) table being shown with a thicker border.
The specification of these blocks involves the identification of the transactions of the
National Accounts, which are the sources of information used to construct the SAMs. These
can be clearly seen in Table 3 and are also shown in greater detail in other papers written by
the author (Santos, 2005, 2006 and 2006a).
As can be seen from an analysis of Table 5, a significant part of the blocks have no thicker
border, meaning that a significant part of the SAM is not covered by the IO table. This is
caused by the fact that the IO table doesn’t work with institutions whereas the SAM does.
On the other hand, the IO table and the SAM can both work with activities, although, in the
case of intermediate consumption, the IO table can distinguish between what is domestically
produced and what is imported whereas the SAM cannot. The essence of the IO table lies in
its ability to record the transactions between activities, with the structure of production being
conditioned by these linkages, whereas the essence of a SAM is its ability to record the
transactions (and transfers) between institutions, with the distribution of income being
conditioned by these (Pyatt, 1999). Even if institutions were introduced into the IO table, the
system offers a more extensive capture of flows and transactions, endogenizing even more of
the entries in the primary inputs and final demand components of the input-output table and,
most importantly, affording the opportunity to account for both earned and unearned income
(income from rents, dividends etc.)"1
Therefore, the SAM cannot be seen as an extension of the IO table, although a SAM could
be used to consistently study the interdependence of income distribution and production
structure (Pyatt, 1999).
1
Table 5. The SAM by blocks
Outlays
(expenditures)
Incomes
(receipts)
Production Institutions Rest of the World
Products Activities Factors Current A. Capital A. Financial A.
Pr
odu
ction
Products Trade and
transport margins Domestic trade 0 Domestic trade Domestic trade 0 External trade
Activities Production 0 0 0 0 0 0
Factors 0 Compensation of the factors of
production
0 0 0 0
Compensation of the factors of
production
In
stitu
tion
s
Current A. Net indirect taxes Net indirect taxes Compensation of the factors of
production
Current transfers 0 0 Current transfers
Capital A. 0 0 0 ( -) Net lending/
borrowing Capital transfers
( -) Net lending/
borrowing Capital transfers
Financial A. 0 0 0 0 0 Financial
transactions
Financial transactions
Rest of the World External trade Net indirect taxes
Compensation of the factors of
production
Current transfers Capital transfers Financial
transactions
Net indirect taxes
Source: Table 2
Legend:
4. Concluding Remarks
The flexibility and consistency inherent in the SAM and the possibility of its construction
from the systems of national accounts, most notably the ESA 95, may be considered to
represent major contributions towards an improved form of economic modelling.
Since SAMs can be constructed from the national accounts, time series can also be
compiled of national accounting transactions and, using the available computer technology,
these can be exposed to the full range of possibilities of econometric modelling, helping in the
definition and breakdown of the SAM cell contents. Most notably, it is even possible to
consider qualitative variables, separate quantities and prices (using current and constant or
previous year price value series) or calculate elasticities. It will then be possible to speak, for
instance, about dynamic econometric SAM-based Computable General Equilibrium (CGE)
models that, either operating in isolation or joined together in sets, will provide better policy
definition and analysis, based on the use of better data. In such a case, it will also be possible
to speak in terms of the past, present and future and/or in terms of ex-ante and ex-post
analysis.
On the other hand, if we consider modelling techniques as a support of (socio-)economic
theory, better and more stable empirical evidence can help us to (re-)evaluate this theory or
even to (re-)orient the way in which reality has traditionally been defined and conceptualized.
At the same time, policy design can be based on a more positive and less normative analysis.
References
Eurostat, 1996, European System of Accounts – ESA 95 (Eurostat, Luxembourg).
IWSG – Inter-Secretariat Working Group, 1993, System of National Accounts – SNA 93
(Commission of the European Communities – Eurostat, Brussels/Luxembourg; International
Monetary Fund, Washington, DC; Organization for Economic Co-operation and
Development, Paris; United Nations, Statistical Office, New York; World Bank, Washington
DC).
Pyatt, G., 1988, A SAM Approach to Modeling, Journal of Policy Modeling 10, 327-352.
Pyatt, G., 1991, Fundamentals of Social Accounting, Economic Systems Research 3, 315-341.
Pyatt, G. and Roe, A., 1977, Social Accounting for Development Planning with special
Pyatt, G. and Round, J., 1985, Accounting and Fixed Price Multipliers in a Social
Accounting Matrix Framework, in Pyatt, G. and Round, J. (coord.), Social Accounting
Matrices. A Basis for Planning (A World Bank Symposium, The World Bank, Washington,
DC), 186-206.
Santos, S., 2005, Social Accounting Matrix and the System of National Accounts: An
Application (Working Paper No. 14/2005, Department of Economics/Research Unit on
Complexity and Economics – ISEG-TULisboa, Lisbon)
Santos, S., 2006, Constructing a Database for Economic Modelling from the System of
National Accounts: a Social Accounting Matrix for Portugal (Working Paper Series – SSRN
(Social Science Research Network) abstract=916089)
Santos, S., 2006a, Better policy analysis with better data. Constructing a Social Accounting
Matrix from the European System of National Accounts (Working Paper No. 22/2006,
Department of Economics/Research Unit on Complexity and Economics - ISEG-TULisboa,
Lisbon).
Santos, S., 2007, Better databases for economic modelling: constructing SAMs from the SNA
Paper presented to the 2nd International Symposium on Economic Theory, Policy and