NON LINEAR GROWTH CURVES FOR WEIGHT AND HEIGHT IN
FOUR GENETIC GROUPS OF HORSES
ConCepta Margaret MCManus,1 Helder louvandini1e viníCio aurelio lagoas CaMpos2
1. Professor associado da Universidade de Brasília. E-mail: [email protected] 2. Instituto de Biologia do Exército – Rua Francisco Manuel, 102, Triagem,
Rio de Janeiro, RJ CEP 20911-270
ABSTRACT
Hanoverian, Brazilian Showjumper, English Thoroughbred and Crossbred horses reared by the Brazilian Army were weighed and measured from six months of age to adult. In total 4,860 me-asurements on 1,445 horses were available. General curves were estimated as a function of time by the Gompertz, Brody, Logistic, Weibull and Richards curves, using PROC NLIN procedures of SAS ®. The Richards Curve did not converge for weight or height of any of the genetic groups or sexes. The logistic curve did not converge for any of the weight traits while the Gompertz also did not converge for height in several groups. R2 varied between0.55
for weight in females of the crossbred group to 0.92 for males of the same group. For the height traits the highest R2 (0.66) was
found for female Hanovarian horses and lowest for males of the
same breed (0.12). In general the curves estimated similar values for asymptotic height and weight, except for Logistic curve, which also showed lowest R2 and highest error. Results for the Weibull
and Brody curves were similar in all cases so where possible the Brody curve was selected as the best curve as it had less parameters. The Gompertz curve tended to underestimate mature weights and height. Estimates for both weight and height were in general higher in males than for females. In most cases the b parameter was shown to account for < 0.0001% of the variation in the curve shape. The
k parameters, which indicate maturity, were of similar magnitude for the Brody, Gompertz and Weibull curves, for both height and weight within breed. This parameter indicated that there is little difference in maturation rates between males and females. KEY WORDS: Brody,Gompertz, Logistic, Richards, Weibull.
RESUMO
CURVAS DE CRESCIMENTO NÃO-LINEARES PARA PESO E ALTURA EM QUATRO GRUPOS GENÉTICOS DE CAVALOS Cavalos das raças Hanoveriana (HA), Brasileiro de
Hipis-mo (BH), Puro Sangue Inglês (PSI) e mestiços (PSIxBH) criados pelo Exército brasileiro foram pesados e medidos de seis meses de idade até adulto. Realizaram-se 4.860 medidas em 1.445 cavalos. Estimaram-se curvas de crescimento gerais usando os modelos de Gompertz, Brody, Logistic, Weibull e Richards, segundo o procedi-mento PROC NLIN do programa SAS ®. A curva de Richards não convergiu para peso nem altura para nenhum dos grupos ou sexos avaliados. A curva logística não convergiu para os pesos, enquanto o modelo de Gompertz não convergiu para altura em vários grupos. R2 variou entre 0,55 para peso em fêmeas mestiças até 0,92 em
machos do mesmo grupo. Para altura, o maior R2 (0,66) foi para
machos Hanovarianos e o menor para fêmeas da mesma raça (0,12).
Em geral, as várias curvas estimaram a mesma altura e peso adulto, exceto a curva logística, que teve o menor R2 e mais alto erro dentro de cada grupo. Resultados para as curvas de Weibull e Brody foram similares em todos os casos. A curva de Brody foi selecionada como a melhor, porque possui menos parâmetros. A curva de Gompertz teve a tendência de subestimar pesos e alturas adultos. Estimativas para ambos as características foram mais altas em machos que fêmeas. No maior parte dos casos, o parâmetro b levou em consideração menos que 0,0001% da variação em forma da curva. Os parâmetros
k, indicando maturidade, foram de magnitude similar para as curvas de Brody, Gompertz e Weibull, para altura e peso dentro de raça, o que indicou pouca diferença entre machos e fêmeas para taxa de maturação entre sexos.
INTRODUCTION
Little is known about growth rates of horses and tracking growth means that informed decisions can be taken about growing horses’ nutrition program and accurate assessments growth progress can be made. Rapid and/or irregular growth rates may be linked to the incidence of developmental orthopedic diseases and therefore growth tracking and accurate diet formulation are useful (KEELE et al., 1992; WILLIAMS et al., 1992) to reduce the on-farm in-cidence of developmental diseases (WEBSTER et al., 1982).
Modeling growth using mathematical functions summarizes growth data for an individual or a popula-tion (BATHAEI & LEROY, 1996). Many data points taken over time are reduced to a few parameters. The resulting curve provides a visual description of gro-wth, and interpretation of the estimated parameters provides an explanation of what is occurring biolo-gically (KSHIRSAGAR & SMITH, 1995).
The shape of growth curves have been reported to vary according to the species of animal, environ-ment and trait (EFE, 1990; AKBAS et al., 1999). An ideal equation is one which adequately predicts the overall shape of a growth curve and, in addition, can
be extended or modified to give greater flexibility
and precision (MOORE, 1985). Selection of fast or slow growing animals can be carried out using these functions, especially animals which are more mature at an earlier age (BROWN et al., 1972; FITZHUGH, 1976).
Non linear functions with exponential compo-nents are most commonly used to describe this type of growth, as these summarize a large volume of data. These functions are easy to interpret biologically and easily compared between different production systems (SILVA et al., 2002). According to TEDESCHI et al. (2000), the parameters of nonlinear curves (such as Gompertz, Brody, Logistic, Weibull and Richards) which have biological interpretation are superior asymptotic (mature) weight and maturing rate, which is an indication of growth rate. The other parameters are mathematical constants which help to determine curve shape. The objective of this study was to select a non-linear function which best describes growth of horses reared by the Brazilian Army.
MATERIAL AND METHODS
All horses in the Brazilian Army are produced by the Coudelaria de Rincão, located in São Borja, Rio Grande do Sul State. It is situated at latitude 55° 35’ 00” south and 28° 45’ 40” West, with an altitude of 130m and the climate is Humid subtropical Cfa
according to the Köppen classification, with rainfall
well distributed throughout the year and mean 1,350 mm. The study has 206 dams and 15 stallions. Both mares and stallions were from the proper herd or on loan from other studs. Weaning was at six months of age. Pastures were based on temperate grasses inclu-ding oats (Avena sp), azevém (Lolium multiflorum) and clover (Trifolium repens). Stallions also received alfalfa hay daily (Medicago sativa) ad libitum.
Data were also collected from Military Organi-zations distributed in all of Brazilian national territory, except Amazon, where the animals are sent after 24 months of age. In these installations they receive con-centrate with 14% crude protein (CP), divided in three meals a day and foals received a ration with 18% CP. The horses may be stabled or semi-stabled, depending on the station. The horses may be transferred betwe-en stations, depbetwe-ending on necessity, or because they
are used by a particular officer who uses the horse in
competition. Data was collected by veterinarians in each station.
Data was available on 4,860 weight and shoulder height measurements on 1,445 Hanoverian, Brazilian Showjumper, English Thoroughbred and Crossbred horses, measured from six months of age to adult.
Curves
Weight and height were analysed as a function of time using Gompertz, Brody, Logistic, Weibull and Richards curves. The Richards curve describes changes in size Y (weight or height) in relation to age t, and is represented by the equation:
Yt = a (1±be-kt)m.
measure. Calculating k-1 the time used to obtain
ma-turity is found, which serves as a measure of mama-turity (TAYLOR & CRAIG, 1965). The greater the value of
k means that animals mature earlier; m = is inflexion
parameter, which establishes the degree of maturity u at the inflexion point ui = [(m-1)/m]
m, with u
t the
pro-portion of weight attained at age t: ut = Yt/a = (1-be-kt) m; and e is the Napier base for natural logarithms. The
sign “±” when m>1, is – and + when m<0.
The parameter m assumes the following values for the other curves in the Richards family: Brody (1),
Gompertz (µ → ∞) and Logistic (-1). The Brody and
Logistic curves are respectively, Yt = a-be-kt and Y t =
a(1+be-kt)-1. The Gompertz curve is a limiting case of
the generalised logistic as t becomes very small or very large, whose equation is: Yt = a e –be ^ -kt. The Weibull
curve is : Yt = a- (be-kt^d)
Procedures described by PEREIRA & ARRUDA (1987) and SAS (1987) were used for convergence of non-linear data. The values of sum of squares of the
residual (SQr), coefficient of determination (r2) and
divergence from regression for each function were calculated. The r2 was calculated as r2 = 1 (sqe)/(sqt),
where sqe is the sum of squares of the error and sqt, is the total sum of squares (KVÅLSETH, 1985).
Individual estimates of growth parameters were
obtained using the modified Gauss-Newton method in
the NLIN procedure of SAS ® (HARTLEY, 1961; LA-WTON et al., 1972). Convergence was assumed when the difference in sum of residual sum of squares between the ith –1 to the ith iteration was < 10-8. The mean square of
the residual was calculated for each function. The r2 and
error were used to evaluate the adjust of the curve.
RESULTS
The Richards Curve did not converge for weight or height of any of the genetic groups or sexes. The lo-gistic curve did not converge for any of the weight traits while the Gompertz also did not converge for height in several groups. R2 varied between0.55 for weight
in females of the crossbred group to 0.92 for males of the same group. For the height traits the highest R2
(0.66) was found for female Hanovarian horses and lowest for males of the same breed (0.12). Tables 1 to 4 shows a summary of the analyses carried out for
each breed and trait. Figures 1 and 2 show the best fit curves for the data in this study with 95% confidence
limits. Adult height and weight is reached in all cases at about three years of age.
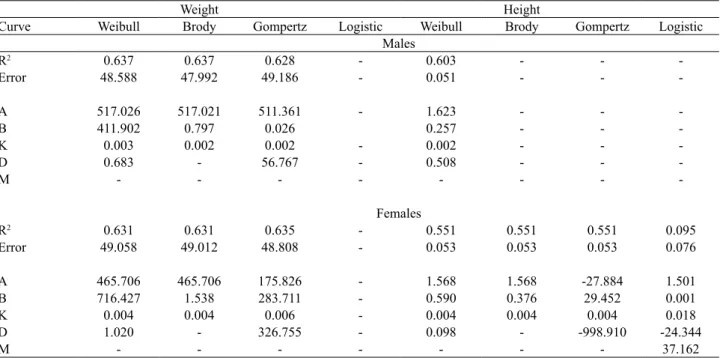
TABLE 1. Growth curve parameters for height and weight of Brazilian Showjumpers in the Brazilian Army
Weight Height
Curve Weibull Brody Gompertz Logistic Weibull Brody Gompertz Logistic Males
R2 0.637 0.637 0.628 - 0.603 - -
-Error 48.588 47.992 49.186 - 0.051 - -
-A 517.026 517.021 511.361 - 1.623 - -
-B 411.902 0.797 0.026 0.257 - -
-K 0.003 0.002 0.002 - 0.002 - -
-D 0.683 - 56.767 - 0.508 - -
-M - - -
-Females
R2 0.631 0.631 0.635 - 0.551 0.551 0.551 0.095
Error 49.058 49.012 48.808 - 0.053 0.053 0.053 0.076
A 465.706 465.706 175.826 - 1.568 1.568 -27.884 1.501
B 716.427 1.538 283.711 - 0.590 0.376 29.452 0.001
K 0.004 0.004 0.006 - 0.004 0.004 0.004 0.018
D 1.020 - 326.755 - 0.098 - -998.910 -24.344
M - - - 37.162
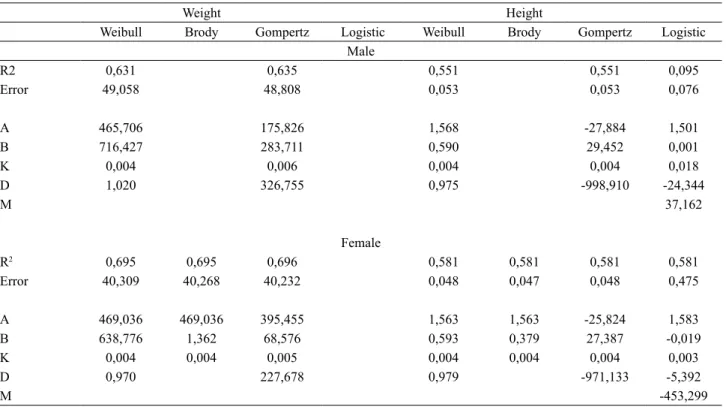
TABLE 2. Growth curve parameters for height and weight of Hanoverian Horses in the Brazilian Army
Weight Height
Weibull Brody Gompertz Logistic Weibull Brody Gompertz Logistic Male
R2 0,631 0,635 0,551 0,551 0,095
Error 49,058 48,808 0,053 0,053 0,076
A 465,706 175,826 1,568 -27,884 1,501
B 716,427 283,711 0,590 29,452 0,001
K 0,004 0,006 0,004 0,004 0,018
D 1,020 326,755 0,975 -998,910 -24,344
M 37,162
Female
R2 0,695 0,695 0,696 0,581 0,581 0,581 0,581
Error 40,309 40,268 40,232 0,048 0,047 0,048 0,475
A 469,036 469,036 395,455 1,563 1,563 -25,824 1,583
B 638,776 1,362 68,576 0,593 0,379 27,387 -0,019
K 0,004 0,004 0,005 0,004 0,004 0,004 0,003
D 0,970 227,678 0,979 -971,133 -5,392
M -453,299
R2 – determination coefficient; a,b,k,d,m – see text for details
TABLE 3. Growth curve parameters for height and weight of English Thoroughbred Horses in the Brazilian Army
Weight Height
Weibull Brody Gompertz Logistic Weibull Brody Gompertz Logistic Male
R2 0,594 0,594 0,594 0,128 0,120 0,371 0,198
Error 32,217 31,357 32,193 0,065 0,064 0,054 0,064
A 407,668 407,668 317,266 1,524 1,526 1,613 1,905
B 486,156 1,193 89,680 -173868,480 -59,150 0,110 -0,385
K 0,004 0,004 0,005 559,580 0,644 0,001 0,015
D 1,004 180,066 136482,940 15,164
M 55,419
Female
R2 0,921 0,920 0,662 0,040
Error 15,800 15,910 0,048 0,083
A 287,481 286,646 1,563 1,502
B 1405,582 0,144 0,354 0,002
K 0,006 0,010 0,003 0,019
D 1,490 208,682 0,626 -101,87
M 36,964
TABLE 4. Growth curve parameters for height and weight of No Defined Breed Horses in the Brazilian Army
Weight Height
Weibull Brody Gompertz Logistic Weibull Brody Gompertz Logistic Male
R2 0,593 0,593 0,596 0,454 0,454 0,454 0,459
Error 47,985 47,967 47,857 0,059 0,059 0,059 0,058
A 447,532 447,532 131,606 1,543 1,543 -28,094 -2,631
B 570,498 1,275 310,446 0,506 0,328 29,637 4,182
K 0,004 0,004 0,005 0,004 0,004 0,004 0,002
D 0,963 273,614 0,947 -1102,628 -25,174
M -1307,832
Female
R2 0,555 0,560 0,517 0,517 0,517 0,519
Erro 49,679 49,416 0,050 0,050 0,050 0,050
A 438,519 261,845 1,538 1,538 -35,370 1,050
B 630,423 172,221 0,532 0,346 36,909 2,591
K 0,004 0,006 0,004 0,004 0,004 0,003
D 1,028 311,203 0,978 11077,448 -10,685
M -709,391
R2 – determination coefficient; a,b,k,d,m – see text for details
In general the curves estimated similar values for asymptotic height and weight, except for Logistic curve, which also showed lowest R2 and highest error.
Results for the Weibull and Brody curves were similar in all cases so where possible the Brody curve was se-lected as the best curve as it had less parameters. The Gompertz curve tended to underestimate mature wei-ghts and height. Estimates for both weight and height were in general higher in males than for females.
DISCUSSION
Mean adult values estimated by the adjusted curves are very close to the mean values found by CAMPOS et al. (2007) in the adult horses (>48 mon-ths of age) of both sexes. The Hanoverian horse is a founder of the Brazilian Showjumper breed (DIAS et al., 2000), the two largest breeds in this study.
The logistic and the Gompertz equations have three parameters, all of which are biologically
inter-pretable and statistically significant in the present
analysis. Parameters having a straightforward meaning are advantageousfor statistical parameterization of non-linear equations. Parameters of such non-linear functionshave to be estimated by using an iterative regression approach,such as PROC NLIN of SAS ®, which requiresan initial estimate of the parameters. Initial values here were taken from SANTOS et al. (2007) for Pantaneiro horses.
Contrary to this study, experiments have shown that the Richards function has the best for modeling this type of data (BROWN et al., 1976; DeNISE & BRINKS, 1985), but these studies also show that the Brody function is better above six months of age, as with these data, where the youngest age was 6 months. Other authors found that while the logistic function underestimates and Brody overestimates adult wei-ght compared to the Richards and Von Bertalanffy functions (DUARTE, 1975; PEROTTO et al., 1992), although standardization has been carried out for use of the Brody function in cattle (BROWN et al., 1972; DUARTE, 1975; SILVEIRA JR., 1976; LUDWIG,
1977). Although it is shown to be flexibile, the Ri -chards equation has often beencriticized as the shape parameter has no obvious biologicalinterpretation and is so unstable numerically that its estimatebecomes useless (ZEIDE, 1993). YIN et al. (2003) found that in no case did the Richards equation achieve a statistically
significantimprovement over the logistic equation, and in only two cases did it improve on the Gompertz equation.For the data sets used in thepresent analysis the Richards equation did not converge. TEDESCHI et al. (2000) also found that the Richards curve had
the most difficulty in converging when using Brazilian
beef cattle data.
No mathematical model can accurately describe every biological phenomenon (TABATABAI et al.,
2005). Many models have been developed to deal with sigmoid growth (ZEIDE, 1993) and new ones are continuously being proposed. While the logistic
function is symmetric around the point of inflection, the Richards function is more flexible and can fit
asymmetric growth patterns (TABATABAI et al., 2005; ZHU et al., 1998), however, it has more pa-rameters than the logistic function. The Gompertz function has the same number of parameters as the logistic function and the Weibull function has the same number of parameters as the Richards function
and both can fit asymmetric growth, but they are not very flexible (YIN et al., 2003). In the logistic model,
the growth curve is symmetric around the point of maximum growth rate and has equal periods of slow and fast growth (TABATABAI et al., 2005). In con-trast, the Gompertz model does not incorporate the symmetry restriction and has a shorter period of fast growth. Both the logistic and Gompertz have points
of inflection that are always at a fixed proportion of
their asymptotic population values. The same author
noted that the description of growth by fixed-shape
sigmoid models such as logistic, Gompertz or Von Bertalanffy curves may not be adequate because of the failure of the assumption that a constant curve shape holds across treatment groups. While the abo-ve equations predict a positiabo-ve non-zero value for
Y at time t = 0, the Weibull function predicts Yt = 0 when t = 0 (YIN et al., 2003), which is not true with growing animals.
The results found here are different from those found by SANTOS et al. (2007) working with Pan-taneiro horses and who chose Richards and Weibull curves for shoulder height and weight, respectively. SANTOS et al. (1998) with different data, also for the Pantaneiro horse, chose the Weibull curve for shoulder height. It also differs from the results found by FREITAS (2005), who studied growth curves in eight species of animal, and concluded that the logistic model was the most adequate. Figures 1 and 2 show the
resultant curves and 95% confidence limits for male
and female horses respectively.
The choice of the best curve using the analysis of variance residuals is not necessarily the best option as longitudinal data (such as weight and height on the same animal) show correlated errors between ages.
to various factors which are not necessarily reflected in
the curve. Recommended methods for curve selection include the evaluation of the difference between
ob-served and predicted values at specific ages (BROWN
et al., 1976), but these ages are not always available. Other methods include: residual sum of squares (PE-ROTTO et al., 1992), regression deviations,
determi-nation coefficient (R2), percentage and difficulty of
convergence (BROWN et al., 1976; OLIVEIRA et al., 2000), curve behaviour and evaluation of parameters by comparison and graphic evaluation of the curves (FITZHUGH, 1976). Here R2 and divergence were
used as criteria for selection of the model.
Other authors (JONES, 1987; HEUSNER, 1992; YAMAMOTO et al., 1993; THOMPSON et al., 1994 and PAGAN et al., 1996), found that males generally presented higher growth rates than females. The males in this study were castrated at 24 months of age, but some authors (HEUSNER, 1997) state that castration does not affect development at this age.
Growth data in the literature is limited for adult horses of the breeds studied here. Adult shoulder height was found to be 137.65 cm for the Pantaneiro horse in Brazil (MISERANI et al., 2002) and 144cm for Campeiro (McMANUS et al., 2005). The same trait in Mangalarga Machador horses was found to be 151.5cm and 151.6cm for males and females respec-tively (CABRAL et al., 2004) and 149 and 150cm for Arabian horses (SADEK et al., 2006). Using regres-sion equations, STAINER et al. (2004) showed that Thoroughbred horses reached 542 ± 6.2 kg reached at 7 yrs, somewhat heavier than found here.
CONCLUSION
The Weibull and Brody curves best fitted the
increase of height and weight for horses reared in the Brazilian Army. Other curves returned results not consistent with the data or, in the case of the Richards curve, failed to converge. There was little difference between sexes for maturing rate.
ACKNOWLEDGEMENTS
The authors wish to thank the Brazilian Army for access to their data as well as CNPq INCT-IGSPB
and Finatec for financing the study.
REFERENCES
AKBAS, Y.; TASKÝN, T.; DEMIRÖREN, E. Comparison of
se-veral models to fit the growth curves of Kivircik and Daglic male
lambs. Turkish Journal of Veterinary Animal Science, v. 23, Suppl. 3, p. 537-544, 1999.
BATHAEI, S. S.; LEROY, P. L. Growth and mature weight of Mehraban Iranian fat-tailed sheep. Small Ruminant Research, v. 22, p. 155-162, 1996.
BATHAEI, S. S.; LEROY, P. L. Genetic and phenotypic aspects of the growth curve characteristics in Mehraban Iranian fat-tailed sheep. Small Ruminant Research, v. 29, p. 261-269, 1998. BRACCINI NETO, J.; DIONELLO, N. J. L.; SILVEIRA JR. P.; BONGALHARDO, D. C.; XAVIER, E. G. Análise de curvas de crescimento de aves de postura. Revista Brasileira de Zootecnia, v. 25, n. 6, p. 1062-1073, 1996.
BROWN, J. E.; FITZHUGH Jr. H. A.; CARTWRIGHT, T. C. A com-parison of nonlinear models for describing weight–age relationships in cattle. Journal of Animal Science, v. 42, p. 810-818, 1976. CABRAL G. C.; ALMEIDA F. Q. de; QUIRINO C. R.; PINTO, L. F. B.; SANTOS, E. M.; CORASSA, A. Morphmetric evalua-tion of Mangalarga Marchador horses: linear measures. Revista Brasileira de Zootecnia, v. 33, p. 989-1000, 2004.
DeNISE, R. S. K.; BRINKS, J. S. Genetic and environmental aspects of the growth curve parameters in beef cows. Journal of Animal Science, v. 61, p. 1431-1440, 1985.
DUNCAN, D. B. A multiple range and multiple F tests. Biometrics, v. 2, p. 1-42, 1955.
EFE, E. Büyüme eðrileri. 1990. Ph.D. (Thesis) – Çucurova. Üniversitesi, Adana, 1990.
ELIAS, A. M. Análise de curvas de crescimento de vacas das Raças Nelore, Guzerá e Gir. 1998. 128 f. Dissertação (Mestrado em Ciência Animal e Pastagens) – ESALQ, 1998.
ESENBUGA, N.; BILGIN, Ö. C.; MACIT, M.; KARAOGLU, M. Ivesi, Morkaraman ve Tuj kuzularinda Büyüme Ergileri (Growth curves in Awassi, Morkaraman and Tushin Lambs). Atatürk Üni-versitesi Ziraat Fak. Derg, v. 31, p. 37-41, 2000.
FITZHUGH Jr. H. A. Analysis of growth curves and strategies for altering their shapes. Journal of Animal Science, v. 42, p. 1036-1050, 1976.
HALD, A. Statistical theory with engineering applications. New York: Wiley, 1952. p. 658-662,
HELMINK, S. K.; SHANKS, R. D.; LEIGHTON, E. A. Breed and sex differences in growth curves for two breeds of dog guides. Journal of Animal Science, v. 78, p. 27-32, 2000.
KOCABAS, Z.; KESICI, T.; ELIÇIN, A. Growth curve in Akkaraman, Awassi×Akkaraman and Malya×Akkaraman lambs. Turkish Journal of Veterinary Animal Science, v. 21, p. 267-275, 1997.
KROLL, L. B. Estudo do crescimento de vacas leiteiras através de modelos com autocorrelação nos erros. Revista Multiciência, v. 1, p. 164-165, 1996.
KSHIRSAGAR, A. M.; SMITH, W. B. Growth curves. New York: Marcel Dekker, 1995. p. 1-57
KVÅLSETH, T. O. Cautionary note about R2. The American
Statis-tician, v. 39, p. 279-285, 1985.
LEWIS, R. M.; EMMANS, G. C.; DINGWALL, W. S.; SIMM, G. A description of the growth of sheep and its genetic analysis. Animal Science, v. 74, p. 51-62, 2002.
TOPAL, M.; OZDEMIR, V.; AKSAKAL, N.; YILDIZ, V.; DOGRU, U. Determination of the best nonlinear function in order to estimate growth in Morkaraman and Awassi lambs Small Ruminant Research, v. 55, p. 229-232, 2004.
McMANUS, C.; FALCÃO, R. A.; SPRITZE, A.; COSTA, D.; LOU-VANDINI, H.; DIAS, L. T.; TEIXEIRA, R. A.; REZENDE, M. J. M.; GARCIA, J. A. S. Caracterização morfológica de equinos da raça cam-peiro. Revista Brasileira de Zootecnia, v. 34, p. 1553-1562, 2005. MEDEIROS, H. A.; AQUINO, L. H.; BEARZOTI, E.; FERREIRA, D. F. Avaliação da qualidade do ajuste da função logística monofásica com estrutura de erros independentes e autoregressivos através de simulação.
Ciência e Agrotecnologia, v. 24, p. 973-985, 2000.
MISERANI, M.; McMANUS, C.; SANTOS, S. A.; SILVA, J. A.; MARIANTE, A. S.; ABREU, U. G. P.; MAZZA, M. C.; SERENO, J. R. B. Variance analysis for biometric measures of the Pantaneiro Horse
Archivos de Zootecnia, v. 51, p. 113-120, 2002.
MOORE, A. J. A mathematical equation for animal growth from embryo to adult. Animal Production, v. 40, p. 441-453, 1985.
MORETTIN, P. A.; TOLOI, C. M. de C. Análise de séries temporais. São Paulo: Edgard Blücher, 2004. 536 p.
NETER, J.; WASSERMAN, W.; KUTNER, M. H. Applied linear regression models. Boston: Irwin, 1989. p. 550-562.
OLIVEIRA, H. N.; LÔBO, R. B.; PEREIRA, C. S. Comparação de modelos não-lineares para descrever o crescimento de fêmeas da raça Guzerá. Pesquisa Agropecuaria Brasileira, v. 35, p. 1843-1851, 2000.
PASTERNAK, H.; SHALEV, B. A. The effect of a feature of regression
disturbance on the efficiency of fitting growth curves. Growth, Deve-lopment & Aging, v. 58, p. 33-39, 1994.
SADEK, M. H.; AL-ABOUD, A. Z.; ASHMAWY, A. A. Factor analysis of body measurements in Arabian horses. Journal of Animal Breeding and Genetics, v. 123, p. 369-377, 2006.
SANTOS, R. dos. Os cruzamentos na pecuária tropical. Agropecuária Tropical, 1999. 672 p.
SAS Institute. SAS/ETS® User’s Guide. Version 6. 2. ed. Cary: SAS Institute, 1995. 373 p.
SILVA, F. F. E.; de AQUINO, L. H.; de OLIVEIRA, A. I. G. Estimativas de parâmetros genéticos em curvas de crescimento de gado Nelore.
Ciência Agrotecnica, v. 26, supl., p. 1562-1567, 2002.
SOUZA, G. da S. Introdução aos modelos de regressão linear e não linear. Brasília: Embrapa-SPI/Embrapa-SEA, 1998. 489 p.
STANIAR, W. B.; KRONFELD, D. S.; TREIBER, K. H.; SPLAN, R. K.; HARRIS, P. A. Growth rate consists of baseline and systematic deviation components in Thoroughbreds. Journal of Animal Science, v. 82, p. 1007-1015, 2004.
TABATABAI, M.; WILLIAMS D. K.; BURSAC, Z. Hyperbolastic growth models: theory and application Theoretical Biology and Me-dical Modelling, v. 2, p. 14, 2005.
TEDESCHI, L. O.; BOIN, C.; NARDON, R. F.; LEME, P. R. Estudo da curva de crescimento de animais da raça guzerá e seus cruzamentos alimentados a pasto com e sem suplementação. 1. Análise e seleção das funções não-lineares. Revista Brasileira de Zootecnia, v. 29, p. 630-637, 2000.
YIN, X.; GOUDRIAAN J.; LATINGA E. A.; VOS, J.; SPIERTZ, H. J.
A flexible sigmoid function of determinate growth. Annals of Botany, v. 91, p. 361-371, 2003.
ZEIDE, B. Analysis of growth equations. Forest Science, v. 39, p. 594-616, 1993.
ZHU, Q.; CAO, X.; LUO, Y. Growth analysis on the process of grain
filling in rice. Acta Agronomica Sinica, v. 14, p. 182-193, 1988.