2018
UNIVERSIDADE DE LISBOA
FACULDADE DE CIÊNCIAS
DEPARTAMENTO DE FÍSICA
Cross Disease Network Analysis
Inês Filipa Fernandes Ramos
Mestrado Integrado em Engenharia Biomédica e Biofísica
Perfil Sinais e Imagens Médicas
Dissertação orientada por:
Prof. Doutor Francisco Pinto
ii
“It is the last lesson of modern science
that the highest
simplicity of structure is produced,
not by few elements, but by
the highest complexity”
iii
Acknowledgments
I would like to thank my thesis advisor Prof. Francisco Pinto of the Gene Expression and Regulation group from the Biosystems and Integrative Sciences Institute at FCUL, for welcoming me to the project and guiding me through this new and more unfamiliar field of my academic journey.
I would also like to thank to everyone from the GER group for the great experience, for all the contributions and valuable input that helped better my work.
iv
Abstract
Diseases are often complex, caused by a combination of several factors including genetic, environmental and lifestyle factors. The complexity makes it more challenging to uncover the pathomechanisms underlying genotype-phenotype relationships. Cellular networks offer a simple framework to represent the highly interlinked cellular systems, by reducing cellular components, such as metabolites, proteins, DNA molecules or RNA molecules, to nodes and physical, biochemical or functional interactions to links between them. Diseases can be viewed as perturbations of these cellular networks, that lead to faulty physiological functions. Different diseases can have common deregulated molecular pathways, represented in the network as an overlap of subnetworks that are affected in each disease, particularly if they partially share phenotypes. The discovery of genes associated with multiple diseases is especially interesting because it can shed light on the molecular mechanisms implicated in the commonly affected physiological functions and provide new polyvalent therapeutic targets.
This dissertation builds upon a previously developed network-based method, called double specific-betweenness (S2B) method, to prioritize nodes with a higher probability of being simultaneously associated with two phenotypically similar diseases. The method was developed to use undirected networks of physical interactions between proteins and extract a network property, a modified version of betweenness centrality, to prioritize proteins specifically connected with two different diseases. The method was tested with artificial disease network modules and applied to two fatal motor neuron diseases: Amyotrophic Lateral Sclerosis and Spinal Muscular Atrophy.
The present work aims to expand the S2B method enabling the analysis of networks with directed interactions. This expansion allows the analysis of signaling and transcriptional regulatory networks, providing new regulatory information that can’t be captured with protein-protein interactions, contributing to richer mechanistic hypothesis to explain the common physiological deficiencies. The new extended version of the method was tested with several types of directed artificial disease modules, proving to be able to efficiently predict the network overlap between them and offer new insights into the role of the predicted candidates in the network. The directed S2B was also applied to the same motor neuron disease pair, demonstrating its ability to retrieve novel disease genes associated with regulatory mechanisms dysregulated in motor neuron degeneration.
Keywords: Cross-Disease Analysis, Disease Genes Prioritization, Regulatory Networks, Motor Neu-ron Diseases
v
Resumo
A grande maioria das doenças mais comuns são doenças complexas, causadas por uma combinação de vários fatores, incluindo fatores genéticos, ambientais e de estilo de vida. Com os recentes avanços em tecnologias de biologia molecular de alto desempenho e técnicas de bioinformática, a informação disponível sobre mecanismos de doença a diversos níveis moleculares, nomeadamente a nível do ge-noma, do transcriptoma, do proteoma ou do metaboloma, e em diferentes contextos, como em diferentes fases de doença, em diferentes tecidos ou organismos, tem vindo a crescer rapidamente. Atualmente as abordagens mais utilizadas para identificar genes envolvidos em doenças complexas são análises de linkage genético ou estudos de associação do genoma completo (em inglês genome-wide association studies ou GWAS) que permitem identificar regiões de cromossomas onde novos genes associados a doenças estão localizados, no entanto estas regiões podem conter elevados números de genes candidatos, aumentando o tempo e os custos da validação experimental dos genes identificados. Na última década o número metodologias computacionais alternativas que visam reduzir a quantidade de genes candidatos e priorizar os mais promissores para posterior validação experimental, tem vindo a aumentar, com es-pecial foco em técnicas que usam redes celulares. Com o aumento da qualidade e quantidade de infor-mação de interações dentro da célula e o desenvolvimento de técnicas de teoria dos grafos, foi possível construir e analisar mapas de grande dimensão de interações moleculares, onde componentes celulares como ADN, ARN, proteínas ou outras moléculas, são reduzidos a nodos e as interações entre eles, sejam interações físicas, bioquímicas ou funcionais, são reduzidas a conexões entre os nodos. As conexões podem não ter direção, representando interações em que não é possível distinguir o nodo de origem e o alvo, ou podem ser direcionadas, representando uma relação de causa-efeito ou a direção do fluxo de informação. Podem ainda ser conexões idênticas ou ser distinguidas por pesos, para representar signifi-cância estatística, confiança ou importância das associações. Redes moleculares fornecem assim uma estrutura gráfica simples e fácil de interpretar para descrever sistemas celulares complexos e altamente interligados. Doenças podem ser representadas como perturbações dessas redes celulares que se propa-gam pelas conexões, e que consequentemente levam à falha de certas funções fisiológicas. Diferentes doenças podem apresentar vias moleculares comuns desreguladas, representadas nas redes celulares como uma sobreposição das sub-redes afetadas em cada doença (também designadas de módulos de doença), particularmente se elas partilham parte do fenótipo. A descoberta de genes associados a múlti-plas doenças é especialmente interessante porque pode desvendar os mecanismos moleculares implica-dos na função fisiológica afetada em comum e fornecer novos alvos terapêuticos polivalentes.
Esta dissertação baseia-se precisamente num método computacional de redes desenvolvido recente-mente, o método de dupla especificidade (em inglês double specific-betweenness ou S2B), que prioriza nodos com uma maior probabilidade de estar simultaneamente associado a duas doenças fenotipica-mente semelhantes. A priorização baseia-se no princípio comufenotipica-mente usado de culpa por associação, que identifica e prioriza candidatos em redes com base na sua proximidade a outros genes de doença, uma vez que genes associados a um fenótipo patológico tendem a co-localizar na mesma vizinhança nas redes, formando módulos de genes associados às funções biológicas afetadas nessa doença. O método foi desenvolvido para usar redes não direcionadas de interações físicas entre proteínas e extrair uma propriedade dos nodos da rede, uma versão modificada de intermediação (ou betweenness centrality em inglês), que mede a centralidade dos nodos através da contagem do número de caminhos mais curtos que ligam genes de um módulo de doença ao genes do outro que passam por cada nodo da rede, de modo a priorizar as proteínas mais centrais e mais especificamente conectadas às duas doenças e que conse-quentemente têm maior probabilidade de pertencer à sobreposição dos módulos de doença. O método foi testado com módulos artificiais de doença cujo objetivo é reproduzir as características de módulos reais e fornecer estruturas para teste cuja sobreposição é conhecida.
vi Os testes de desempenho demostraram que o método consegue identificar corretamente a localização da sobreposição entre módulos, visto que os nodos priorizados com um score mais alto têm maior pro-babilidade de pertencer à sobreposição. O método foi também aplicado a duas doenças degenerativas dos neurónios motores, Esclerose Lateral Amiotrófica (ELA) e Atrofia Muscular Espinhal (AME). São duas doenças clinicamente e geneticamente distintas, visto que ELA é a doença neuromotora mais co-mum com início na vida adulta, caracterizada por degeneração dos neurónios motores superiores e in-feriores causando fraqueza e atrofia muscular, rigidez, espasticidade e hiperreflexia, e associada a várias causas genéticas, das quais a maioria correspondente a casos esporádicos ainda é desconhecida. A AME, por outro lado, é a doença neuromotora com início na infância mais comum, caracterizada pela degene-ração dos neurónios motores inferiores provocando atrofia muscular, causada por uma mutação heredi-tária recessiva no gene SMN1 (codifica a proteína de sobrevivência do neurónio motor) no cromossoma 5. Apesar das diferenças entre ELA e AME, vários estudos demostraram a conexões funcionais e físicas entre as causas genéticas das duas doenças, indicando uma etiologia comum associada à degeneração neuromotora presente em ambas. A aplicação do método S2B às duas doenças identificou novos genes envolvidos em processos críticos de neurodegeneração, como apoptose, reparação de ADN, processa-mento de ARN, transporte de proteínas e organização do citoesqueleto.
O presente trabalho visa expandir o método S2B possibilitando a análise de redes com interações direcionadas. A expansão permite a análise de redes regulatórias de sinalização e de transcrição, forne-cendo novas informações regulatórias que não podem ser capturadas com interações proteína-proteína e contribuindo para hipóteses de mecanismos de doença mais ricas para explicar as deficiências fisioló-gicas comuns. Em redes com conexões dirigidas um caminho que vai de um nodo A para B não é o mesmo que o caminho que vai de B para A, uma vez que se tem que ter em conta a coerência da direção do caminho, pelo que para calcular a intermediação dos nodos é necessário considerar todos os tipos de caminhos com diferentes direções que podem passar pelos nodos a conectar genes dos dois módulos de doença. De maneira a distinguir caminhos com diferentes direções e significados biológicos, três novas versões do método foram desenvolvidas cada uma a priorizar nodos com base em diferentes ligações às duas doenças. As novas versões do método foram testadas com novos tipos de módulos artificiais de doença direcionados, mais complexos e com múltiplas causas de doença num mesmo módulo, cujos resultados demostraram que o método dirigido com um todo é capaz de prever eficientemente a sobre-posição de módulos de doença na rede e adicionalmente consegue oferecer nova informação sobre o papel dos candidatos previstos nos módulos. O S2B dirigido foi aplicado ao mesmo par de doenças neuromotoras, demonstrando sua vantagem sobre o método original em recuperar novos genes de do-ença associados a mecanismos regulatórios desregulados no processo de degeneração dos neurónios motores, nomeadamente a apoptose, transcrição, metabolismo de ARN e reparação de ADN.
Os resultados promissores de ambos os estudos na previsão e priorização de genes associados a múltiplas doenças, usando redes não dirigidas de interações proteína-proteína e redes dirigidas de interações regulatórias de sinalização e transcrição, demostram a versatilidade deste método inovador para ser aplicado a diversos tipos de redes moleculares. O objetivo, no futuro, é integrar várias redes por forma a captar as interações entre diferentes componentes moleculares, que são perdidas com a utilização de apenas um tipo de dados. Ademais, sendo um método que aplica um conceito de teoria dos grafos, tem o potencial para ser aplicado a outras áreas científicas, incluindo do campo biomédico, que também utilizem redes.
Palavras-chave: Análise Inter-Doenças, Priorização de Genes de Doença, Redes Regulatórias, Doen-ças Degenerativas de Neurónios Motores
viii
CONTENTS
Acknowledgments ... iii Abstract ... iv Resumo... v List of figures ... xList of tables ... xii
List of Abbreviations ... xiii
Capítulo 1 INTRODUCTION AND THESIS OUTLINE ... 14
1.1 Dissertation project ... 15
1.2 Dissertation outline ... 15
Capítulo 2 THEORETICAL FRAMEWORK ... 16
2.1 Network theory ... 16
2.2 Network biology ... 19
2.3 Network medicine ... 22
Capítulo 3 STATE OF THE ART ... 24
3.1 Introduction ... 24
3.2 Network-based approaches to disease-gene prediction ... 25
3.3 S2B method: Specific betweenness method for cross-disease network analysis ... 31
Capítulo 4 DIRECTED S2B METHOD ... 35
4.1 Introduction ... 35
4.2 S2B method expansion ... 36
4.3 Exploratory analysis of real and artificial disease modules ... 41
4.3.1 Real disease modules ... 41
4.3.2 Artificial disease modules ... 46
4.4 Construction of directed artificial disease modules... 50
4.5 Directed S2B method performance testing ... 54
4.6 Conclusions ... 61
Capítulo 5 APPLICATION TO A REAL CASE STUDY OF MOTOR NEURON
DISEASES... 62
5.1 Introduction ... 62
5.2 Application of the directed S2B method to ALS and SMA ... 65
5.3 Results and discussion ... 68
ix
5.3.3 MND candidates’ comparison with other evidence sources ... 80
5.3.4 MND candidates network role analysis ... 82
5.4 Conclusions ... 84
Capítulo 6 DISCUSSION AND CONCLUSION ... 85
REFERENCES ... 87
x
List of figures
Figure 2.1- Adjacency matrix of undirected and directed network ... 16
Figure 2.2- Representation of bottlenecks and hubs controlling the flow and communication between different network regions ... 18
Figure 2.3- Types of cellular components and interactions that can be represented by networks ... 19
Figure 2.4-- Recurring network motifs found across species in transcription-regulatory and protein-protein interaction networks identified in Borotkanics and Lehmann ... 21
Figure 2.5- Diseasome network scheme from Goh et al. ... 22
Figure 3.1- Process of disease gene prediction and prioritization in a network-based method ... 25
Figure 3.2- DIAMOnD algorithm. At each iteration the most significantly connected node, with lowest p-value, is added to the module ... 27
Figure 3.3- Correlation of S2B score with node degree and betweenness centrality ... 29
Figure 3.4- Application of the S2B method to related two diseases ... 32
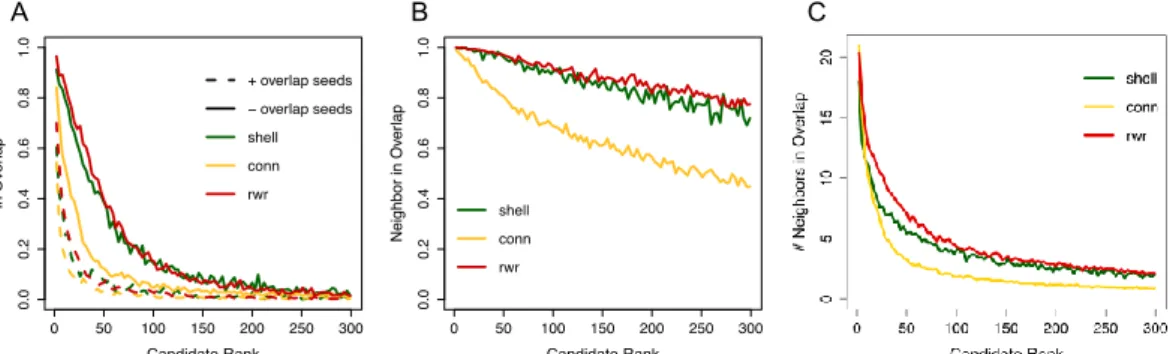
Figure 3.5- S2B method performance with three directed single cause artificial disease modules ... 33
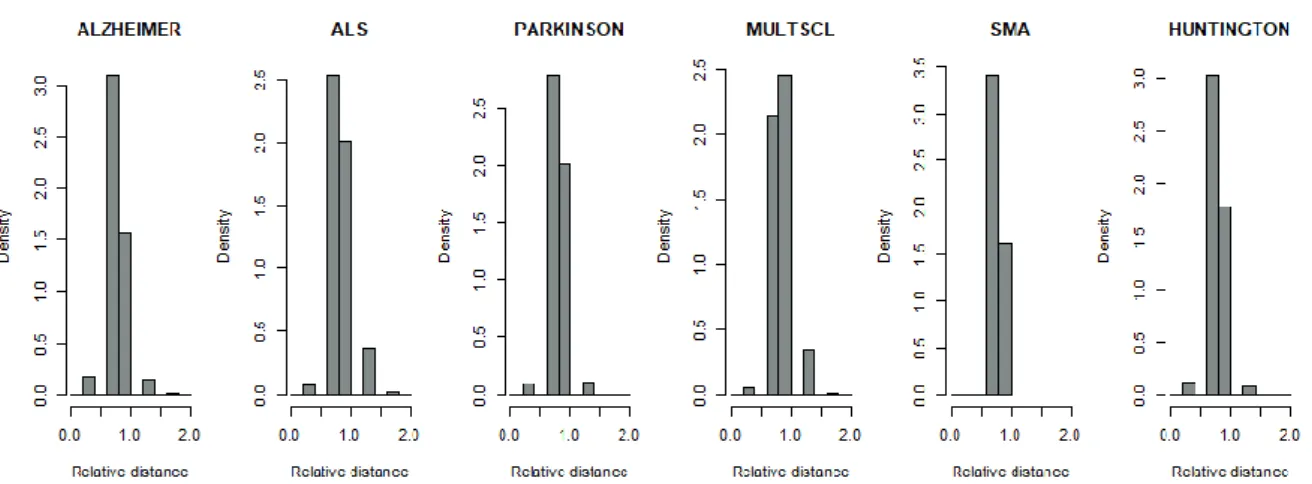
Figure 4.1- Distances between DGs relatively to the average distance of the disease module for six neurodegenerative diseases ... 41
Figure 4.2- Connectivity significance between the genes of disease modules for six neurodegenerative diseases ... 42
Figure 4.3– DGs’ degree versus number of shortest paths between DGs of each of six neurodegenerative diseases ... 44
Figure 4.4- DGs’ degree versus number of shortest paths between DGs of six neurodegenerative diseases ... 45
Figure 4.5 – DGs’ degree versus number of shortest paths between DGs of several diseases... 46
Figure 4.6- Connectivity significance between DGs of 250 randomly selected from DisGeNET. ... 47
Figure 4.7- Connectivity significance between 30% of artificial modules’ nodes sampled randomly.. 48
Figure 4.8- Connectivity significance between nodes of artificial modules sampled in two stages ... 49
Figure 4.9- Simplified illustration of the types of artificial disease modules constructed to test the directed version of the S2B method ... 51
Figure 4.10- Simplified illustration of an overlapping pair of multiple cause test modules with modifiers ... 51
Figure 4.11 – Undirected S2B method performance with three directed single cause artificial modules ... 54
Figure 4.12- Directed S2B versions performance with directed single cause artificial modules ... 56
Figure 4.13- Directed S2B versions performance with multiple cause artificial modules ... 57
Figure 4.14- Directed S2B versions performance with multiple cause artificial modules with modifiers ... 59
Figure 5.1 - Application of the directed S2B method to related two diseases ... 65
Figure 5.2- Directed S2B candidates’ regulatory interaction subnetwork ... 70
Figure 5.3- Directed S2B version 1 candidates’ regulatory interaction subnetwork ... 72
Figure 5.4- Directed S2B version 2 candidates’ regulatory interaction subnetwork ... 73
Figure 5.5 - Directed S2B version 3 candidates’ regulatory interaction subnetwork ... 74
Figure 5.6– Correlation of S2B score with betweenness in the complete signaling and regulatory network and in the S2B networks ... 75
xi Figure 5.8- Comparative analysis of FEAs of undirected S2B candidates and directed S2B candidates ... 77 Figure 5.9- Comparison of functional enrichments between undirected and directed S2B candidates ... 79 Figure 5.10 - Comparison of functional enrichments between S2B versions’ candidates ... 79 Figure 5.11– Intersection between ALS and SMA DGs retrieved from Open Targets platform and the directed S2B candidates ... 80 Figure 5.12– Fold enrichment of ALS and SMA drug targets retrieved from Open Targets platform in each candidates’ set (version 1 candidates, version 2 candidates, version 3 candidates and all S2B candidates) ... 81 Figure A.5.1- DGs out-degree and in-degree comparison of six neurodegenerative diseases .... 96 Figure A.5.2- DGs number of shortest paths out and shortest path in comparison of six neurodegenerative diseases ... 96 Figure A.5.3- DGs number of shortest paths out and shortest path in (only between DGs) comparison of six neurodegenerative diseases ... 97 Figure A.5.4 – Number of shortest paths between DGs and module nodes versus number of shortest paths between DGs of each of six neurodegenerative diseases ... 97 Figure A.6.1- DisGeNET association type ontology ... 98 Figure A.7.1- Directed S2B versions 2 and 3 performance counting with all nodes in the SPs with multiple cause artificial modules ... 99 Figure A.7.2- Directed S2B versions 2 and 3 performance counting with all nodes in the SPs with multiple cause artificial modules with modifiers ... 99 Figure A.7.3 - Directed S2B versions performance with multiple cause artificial modules ...100 Figure A.7.4- Directed S2B versions performance with multiple cause artificial modules with modifiers ... 101 Figure A.8.1- Correlation of S2B score with node degree in the complete signaling and regulatory network ... 102 Figure A.8.2– Correlation of S2B score with node degree in the S2B networks. S2B networks consist of the candidates’ subnetworks with the seeds ... 103 Figure A.9.1 – Intersection between ALS and DGs retrieved from Open Targets and the directed S2B candidates ... 104 Figure A.9.2 – Intersection between SMA DGs retrieved from Open Targets and the directed S2B candidates ... 104
xii
List of tables
Table 3.1- Network-based measures used for disease gene identification and prioritization ... 26
Table 4.1– Directed versions of the S2B method that search separately for three defined types of directional paths ... 36
Table 4.2– Pseudo-code of the three versions of the sub-function subS2B that computes the S2B score ... 39
Table 4.3- Pseudo-code of the main function S2B that computes the S2B specificity scores ... 40
Table 4.4 – Total shortest path count for real modules and artificial multiple cause modules ... 52
Table 5.1- Candidate proteins identified by the three versions of the directed S2B method ... 68
Table 5.2- Comparison of common candidates between directed and undirected S2B method ... 69
Table 5.3– Top 10 candidate proteins with higher S2B score from the candidates’ subnetwork ... 71
Table 5.4- Top 5 candidate proteins with higher S2B version 1 score from the candidates’ subnetwork ... 72
Table 5.5- Top 5 candidate proteins with higher S2B version 2 score from the candidates’ subnetwork ... 73
Table 5.6- Top 5 candidate proteins with higher S2B version 3 score from the candidates’ subnetwork ... 74
Table 5.7- GO classes and corresponding key terms manually created in Garcia-Vaquero et al. ... 78
Table A.10.1 – Comparison of MND-gene associations retrieved from different evidence sources with the S2B results ... 105
xiii
List of Abbreviations
ALS: Amyotrophic Lateral Sclerosis
DG: Disease Gene
FEA: Functional Enrichment Analysis
GO: Gene Ontology
MND: Motor Neuron Disease
MND-DGs: Motor Neuron Disease-Disease Genes
PPI: Protein-protein interactions
RWR: Random Walk with Restart
SMA: Spinal Muscular Atrophy
SP: Shortest Path
14
Capítulo 1 INTRODUCTION AND THESIS OUTLINE
Cellular function is the result of complex interactions between its components, and consequently, its structure and dynamics cannot be elucidated focusing only on individual molecules [1]. With the recent development of high-throughput molecular experimental methodologies and bioinformatic techniques in the “omics” areas (genomic, transcriptomics, metabolomics and proteomics), more knowledge and information at different biological levels became available, motivating the transition from the previous trend of individual component molecular biology to systems biology [2]. The emerging amounts of molecular interaction data generated are annotated and catalogued into databases, like HPRD [3] or BioGRID [4] that contain experimentally verified interactions, or STRING [5] that contains both experimentally verified and computationally predicted interactions. The integration of data from different databases can be used to construct large networks of interactions, like the human interactome, a human protein-protein interaction (PPI) network, which although still far from complete has a great importance for human genetics, molecular biology, and clinical medicine.
Networks provide a convenient graphical representation of molecular interactions thanks to its generality, simplicity and ability to detect complex patterns [6]. There are various types of interaction networks, including protein-protein interaction, metabolic, signaling and transcription-regulatory networks that function together to generate the coherent behavior of the cell. The cell’s constituents, such as proteins, DNA, RNA or small molecules, are reduced to a series of nodes connected to each other by links representing the interactions between the two components. The ultimate goal in biomedical research is to understand the molecular mechanisms underlying genotype-phenotype relationships, particularly for disease phenotypes. The advantage of using interaction data in the form of networks is the possibility to model the pathomechanisms as network perturbations that spread from disease-causative genes to other interacting cellular elements, affecting their function and resulting in a pathologic behavior [7]. Computational approaches can aid in the construction of network modules that respond to specific genetic perturbations, making it possible to predict new genes and biological pathways that are affected by it, contributing to a better understanding of disease mechanisms and to the discovery of new drug targets and biomarkers at a much lower cost compared to the conventionally used genome-wide techniques [6].
A consequence of the high cellular interconnectedness is a phenotypic similarity between several diseases, even diseases with different genetic causes, due to the involvement of shared molecular mechanisms that can be represented in cellular networks through an overlap of modules specific to each disease [8]. Network-based approaches can therefore be developed to predict the overlap between molecularly linked diseases and aid the development of novel polyvalent therapeutic options, or even reveal approved drugs that can be used to treat several linked diseases.
15
1.1 Dissertation project
The work developed in this dissertation is the extension of a network-based disease gene prediction method proposed by Garcia-Vaquero et al. [9], called S2B (double specific-betweenness), that aims to predict and prioritize proteins in PPI networks (networks with undirected links representing physical interactions between proteins) simultaneously associated with two phenotypically similar diseases, shedding light on the molecular mechanisms implicated in the commonly affected biological functions and potentially providing new polyvalent therapeutic targets.
The dissertation objective was to expand and optimize the S2B method to be able to analyze other cellular networks with directed links, such as signaling and gene regulatory interaction networks, and consequentially providing more information about the diseases’ mechanisms and about the role of cellular regulatory pathways in the connection between two related diseases. Although PPI data by itself provides valuable information for prioritizing disease-associated genes, the integration of different types of data can increase the predictive potential of the novel method even more. To this end the previous method ‘s algorithm was modified to adapt it to directed networks. Artificial disease network modules, designed to reproduce the properties of real disease modules, were constructed to test the performance of the new S2B version. The method was further applied to a case-study of two fatal Motor Neuron Diseases (MND), Amyotrophic Lateral Sclerosis (ALS) and Spinal Muscular Atrophy (SMA), with partially similar clinical presentations and known shared molecular links, to analyze and compare the information it retrieved compared to the original method.
1.2 Dissertation outline
The following section provides the dissertation outline divided in its chapters.
Chapter 2 presents the theoretical framework of the project, focusing first on basic network theory concepts that were used throughout this work and that help to fuel the emergence of two parallel fields, network biology and network medicine. An overview of the network biology field and its accomplishments in understanding the relationship between cellular structure and behavior is provided, along with the bridge that connects it to the medicine field and the implications it can have in clinical practice.
Chapter 3 reviews state-of the-art network-based methods for prediction and prioritization of disease-associated genes, including a summary of the development, function and results of the S2B method.
Chapter 4 describes the process of expansion and development of the new method’s version adapted to directed networks and the test results of its performance with artificial disease network modules. Additionally, the development of the artificial disease modules used to test the method is described.
Chapter 5 presents the results of the method’s application to two real case-studies of motor neuron degenerative disorders. The results are validated through a comparison with previous knowledge of the diseases and analyzed in search of new molecular information.
Chapter 6 concludes the dissertation with the final remarks about the results of the project, further work that can be developed to improve the method and obtain more specific and accurate predictions, and an exploration of its potential in other biomedical applications.
16
Capítulo 2 THEORETICAL FRAMEWORK
2.1 Network theory
Networks or graphs (herein will be used interchangeably) can be defined as maps of interactions between the components of complex systems, representing the elements as nodes or vertices and the interactions as links or edges. The links can be undirected or directed, representing a cause–effect relationship or the direction of the flow of information, and unweighted or weighted, representing the statistical significance, confidence or importance of the link. A network with N nodes can be represented as a square matrix of N rows and N columns, an adjacency matrix, in which the elements indicate whether pairs of vertices are adjacent (linked) or not in the graph (Figure 2.1a). For undirected graphs, the adjacency matrix is symmetric with an element 𝐴𝑖𝑗 is 1 when there is a link (edge) between node i and j, and 0 when there is no link between them (Figure 2.1b). If there aren’t any loops in the graph connecting a node to itself, the diagonal elements of the matrix are all zero. In directed graphs the matrix is not symmetric (Figure 2.1c).
A complete graph is a network with N nodes all connected with each other and with the maximum number or links between them, 𝐿𝑚𝑎𝑥 = 𝑁(𝑁 − 1)/2. Most real networks have a number L of links much smaller than 𝐿𝑚𝑎𝑥 and can be represented by sparse adjacency matrices with the majority of elements equal to zero.
17 There are several measures that can be used to quantitively characterize and compare networks as described in [10] and [11]. Some of the most basic measures are:
• Degree - it’s a key characteristic of a node that describe the influence of the node in the network relatively to the other nodes. Represents the number of links the node has to other nodes. Highly connected nodes, or nodes with high degree are called hubs (represented in Figure 2.2). In directed networks the degree as to be divided in in-degree kin, the number of incoming links that point to a node,
and out-degree kout, the number outgoing links that start from it.
In undirected networks the degree of each node can be found easily through the sum of the elements of each row or column of the adjacency matrix (equation 2.1).
𝑘𝑖 = ∑𝑁𝑗=1𝐴𝑖𝑗 = ∑𝑁𝑖=1𝐴𝑖𝑗 (2.1) While in directed networks the in-degree of a node is computed through the sum of the elements of the corresponding column and the out-degree through the sum of the elements of the corresponding row of the adjacency matrix (equation 2.2).
𝑘𝑖𝑖𝑛= ∑𝑁𝑗=1𝐴𝑖𝑗 ; 𝑘𝑖𝑜𝑢𝑡= ∑𝑁𝑖=1𝐴𝑖𝑗 (2.2) The degree distribution of a network, defined by pk, is also a network characteristic that can explain
many of the network proprieties. pk can be defined as the probability that a node selected at random has
degree k (equation 2.3). 𝑝𝑘 = 𝑁𝑘 𝑁 , ∑ 𝑝𝑘 ∞ 𝑘=1 = 1 (2.3)
In random networks or random graphs, used commonly to model complex networks and defined as 𝐺(𝑁, 𝐿), with N nodes connected with L randomly placed links, the degree distribution follows the binomial distribution. If a network is sparse however, like most real networks, 𝑝𝑘 with < 𝑘 > ≪ 𝑁 can be approximated by the Poisson distribution. In sparse networks the corresponding adjacency matrix has a very small fraction of elements equal to one.
• Shortest path - it’s a measure of distance between two nodes, also referred as the distance between two nodes 𝑑𝑖𝑗. Usually there are many alternative paths between two nodes. The shortest path (SP), is the path with the smallest number of links between them. In an undirected network 𝑑𝑖𝑗= 𝑑𝑗𝑖, while in a directed network often the distance is different in each direction 𝑑𝑖𝑗 ≠ 𝑑𝑗𝑖. If a network is connected (all pairs of nodes are connected) and undirected there is always a path between two nodes, but if it is directed, it may not always exist a path with a coherent direction between two nodes.
• Average path length - < 𝑑 >it’s the average over the shortest path lengths between all pairs of nodes in the network. For directed graphs is calculated in both directions, if the path exists, as in equation 2.4.
< 𝑑 >= 1
𝑁(𝑁−1)∑ 𝑑𝑖,𝑗 𝑁
𝑖,𝑗=1;𝑖≠𝑗 (2.4)
• Betweenness centrality of a node - determines the frequency with which shortest paths between any pair of nodes pass through that node. It is calculated by equation 2.5 that gives the betweenness centrality of node i, where 𝑔𝑗𝑘(𝑖) is the number of shortest paths from nodes j to k through node i, and 𝑔𝑗𝑘 is the total number of shortest paths between j and k.
𝐵𝑖 = ∑ ∑ 𝑔𝑗𝑘(𝑖) 𝑔𝑗𝑘 𝑗−1 𝑘=1 𝑛 𝑗=1 (2.5)
18 Nodes with the highest betweenness centrality in a network are often called bottlenecks, represented in Figure 2.2, and because most of the shortest paths go through these nodes, they are the central points controlling the communication between other nodes in the network [12]. Additionally, in Figure 2.2, it is also represented a bridge by the link between the two bottleneck nodes, a connection that if removed disconnects the network forming two subnetworks or components.
• Clustering coefficient – measures the link density of the neighborhood of a node i, computed by equation 2.6, where 𝐿𝑖 is the number of links between the 𝑘𝑖 neighbors of node i. The value of 𝐶𝑖 varies between 0, if none of the neighbors is linked to each other, to 1, if all the neighbors are connected to each other forming a complete graph.
𝐶𝑖 = 2𝐿𝑖
𝑘𝑖(𝑘𝑖−1) (2.6)
As previously mentioned, random graphs are commonly used to model real complex networks, con-traposing the previous use of regular graphs, however it is intuitive that real complex networks are gov-erned by organizing principles underlying their seemingly random topology. This deviation can be ob-served in the degree distribution of most real networks, that can be better approximated by a power law distribution (equation 2.7, where the exponent γ it’s called the degree exponent), instead of the Poisson distribution obtained with true random networks. Networks with this propriety are called scale-free net-works and are characterized by having many small-degree nodes and a small number of hubs with very large number of links (scale-free means that it doesn’t exist a typical node in the network that can be used to characterize the common node scale, contrary to random networks in which the majority of the nodes have similar degree around the average degree). The scale-free property observed in the topology of several networks, such as the World Wide Web, the Internet and metabolic networks, suggests a universal organizing principle underlying the construction and growth of real networks [13]. Under-standing the topology of real networks is essential to be able modulate its growth and robustness.
𝑝𝑘 ~ 𝑘−𝛾 (2.7)
Figure 2.2- Representation of bottlenecks and hubs controlling the flow and communication between different network regions. Adapted from [12].
19
2.2 Network biology
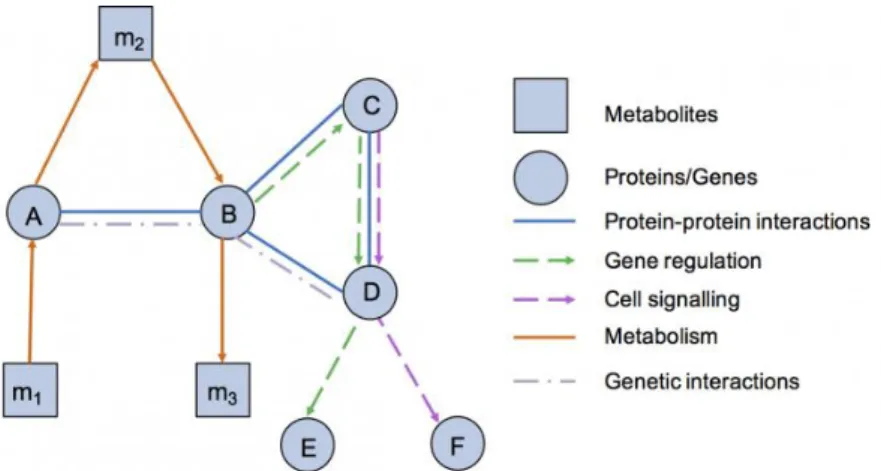
The conjoint recent developments in network theory, high-throughput data-collection techniques, data mining and bioinformatic approaches accelerated the growth of genomic, transcriptomic, proteomic and metabolomic datasets, and provided the means to map and analyze large-scale molecular interaction data in different contexts such as time, cell states, tissues, or organisms [1]. The field of network biology emerged then, with the aim to study the behavior of cellular networks and understand how the structure and dynamics of the interactions contribute to the cellular function. To generate a coherent cellular behavior, several networks within the complex cellular network have to operate collectively, including protein-protein interactions, metabolic, signaling and transcription-regulatory networks (represented in Figure 2.3). Undirected networks can be physical interaction networks, including binding interactions between proteins, between proteins and DNA or RNA, or functional networks where links represent statistical dependencies between nodes, like functional relationships or similarities. Directed networks have regulatory or signaling type of interactions and can include transcription-regulatory networks, with interactions between regulatory proteins like transcription factors and their gene targets whose expression they regulate, signaling networks, representing cascades of post-translational modifications connecting signaling receptors to transcription factors or metabolic networks, linking metabolites that interact through enzyme-catalyzed biochemical reactions, that also interact with transcriptional networks to control several biological functions [14].
This work will focus on protein-protein interaction (PPI) networks and regulatory networks, including signaling and transcription-regulatory interactions. The generation of protein-protein interaction data has accelerated with the development of highthroughput methods, such as the yeast two-hybrid system for mapping binary interactions and affinity purification plus mass spectrometry
identification for mapping protein complexes. Annotation, cataloguing and mapping efforts have been made in the last years in order to construct large networks of protein interactions [15]. Several databases exist containing information about protein interactions derived from different sources, including the Biological General Repository for Interaction Datasets (BioGRID) [4] and the Human Protein Reference Database (HPRD)[3] that contain experimentally verified interactions, a Search Tool for Retrieval of Interacting Genes/Proteins (STRING) [5] and the Human Protein Interaction Database (HPID) [16] containing both experimentally verified and computationally predicted interactions, and a set of visualization and analysis tools to explore networks. Manually curated sources of scientific literature have higher quality data, however, due to the monetary and time cost of this task, the size of the datasets tends to be limited. Adding other sources can help broaden the size of the data sets, but with the cost of having more noise. Interaction data sets are consequently noisy and incomplete [17].
20 Large-scale mapping of transcription-regulatory networks or gene regulatory networks is mainly obtained with yeast one hybrid approaches, that use known or suspected regulatory DNA regions to capture transcription factors that bind to that sequence, or chromatin immunoprecipitation approaches, that use antibodies against potential transcription factors to immunoprecipitate interacting DNA fragments corresponding to regulatory regions [15]. Gene regulation data can be found in databases such as the TRANScription FACtor database (TRANSFAC) [18] and the Transcriptional Regulatory Element Database (TRED) [19] with manually curated data, and the Signaling Pathway Integrated Knowledge Engine (SPIKE) [20] a tool for integration, visualization and interpretation of several types of regulatory data, including signaling pathways. Another resource for signaling pathways is OmniPath [21], with literature curated interactions from 34 sources with activity flow, enzyme-substrate, undirected interactions and biochemical reactions data.
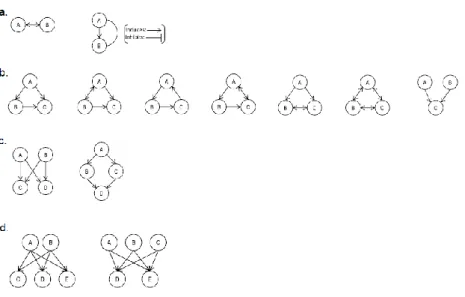
As mentioned previously, several complex networks have been shown to be governed by the same universal organizing laws, reinforcing the importance of the intricate interaction patterns within molecular networks to understand the cell as a system, over the analysis of just individual molecules. Similar to the internet or social networks, most networks within the cell are scale-free [1]. This property was observed in several metabolic networks of different organisms, where most substrates react with only one or two other substrates and a few behave as metabolic hubs being able to participate in dozens of reactions. The same topology was also observed in networks of physical interactions between proteins of several eukaryotic species and in the outgoing degree distribution of transcription regulatory networks of S. cerevisiae and Escherichia coli, indicating that there are only a few general transcription factors that regulate may genes. The incoming degree distribution, however, had exponential characteristics with most of the genes being regulated by one to three transcription factors. Another property arises in scale-free networks owing to the presence of hubs, the small-world effect, where any two nodes in a large network can be connected with only a few links, giving cellular networks the property of a very short average path length. In terms of link density, cellular networks tend to have high clustering, with the presence of subgraphs of highly interlinked groups of nodes. Subgraphs that are overrepresented when compared to randomized networks are called motifs, patterns that occur in specific types of cellular networks that can have an essential role in processing information and maintaining homeostasis. Borotkanics and Lehmann [22] identified in their study 13 recurring motifs across several species in transcription-regulatory and protein-protein interaction networks, represented in Figure 2.4. Triangular motifs are very common presenting in cellular networks through different types of interactions, as in the case of feedforward loops (first motif in Figure 2.4b) that occur in both transcription-regulatory and neural networks [1].
21 Modularity seems to be a universal design principle in biological systems, including cellular networks, where modules of highly interconnected nodes, whether of physical or functional interactions, are often correlated with a cellular function, constituting functional modules that interact with each other and frequently overlap to carry out biological processes. All the previously described proprieties of cellular networks are essential for the robustness of the network to external or internal changes. Scale-free networks are resilient against random failures, maintaining a well-connected cluster of nodes even if a high percentage of random nodes fail, thanks to the role of hubs that maintain the majority of connections and the networks integrity [1]. However, if an attack is focused on hubs, the removal of only a few will break the network in several non-connected groups of nodes. The survival of a cell to a perturbation is consequently dependent of hub-molecules, but it also depends on the specific biological function of the molecule and if it can be carried out by other molecules with an identical role (genetic redundancy). The modularity of these networks also contributes to limit the propagation of the perturbation to other weakly linked modules. It is evident that the structure, topology, robustness and biological function are intertwined confirming the importance of a system-level understanding of cellular mechanisms [1].
The identification of functional modules and analysis of its topological properties also helps to elucidate the modules that are altered in pathological processes and help to develop targeted therapeutics, whether to individual molecules or to rewire the affected disease module. The study of the role of networks in human disease is the aim of the related field of network medicine.
Figure 2.4-- Recurring network motifs found across species in transcription-regulatory and protein-protein interaction networks identified in Borotkanics and Lehmann (2015). a- Two-node motifs with a two-way interaction and mixed feedback
loop. b-Three-node motifs with feed forward loops, co-regulation, cycles and cliques. c-Four-node motifs with a bifan and diamond pattern. d- Five-node motifs with overlapping layers of regulators. Nodes can represent a gene or its protein product, bidirected edges represent protein-protein interactions and directed edges represent regulatory interactions. Adapted from [22].
22
2.3 Network medicine
A disease phenotype is rarely a consequence of an abnormality in a single gene, but instead the reflection of this perturbation spreading along the links of the cellular network and altering the activity of pathways [23][24]. Through the analysis of these complex networks in which thousands of interactions can be altered in a disease state, is then possible to uncover how the interconnectivity between cellular components and between functional modules explain the disease phenotype. The evolution of network medicine was able to provide insights into the properties of cellular networks that link network topology to biological function and disease. One of the most important characteristics found was that genes that are associated with a specific disease phenotype have a significantly increased tendency to interact directly with each other and when mapped onto the protein-protein interaction network tend to co-localize in a well-defined neighborhood, forming modules of functionally related genes (or proteins), also referred to as “disease modules” [23][8]. The genes that constitute the module, called disease-associated genes (hereafter referred as DGs), contribute together to cellular functions underlying the disease phenotype. It can be inferred that diseases with phenotypic similarity and comorbidity share pathomechanisms and consequently also share disease genes, that will be in the overlap between disease modules in the human PPI network [24]. Several studies have observed this property: Menche et al. [25] suggested a correlation between the distance between disease modules in the PPI network with their phenotypic similarity; Xu, Li and Wang [26] observed that the number of shared genes increases directly with the number of shared phenotypes between diseases and Goh et al. [8], through the construction of a “diseasome” with links between an extensive list of disorders and disease genes, also revealed a common genetic origin of many diseases (illustrated in Figure 2.5).
Figure 2.5- Diseasome network scheme from Goh et al. [8]. Example with a subset of disease-gene associations from OMIM
[101].Circle correspond to disorders, rectangles correspond to associated gene mutations, the size of the nodes is proportional to the number of genes associated to the corresponding disease and the color corresponds to disease classes. In the Human Disease Network diseases with common genes are linked and in the Disease Gene Network genes are connected if they are involved in the same disorder. Adapted from [8].
23 The same study showed that essential human genes are encoded by hub proteins and are expressed in most tissues, making them less common as disease genes, due to the lethality associated with mutations in these housekeeping genes. This observation was also corroborated in a study by Feldman, Rzhetsky and Vitkup [27], defending that most disease genes are nonessential and tend to have intermediate connectivity in PPI networks. Beyond the analysis of PPI networks to identify groups of proteins with modular biological activities that might be compromised in a disease state, regulatory networks can also be used to study how these modules and other cellular elements are regulated and coordinated and to help identify changes in up-stream regulatory mechanisms that can similarly cause the identified functional failures[28][29].
Many common diseases are complex or multifactorial, caused by a combination of genetic, environmental and lifestyle factors, involving several genes that can be classified as causal, as modifiers of the disease phenotype, or as phenotypic, genes affected by the perturbations but unable to influence the disease course [9]. A complex disease phenotype is the result of multiple pathomechanisms and therefore, a drug targeting only one mechanism may not be effective in all clinical cases. Network-based strategies offer a simple and intuitive systems view of the cellular function that can help to elucidate these complex relationships between pathomechanisms.
Network disease module approaches have been successfully used in several studies to predict disease progression and outcome, and also for drug-discovery [24]. The current challenge is that interatomic maps are still incomplete, and the number of disease genes known is limited [25]. Methods that help to predict new disease genes and add information to disease modules can contribute not only to understand the molecular mechanisms behind complex diseases, but also to the development of more effective therapeutic strategies. The next chapter will review existing network-based gene prioritization methodologies that aim to uncover new disease-gene associations.
24
Capítulo 3 STATE OF THE ART
3.1 Introduction
Currently the most frequently employed approaches to identify genes involved in complex disorders are genome-wide techniques, such as linkage analysis and genome-wide association studies, that can identify the chromosomal region in which unknown disease-associated genes are located, however the regions can containing up to 300 candidate genes [30], making the experimental validation time consuming and expensive. Additionally, these highthroughput analyses often require large clinical sample sizes to have statistically significant results, which can be difficult to obtain for certain diseases, such as neurodegenerative disorders. Therefore, several computational approaches were developed to aid the prediction of novel DG candidates and prioritization of the most promising ones for experimental follow-up studies. Gene prioritization methods differ in the type and number of data sources used (such as biomedical literature, gene expression data, functional annotations, and interaction networks), the prior knowledge about the DGs, the data representation, or the prediction/prioritization functions, however, the majority uses the guilty-by-association principle identifying and prioritizing candidate genes based on their topological or functional similarity (correlated expression profiles, protein interactions or participation in the same biological processes) to known DGs [31][32].
The advantage of using interaction data, in particular protein interactions, in the form of networks is the possibility to use both functional and topological information to identify candidates, by evoking the principle that genes related to the same or similar disease phenotype tend to be located in a specific neighborhood in the PPI network, which means that if a few DGs are known, other genes found in their network-based vicinity most likely share the same biological functions and are associated with the disease. Several diverse network-based approaches to identify and prioritize new disease-gene associations exist, but the basic process is the same: a gene-set already known to be associated with the disease is provided (seeds), based on the similarity to the known DGs the candidate genes are ranked according to their likelihood of being associated with the disease, candidate sets are validated by, for example, comparing biological functions or expression patterns with the DGs, and finally only the top-ranked candidates are then experimentally tested [33] (process exemplified in Figure 3.1).
Several studies have shown the utility and effectiveness of network-based approaches to identify disease markers and disease modules of several disorders, including cancer, neurological diseases, cardiovascular diseases, systemic inflammation, obesity, asthma, type 2 diabetes and chronic fatigue syndrome (listed in [23] and [34]). Although the results of computational methods are important to understand the molecular mechanisms behind diseases, the predicted candidates will posteriorly need supporting experimental evidence to produce valid and interpretable findings.
25
3.2 Network-based approaches to disease-gene prediction
Many network-based approaches that have been developed, aiming to recover the complete disease modules, or rank candidate genes based on their distance to the seed genes. Because these methods have as input known DGs and interaction networks, they are susceptible to missing and false interactions in the network and the quality of the seed associations, however as more molecular interaction data becomes available, it is expected that network-based prediction and prioritization methods will become even more accurate.
The majority of the algorithms use either local network information, that ignores potential effects from distant nodes, using measures such as direct neighbor, shortest path, and degree of a node, or global network information, that analyses the whole network topology including long-range protein interactions, using measures such as network centrality, random walk with restart, topological similarity or connectivity significance [35][33]. The mentioned measures are summarized in Table 3.1.
Several studies demonstrated that global network measures achieve better results in comparison to local measures [35][30][33]. Global centrality measures have been used for many years to evaluate how important individual nodes are for the network connectivity. In the context of prioritization, Dezső et al. [36] applied an adapted version of shortest path betweenness to prioritize candidates in a protein–protein interaction network. In this algorithm, a shortest path network connecting known disease proteins (seeds) is built and the number of shortest paths traversing each node is compared to the total number of paths going through the same node in the global network. A candidate protein is scored more relevant to the disease of interest if it lies on significantly more shortest paths connecting seeds than other nodes in the network. Other widely used methods that also capture the global structure of the interaction network are network propagation or diffusion based approaches, such as random walk with restart and diffusion-kernel method [30][7].
26
Table 3.1- Network-based measures used for disease gene identification and prioritization. Papers that explain or use the
measure or similar variants are referenced. Based in Gill et al. (2014) [33].
Local measures
Direct neighbor Nodes adjacent to seed nodes. [37][38][39][40] Shortest distance Minimum number of edges between the candidate node
and the seed node. [41]
Degree of a node Number of edges linked to a node. [42] Global measures
Centrality measures
Eigen vector centrality
A weighted version of the degree centrality: measures the centrality of a node on the basis of not only quantity of edges but also if they link to other nodes with many links. A node is important if it is linked to other important nodes.
[43]
Closeness
Based on how close the node is to other nodes in the network; computed as the inverse of the sum of the distances of nodes from the query node.
[44][45]
Betweenness
Measures the control of the node over the information flow of the network; computed as the ratio of the number of shortest paths possible between a pair of nodes via the query node to the total number of shortest paths between the pair of nodes in question.
[36] [46]
Random walk
From given seed nodes, random walk is defined as a sequence of nodes selected at each step randomly from the neighbors of the current node. Nodes that are closest to the seeds and have more links to them will have a higher probability of being part of the random walk.
[7][30][47][48]
Topological similarity
Measured as the similarity of the relative location of the candidate and seed proteins with respect to other proteins in the network.
[49]
Connectivity significance
Disease proteins are prioritized, and the disease module is built around a set of known disease proteins using the interaction significance with seed proteins.
[50]
The random walk with restart method (RWR) follows a random walker in the network, starting from the seeds and moving randomly in each iteration to a neighbor node. In this version of random walk a fixed probability of restarting the walk in a seed node is added, as a reset parameter, to prevent the walker to reach all nodes of the network and confine the propagation to the local neighborhood, until it reaches a steady-state. In each step the state probability 𝑝𝑡+1 at a time t+1 is computed by equation 3.1.
𝑝𝑡+1= (1 − 𝑟)𝑊𝑝𝑡+ 𝑟𝑝0 (3.1)
W is the column-normalized adjacency matrix of the graph, which represents the network structure, 𝑝𝑡 is a vector with the state probability of being at node i at time step t, 𝑝0 a vector with the initial state probabilities constructed so the walker has equal probability of beginning from any of the seeds (1/m for the m seeds and 0 to the other nodes in the network). The iteration is performed until a steady-state is reached when the difference between two steps is smaller than a pre-defined cut-off.
27
The candidates are ranked according to the steady-state probabilities 𝑝𝑁 of the random walker reaching it. The diffusion-kernel method is similar to the random walk method, performing a different type of random walk using matrix exponentiation. Another propagation based-algorithm widely used is the PRIoritizatioN and Complex Elucidation (PRINCE) method proposed by Vanunu et al. [47], for prediction causal genes and protein complexes. This method however doesn’t need DGs of the disease of interest, as it combines disease similarity metrics with the PPI network, in order to score network neighbors of genes associated with the disease (if known) or associated with similar diseases. The method was applied to three multi-factorial diseases, prostate cancer, Alzheimer’s disease and non-insulin dependent type 2 diabetes mellitus, whose predictions are validated by known literature and also suggest new causal genes and protein complexes associated with the diseases.
DIAMOnD is a novel and successful Disease Module Detection algorithm, designed by Ghiassian, Menche and Barabási [50], to identify disease genes and disease modules around a set of known disease proteins, based on the connectivity patterns between them. This method exploits the significance of connections to seed proteins, calculating first, for so randomly scattered seed proteins, the probability
that a certain protein with a total of k links has exactly ks links to seed proteins through the
hypergeometric distribution p(k,ks). Using the cumulative probability of the observed or higher number
of connections, a connectivity p-value is calculated to evaluate whether a certain protein has more connections to seeds than expected, given by equation 3.2.
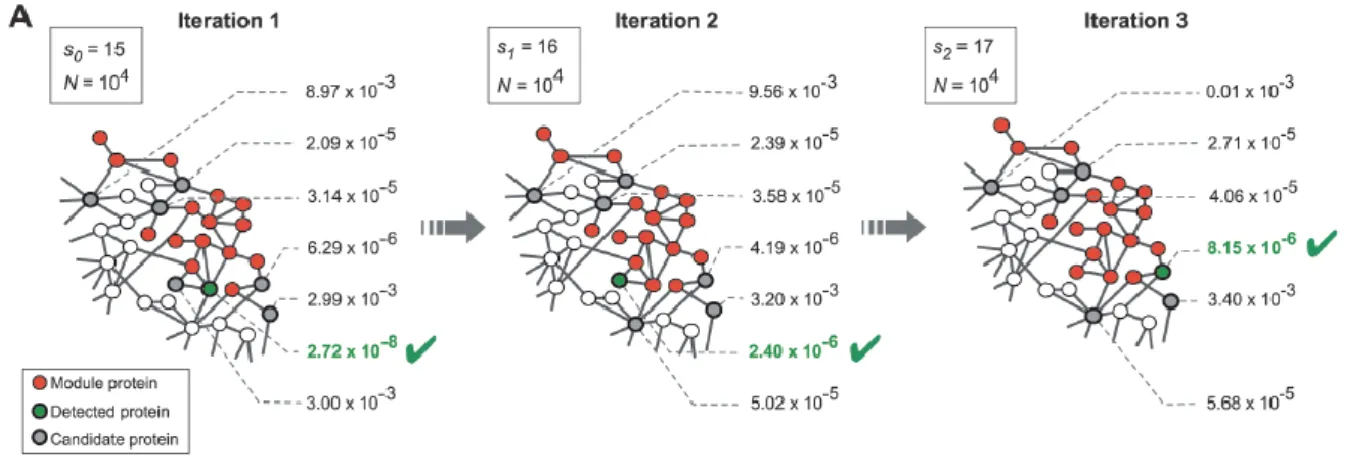
𝑝 − 𝑣𝑎𝑙𝑢𝑒(𝑘, 𝑘𝑠) = ∑𝑘𝑘𝑖=𝑘𝑠𝑝(𝑘, 𝑘𝑖) (3.2) The algorithm at each step determines the connectivity significance for all proteins connected to seed proteins, ranking them according to their p-values, and the protein with highest rank (lowest p-value) is added to the set of seeds (Figure 3.2). This process is repeated, increasing the set of seed proteins and growing the disease module each step, until the module spans across the entire network. The order in which the proteins were added to the module reflects their probability of being associated with a particular disease.
Figure 3.2- DIAMOnD algorithm. At each iteration the most significantly connected node, with lowest p-value, is added to the module. From [50].
28 The majority of network-based methods are applied to undirected biological networks using typically single molecular data such as mRNA co-expression or protein-protein interaction, mainly because it is vastly available, well annotated and catalogued. However, only using this type of data may not be suf-ficient or adequate for diseases with known association with pathological regulatory mechanisms, as in the case where transcription factors are causes of disease and aren’t differentially expressed in the dis-ease condition, but regulate the expression of other genes that are differentially expressed. The previ-ously presented measures/methods can be adapted to the directionality of the links in regulatory net-works, however the direction-related information in the interactions must also be accounted for, so the biological meaning isn’t lost. The studies of Zhang et al. [51] and Tran and Kwon [52] were able to use regulatory data for disease gene prediction without disregarding the direction-related information it con-tains. The study of Zhang et al. [51] presents a method for identification of disease-relevant genes that integrates gene expression data, functional data and gene regulatory data. The gene regulatory data was integrated with functional modules previously constructed in order to search for specific genes that would coordinate the communication between functional modules. The method was able to identify highly relevant subsets of genes to three types of cancer, prostate cancer, gastric cancer and leukemia. The study of Tran and Kwon [52] used the closeness measure to predict disease genes on a human signaling network, by adapting it to the specific structure of directed networks, outperforming other centrality measures in cancer, hereditary, immune, and neurodegenerative disease genes prediction.
Despite the increasing evidence of shared molecular mechanisms, shared disease genes and overlap-ping PPI disease modules between diseases with similar phenotypes, there are still very few network-based methods that aim to predict DGs simultaneously associated with related diseases. Two approaches were recently proposed [53] [54]. Silberberg et al. [53] proposes a GLobal Approach for DIsease Asso-ciaTed mOdule Reconstruction (GLADIATOR) for prediction of disease modules of multiple diseases simultaneously. This method doesn’t predict DGs directly but aims to reconstruct disease modules in a PPI network taking in consideration phenotypic similarity information of hundreds of diseases. It starts by identifying connected sets of known DGs (seeds) associated with several diseases and systematically expands the modules so that the final resulting sets of modules have a similarity as close to the pheno-typic similarity between the diseases, based on the principle that diseases with similar phenotype tend to share common pathomechanisms and share DGs. The expansion is performed with a simulated an-nealing algorithm by minimizing the squared distance between the disease similarity to the module sim-ilarity, according to equation 3.3, where the phenotypic similarity of each disease pair i and j (𝑃ℎ𝑒𝑛𝑆𝑖𝑚𝑖,𝑗) is based on the number of symptoms in common with both diseases and the module sim-ilarity (𝑀𝑜𝑑𝑢𝑙𝑒𝑆𝑖𝑚𝑖,𝑗) is based on the size of the intersection between the two modules.
min (∑𝑖<𝑗(𝑃ℎ𝑒𝑛𝑆𝑖𝑚𝑖,𝑗− 𝑀𝑜𝑑𝑢𝑙𝑒𝑆𝑖𝑚𝑖,𝑗)2) (3.3)
The results of GLADIATOR were compared with external data sources, confirming that the pre-dicted modules included known disease-gene association and were enriched in known biological path-ways. The method further showed to outperform previous state-of-the-art methods to predict disease modules, including DIAMOnD. The global approach also enables the prediction of shared proteins be-tween phenotypically similar diseases through the modules’ overlap, providing more information about the molecular mechanisms underlying the etiology and phenotype of diseases.
29 The method suggested by Akram and Liao [54] is similar to the previous method, by it is applied in only one disease pair. The aim is to predict missing common genes between two diseases known to have high comorbidity but unexpectedly have a high module separation, indicating missing shared genes. The detection of missing genes is performed by an optimization problem that finds, from the set of genes associated to both diseases, the gene that minimizes the module separation. The minimization can be applied sequentially to identify multiple common genes. The method was tested with 600 disease pairs and showed to have high prediction accuracy. Despite being only being tested with cross-validation, the method can be employed for prediction of missing genes that aren’t yet associated with the diseases but have an effect on the shared phenotype.
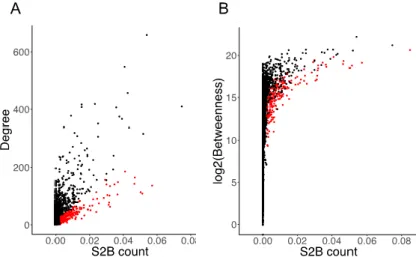
The two proposed methods, however, predict new shared genes between two diseases indirectly through the reconstruction of the disease modules. This modular approach of the diseases and the shared genes as the ones belonging to an overlap that is maximized for the whole set of DGs, can have the disadvantaged of disregarding different pathways within the disease modules that can lead to different cellular responses of the disease and possibly losing relevant information about the common molecular pathways. Both methods are also susceptible to select new genes only because they are central in the PPI network structure and therefore will mediate the connection between several modules, but don’t have a specific connection to both diseases’ genes. With a solution to these shortcomings, a method was proposed by Garcia-Vaquero et al. [9], on which this dissertation is based. The method called S2B (dou-ble specific-betweenness) aims to directly predict disease genes in simultaneously associated with two related diseases, by using a variant of the betweenness measure. The approach prioritizes genes that appear more frequently in shortest paths specifically linking DGs of both disease modules in PPI net-works, and that therefore have a higher specific betweenness. Due to the centrality of these genes rela-tively to the disease modules they are more likely to belong to the overlap. The method further guaran-tees that the candidate genes are specifically linked to both diseases, eliminating candidates with high specific betweenness centrality due to their central position in the network, by computing two specificity scores that evaluate the specificity of the candidates to the seeds used and to the pathways they appear in linking both disease modules (Figure 3.3 shows the correlation between the score given by the S2B method and two other centrality measures, degree and betweenness centrality, with candidates more specific to DGs of the two diseases marked in red, demonstrating that the top prioritized genes are not the ones with highest degree or betweenness in the network). The method and its results will be ex-plained in depth in the next section.
Figure 3.3- Correlation of S2B score with node degree and betweenness centrality. A- Correlation between node degree and
S2B score in a PPI network. B- Correlation between node betweenness and S2B score in a PPI network. Red dots represent proteins with specificity scores higher than a set high threshold, and black dots proteins with lower specificity to the method’s seeds. Adapted from [9].
30 Park et al. [46] proposed a similar approach to identify functional pathways linking disease genes, with a disease-causing role, to differentially expressed genes, postulated to reflect more the downstream effects of a disease mechanism, in protein interaction networks. To find these central pathways, a vari-ation of betweenness was also used, counting only shortest paths between disease genes and differen-tially expressed genes, and averaging the betweenness scores of a set of nodes to obtain the group cen-trality of the corresponding pathway. Three different pulmonary diseases were analysed separately, and common mediating mechanisms were found relating all three airway diseases. However, this method was developed to identify pathways, instead of individual disease genes, within a specific disease.
![Figure 2.1- Adjacency matrix of undirected and directed network. Adapted from [10].](https://thumb-eu.123doks.com/thumbv2/123dok_br/18583159.908226/16.892.269.621.581.978/figure-adjacency-matrix-undirected-directed-network-adapted.webp)