Modeling the Impact of White-Plague Coral
Disease in Climate Change Scenarios
Assaf Zvuloni1,2,3☯*, Yael Artzy-Randrup4☯*, Guy Katriel5☯, Yossi Loya2, Lewi Stone2,6
1Israel Nature and Parks Authority, Eilat, Israel,2Department of Zoology, Tel Aviv University, Ramat Aviv, Tel Aviv, Israel,3The H. Steinitz Marine Biology Laboratory, Eilat, Israel,4Institute for Biodiversity and Ecosystem Dynamics, University of Amsterdam, Amsterdam, The Netherlands,5Department of Mathematics, ORT Braude College, Karmiel, Israel,6School of Mathematical and Geospatial Sciences, RMIT University, Melbourne, Australia
☯These authors contributed equally to this work. *[email protected](AZ); [email protected](YAR)
Abstract
Coral reefs are in global decline, with coral diseases increasing both in prevalence and in space, a situation that is expected only to worsen as future thermal stressors increase. Through intense surveillance, we have collected a unique and highly resolved dataset from the coral reef of Eilat (Israel, Red Sea), that documents the spatiotemporal dynamics of a White Plague Disease (WPD) outbreak over the course of a full season. Based on modern statistical methodologies, we develop a novel spatial epidemiological model that uses a maximum-likelihood procedure to fit the data and assess the transmission pattern of WPD. We link the model to sea surface temperature (SST) and test the possible effect of increas-ing temperatures on disease dynamics. Our results reveal that the likelihood of a suscepti-ble coral to become infected is governed both by SST and by its spatial location relative to nearby infected corals. The model shows that the magnitude of WPD epidemics strongly depends on demographic circumstances; under one extreme, when recruitment is free-space regulated and coral density remains relatively constant, even an increase of only 0.5°C in SST can cause epidemics to double in magnitude. In reality, however, the spatial nature of transmission can effectively protect the community, restricting the magnitude of annual epidemics. This is because the probability of susceptible corals to become infected is negatively associated with coral density. Based on our findings, we expect that infectious diseases having a significant spatial component, such as Red-Sea WPD, will never lead to a complete destruction of the coral community under increased thermal stress. However, this also implies that signs of recovery of local coral communities may be misleading; indica-tive more of spatial dynamics than true rehabilitation of these communities. In contrast to earlier generic models, our approach captures dynamics of WPD both in space and time, accounting for the highly seasonal nature of annual WPD outbreaks.
OPEN ACCESS
Citation:Zvuloni A, Artzy-Randrup Y, Katriel G, Loya Y, Stone L (2015) Modeling the Impact of White-Plague Coral Disease in Climate Change Scenarios. PLoS Comput Biol 11(6): e1004151. doi:10.1371/ journal.pcbi.1004151
Editor:Stefano Allesina, University of Chicago, UNITED STATES
Received:July 2, 2014
Accepted:January 20, 2015
Published:June 18, 2015
Copyright:© 2015 Zvuloni et al. This is an open access article distributed under the terms of the Creative Commons Attribution License, which permits unrestricted use, distribution, and reproduction in any medium, provided the original author and source are credited.
Data Availability Statement:All relevant data are within the paper and its Supporting Information files.
Funding:We received support from EU-FP7 grant EPIWORK and the Israel Science Foundation. The funders had no role in study design, data collection and analysis, decision to publish, or preparation of the manuscript.
Author Summary
Coral reefs are deteriorating at alarming rates, with coral disease outbreaks increasing in prevalence and in space. Anomalously high ocean temperatures are thought to significant-ly contribute to this problem. We collected a unique and highsignificant-ly resolved dataset of a White Plague Disease (WPD) outbreak from the coral reef of Eilat (Israel, Red Sea). By fit-ting a novel epidemiological model to the data, we characterize the dynamics of WPD, and study the possible effects of future increasing sea-surface temperatures (SST) on disease dynamics. In contrast to earlier studies, our approach captures the dynamics of coral dis-ease both in space and time, and accounts for the highly seasonal nature of the annual out-breaks. We also apply a novel combination of spatiotemporal statistics and null hypothesis approaches to study the disease progression. Model forecasts into the future show that for some scenarios even an increase of only 0.5°C in SST can cause epidemics to double in magnitude. Since the probability of infection is found to be negatively associated with coral density, this implies that the spatial nature of disease transmission can both enhance and restrict the magnitude of annual epidemics. The results have implications for design-ing management policies appropriate for coral reef conservation.
Introduction
Infectious diseases are recognized as important factors affecting community structure and dy-namics in scleractinian corals [1]. They can result in a significant reduction in live coral cover-age [2] and density [3], and in extreme cases are able to initiate coral-algal phase-shifts through mortality of key reef-building corals and consequent changes to the reef framework [2,4]. In the Caribbean, disease outbreaks are considered to be one of the primary causes of the acceler-ating destruction of the reefs [5–9].
Patterns of coral diseases in space and time are related to various environmental parameters [10]. Several studies have shown that disease prevalence and transmission rates are significantly associated with high water temperatures [11–16], high UV radiation [17], decline in water quality [18–22], vector and host densities [13,23–26], and intensity of coral bleaching [13,27– 32]. However, the relative contributions of various environmental factors to coral disease dy-namics are likely to be complicated and synergistic [33–35].
We are living in an era of rapidly changing climate [34,36], where anomalously high tem-peratures are becoming a significant environmental factor affecting the health and resilience of coral reefs [37]. Some coral diseases display inter-annual fluctuations, where intense epidemics are coincident with periods of anomalously high seawater temperatures [13,36,38–41]. In ad-dition, several coral diseases, such as black band (e.g., [15,16,22,42–44]), white plague (e.g., [45]), white syndrome [13,32], ulcerative white spots [46],aspergillosis[47] and white pox [48], display clear seasonal variations in their intensity, with higher prevalence, severity or pro-gression during summer months.
dynamics, due to the interplay of epidemiological variables (such as susceptibility and patterns of transmission in space and time; [34]). Therefore, when attempting to understand disease dy-namics, it is important to take into account both epidemiological and environmental variables.
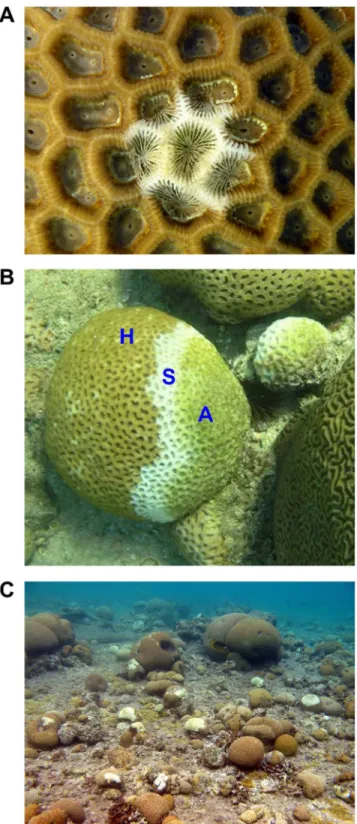
In this study we focus on white-plague disease (WPD; seeFig 1) in the Red Sea. Throughout the Caribbean and Western Atlantic, WPD is recognized as a destructive coral infectious bacte-rial disease [50,51] that affects a number of reef framework-building coral species [3,52–54]. Infected corals exhibit a rapid rate of tissue degradation of up to two centimeters per day and the existence of the disease on the reef results in a clumped distribution of infected individuals [50]. The Gram-negative bacteriumAurantimonas coralicidagen. nov. sp. nov. was identified as the causative agent of WPD in the Caribbean [55].
WPD has become commonly observed in the Red Sea since at least 2002 [52]. A sharp line between apparently healthy tissue and a thin zone of bleached tissue grading into exposed coral skeleton are the typical signs of the disease in this region (seeFig 1), similar to the signs ob-served in the Caribbean [50]. In contrast to the Caribbean, however, the causative agent in the Red Sea is known to beThalassomonas loyanasp. Nov. [56]. Aquarium experiments have shown that WPD in the Red Sea is an infectious disease [52,57]. However, the transmission pattern of the disease in natural coral communities has not been quantitatively studied, and to date there is no data regarding the local transmission mode of this disease within coral commu-nities. In addition, we do not know how the transmission strength of WPD varies in accor-dance to the season and what will be the future impact of the disease on coral communities under different climate change scenarios.
In order to address these questions, we collected a unique dataset that characterizes the dy-namics of WPD in space and time within a large pool of corals at the Eilat coral reef (Israel, Red Sea). The study extended between June 2006 until May 2007 with monthly samples that provided twelve spatial“snapshots”of the reef. The principal idea behind much of our model-ling rests on analyzing the evolving relationship between the number of Newly Infected Corals (NICs) found in a particular month to the number of Previously-Infected corals (PICs) found in the month before. A novel epidemiological model is developed, taking into account spatial, temporal and environmental parameters, which we find play a role in the transmission of WPD. The model is used to determine those factors which control the transmission of WPD through the coral population. In contrast to other recent efforts to model coral diseases (e.g., [49,58]), our model captures the dynamics of WPD in space and time, while also taking into account climate drivers and the highly seasonal nature of annual WPD outbreaks. The model characterizes the dynamics of the epidemic as it occurs in time. These features of the model prove to be of the greatest significance when predicting the future impact of coral diseases on local coral communities. Other modelling studies that we are aware of [e.g., 49,58] attempt to model the annual average numbers of infected corals, which is the coarsest of descriptions pos-sible when attempting to characterize an epidemic.
Study Site
Fig 1. Coral colonies from the genus Favia infected with WPD (white-plague disease). A) Initiation of WPD—a thin zone of bleached tissue grading into exposed coral skeleton.B) A sharp boundary between apparently healthy tissue (‘H’) and freshly exposed skeleton (‘S’), with no build-up of microorganisms or necrotic tissue visible to the eye. With time, the exposed skeleton becomes colonized by algae (‘A’).C) An aggregation of corals infected with WPD.
Field Sampling
A 10×10 m plot was surveyed once a month, from June 2006 until May 2007 providing twelve
“snapshots”in total. The size of the plot and the period of time between snapshots were based on a preliminary survey where we roughly assessed the clustering size of infected corals, and the development time of new infections. The four corners of the plot were marked in the field, and a grid made of ropes and elastic bands was placed on the plot dividing the plot to 100 sub-units of 1×1 m. Using photography (photoquadrats), all 2,747 susceptible corals within this area were mapped and an X-Y coordinate of the coral’s centre within the plot was allocated, fol-lowing the“center rules”of Zvuloniet al. [59]. Once a month, the grid was placed precisely on the same area and the locations of infected corals were recorded. Corals were classified in the field as infected if they showed typical signs of the disease—a sharp line between apparently healthy tissue and a thin zone of bleached tissue grading into exposed coral skeleton (Fig 1, [50]) and some level of progression (i.e., increased severity) relative to the previous snapshot. The Israel National Monitoring Program of the Gulf of Eilat provided continuous measure-ments of sea-surface temperature (SST),ca. 20 m away from the plot, as obtained from two temperature probes (Campbell Scientific, Temperature Probe Model 108; accuracy of ±0.1°C within the range of 20–30°C and resolution of 0.1°C).
Spatiotemporal Patterns of WPD
The 12 spatial snapshots of the reef-section were organized as eleven pairs of sequential snap-shots, where in each pair infected corals were partitioned into two groups:
1. Newly-Infected Corals (NICs)—those corals that had signs of infection in the current snap-shot, but not in the previous one.
2. Previously-Infected Corals (PICs)—those corals that were infected in the previous snapshot.
Our conjecture was that if inter-colonial transmission is significant for the spread of the dis-ease, NICs should develop in closer proximity to PICs than would be expected at random. To test this hypothesis, we developed a simple, but novel, spatiotemporal index, which is based on Ripley’sK-function [60,61]. While theK-function tests the spatial pattern of a single group of events, our spatiotemporal indexn(r) was designed to test the spatial relations between two groups of events, in this case two groups of infected corals—the NICs and the PICs. This index is defined as the mean number of NICs in a given month within a radiusrfrom a PIC of the previous month, and is calculated as:
nðrÞ ¼ 1
m
Xm
i¼1
Xk
j¼1
IrðdijÞ: ð1Þ
Here,mandkare the numbers of PICs and NICs, respectively, in the tested pair of sequential sampling dates,dijis the distance between any PICiand NICj. The indicator variableIr(dij) in-dicates whether or not NICjis located within radiusrfrom PICi. Thus,Ir(dij) receives a value of 1 ifdij<rand zero otherwise. In contrast to the nearest-neighbor approach used by Zvuloni
et al. [16] to identify whether NICs form aggregations in the vicinity of PICs, then(r) index also quantifies the spatial scale of aggregation, as it is calculated for a range of distancesr (simi-larly to Ripley’sKfunction; see Ripley [60,61]). Using a null model approach, which bases the null expectation on the spatial distribution of the entire pool of susceptible corals, we ascer-tained whether thekNICs found in thefield were significantly aggregated around the PICs (see
Spatiotemporal Epidemic Model
We model disease transmission by using a stochastic spatiotemporal model similar to Zvuloni
et al. [16], but with a new maximum-likelihood fitting procedure to estimate model parameters
from the field-data. The analysis that follows is based on the classical Susceptible-Infected-Sus-ceptible (SIS) model of epidemiology [62,63]. Corals are classified as either susceptible or in-fected. A susceptible coral can become infected when the disease is transmitted from a (usually) neighboring PIC, and an infected coral can return to be susceptible if the disease stops showing clinical signs. The model assumes transmission is via local waterborne infections (i.e., susceptible corals are infected by suspended infectious material originating from diseased corals within the study site). The assumptions underlying the construction of the model are that: (i) there is a higher probability that infection events take place in close proximity to exist-ing infections; and (ii) there is a cumulative impact of multiple infections on a sexist-ingle suscepti-ble coral, such that the more infected neighbors a susceptisuscepti-ble coral has, the more likely it is to become infected itself.
More specifically, the model determines the probability of each susceptible coral being in-fected and thus becoming a Newly Inin-fected Coral (NIC). The probability of being inin-fected by any Previously Infected Coral (PIC) within the study site is assumed to be inversely propor-tional to the distance (d) of the PIC. In addition, a susceptible coral can be infected by any of the PICs present. Thus, we define the probability of a corali(from all susceptible corals within the study site) to become infected during a montht(1t11; in total there are eleven sequen-tial sampling dates) as:
ptðiÞ ¼ct
X
j2PICt
1
da
ij
; ð2Þ
wherePICtis the set of all PICs in monthtanddijis the Euclidean distance between coral-iand PIC-j. The exponentαcharacterizes the decay of the transmission probability with distance. In
this way, infections are preferentially passed to neighboring susceptible corals. Another special feature of the model is the inclusion of seasonal drivers [64] through the constantsctthat char-acterize the transmission strength of WPD in each montht. These constants presumably de-pend on environmental factors that change in accordance to the season (e.g., seawater temperatures), and therefore may link between the spatiotemporal model and these factors. Note that all PICs within the study site influence the probability of any susceptible coral to be-come infected. The definition ensures the probability is inversely proportional to the coral’s distance from any PIC. In addition, the probability increases with the number of PICs and the increase will be largest for neighboring PICs (where the distancesdijare small).
Estimating the Best Fitting Parameters
Model parameters that need to be estimated are: (i) the exponentαthat characterizes the decay
of the transmission probability with distance, and (ii) the constantsctthat characterize the transmission strength in each montht. In order to find the best fitting parametersα,c1,. . .,c11,
we define a likelihood function and then maximize it with respect to these parameters. GivenPICt(the set of PICs in montht), the probability that the set of corals infected during this month is precisely the setNICtof NICs is:
pðNICtjPICt;a;ctÞ ¼ Y
i2NICt
ptðiÞ Y
i2=NICt[PICt ð1 p
tðiÞÞ: ð3Þ
and the second product is the probability that all the corals, which areneitherin the setNICt, nor in the setPICt, arenotinfected.
The total probability of obtaining the empirical results given the model, that is the likelihood function, is thus given by:
Lða;c1;. . .;c11Þ ¼
Y
11
t¼1
Y
i2NICt
ptðiÞ Y
i2=NICt[PICt ð1 p
tðiÞÞ
" #
; ð4Þ
and the log-likelihood is given by:
LLða;c1;. . .;c11Þ ¼
X
11t¼1
X
i2NICt
log ct
X
j2PICt
1 da ij 0 @ 1 Aþ
X
i=2NICt[PICt
log 1 c
t
X
j2PICt
1 da ij 0 @ 1 A 2 4 3
5 ð5Þ
The maximum-likelihood estimate for the parameters is obtained by maximizing the func-tion inEq 5. The procedure described below reduces the multi-variable optimization problem to a series of one-dimensional problems. We note that since each of the variablesctappears in only one of the summands, we find that:
maxa;c1;...;c11LLð
a;c1;. . .;c11Þ ¼max
aMðaÞ ð6Þ
where:
MðaÞ ¼
X
11
t¼1
maxct X
i2NICt
log ct X
j2PICt
1
da
ij !
þ X
i2=NICt[PICt
log 1 c
t X
j2PICt
1
da
ij !
" #
: ð7Þ
The profile likelihood functionM(α) is the maximum ofLLwith respect toc1,. . .,c11with a fixedα. In order to maximizeLL, we proceed as follows in our numerical algorithm:
1. We stepαincrementally through a certain interval in small steps. For each of theαvalues
we run overtfrom 1 to 11 (the number of pairs of sequential sampling dates), and for each of the values oftwe numerically findct=ct(α) that maximizes:
~
Mtða;ctÞ ¼ X
i2NICt
log ct X
j2PICt
1
da
ij !
þ X
i2=NICt[PICt
log 1 c
t X
j2PICt
1
da
ij !
: ð8Þ
2. We use these eleven values to obtain:
MðaÞ ¼
X
11
t¼1
~
Mtða;ctðaÞÞ: ð9Þ
3. We then find the valuea^for whichM(α) is maximal. The maximum likelihood estimate
for the parameters is thenða^;c1ð^aÞ;. . .;c11ða^ÞÞ.
Model Validation and Null Hypothesis Approach
1. The number of NICs observed in the field (k) in each month was compared to the distribu-tion of the simulated number of NICs generated from 1,000 model realizadistribu-tions using the best-fitting parametersα,c1,. . .,c11.
2. The model fit was tested by comparing the spatiotemporal indexn(r) (Eq 1) calculated for the actual data with that generated by repeated model realizations usingEq 2.
For further details seeMaterial and Methods.
Predicting the Future Impact of Coral Diseases
We link the model to seawater temperatures and test possible effect of increasing temperatures on disease dynamics. By controlling the temperature we can test different climate change sce-narios. Our model differs from the usual mean-field SIS models in which susceptible individu-als and infectives mix randomly and in a uniform manner; here an explicit spatial component is incorporated through the use ofEq 2. For all future projections, we use the last month of the real data as initial conditions. Then, at each monthly time step, the susceptible corals that be-come infected over the coral network are stochastically determined according toEq 2, given the spatial compositions of the sampled community. The computations keep track of which of all the corals become infected and which remain susceptible. Two different demographic as-sumptions were applied in the simulations—(i) constant influx of recruits, and (ii) free-space regulation of recruitment (seeMaterial and Methods).
Results
In total, 2,747 susceptible corals were observed and mapped within the surveyed 10×10 m plot. 85% of the corals belonged to the genusFavia, 14.3%Platygyra, 0.6%Favitesand 0.1% Gonias-trea. The coral community is extremely dense (>50 corals/m2) and mostly composed of rela-tively small massive corals (seeS1 Fig), many of which are susceptible to infection by WPD. The cumulative number of corals infected with WPD within the studied year, from June 2006 until May 2007, was 120 (ca. 4.4% of the susceptible corals). Among these corals, 64 (53.3%) died, 44 (36.7%) survived (i.e., some level of partial mortality was caused, but the disease stopped showing any clinical signs and progression) and 12 (10%) remain infected until the end of the survey. Bleached colonies were not observed on this reef and Black Band Disease (BBD) was observed at relatively low prevalence [<0.8%; see Zvuloniet al. [16]].
Spatiotemporal Pattern of WPD
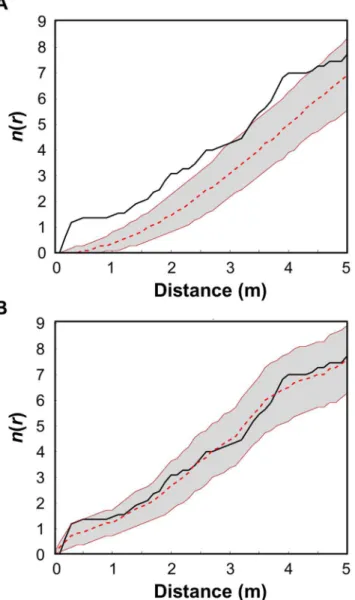
Based on our analysis with the sptiotemporal index n(r) (eq 1), we found that in all cases Newly-Infected Corals (NICs) appeared to form aggregations around Previously-Infected Cor-als (PICs) over distance scales of up to 4.5 m (see e.g.,Fig 2Afor June-July 2006, andS2a Fig
for all eleven sequential snapshots). This is because the index n(r) of the observed data sits al-most always above the Monte Carlo 95% CI envelope generated by the null test (seeMaterials and Methods). That is, in all cases the hypothesis that the NICs were infected by a random pro-cess of disease transmission, independent of the spatial location of the PICs, was rejected. InS3 Figwe provide spatial illustrations of the disease dynamics over the studied year showing the spatial relation between PICs and NICs.
The Best-Fitting Model Parameters
Using the maximum likelihood fitting procedure, the best-fitting exponentα, which inEq 2
The maximum-likelihood estimates for the best-fitting parametersct, constants that express the transmission strength of the disease during montht(c1,. . .,c11) and presumably depend
on environmental factors, are given inS1 Table.
Validity of the Spatiotemporal Model
For all pairs of sequential sampling dates, the number of NICs observed in the field (k) was within the 95% confidence interval (CI) envelope of the simulated number of NICs obtained
from the model realizations (Fig 4). We thus could not reject the hypothesis that the observed NICs were produced according toEq 2. (Note that here we are essentially testing the model’s
“goodness of fit”to the data, and thus there is no need to use the first half of the time series to predict the second half.)
Additional support for the validity of the spatiotemporal model is that in nearly all cases the observedn(r) was purely within the null expectation of the model for all distance scalesr(e.g.,
Fig 2B). However, in a few cases the observedn(r) was found to be greater than the upper bound of the 95% CI envelope generated by the model realizations for certain distance scales (see, for example, August-September 2006 inS2b Fig).
Seasonal Patterns and the Epidemic Potential of WPD
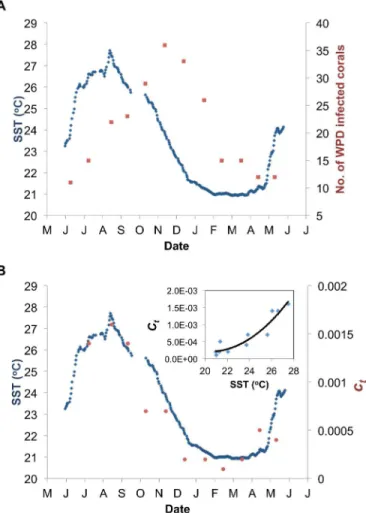
The number of infected corals observed within the study site ranged from a low of 11 infected corals during June 2006 to a peak of up to 36 infected corals in November 2006 (Fig 5A). The
Fig 3. Profile likelihood functionM(α).The function is maximized atα^= 1.9, giving the estimate of
parameterα. The insert shows a close up of the 95% CI ofα(represented by the red horizontal line). doi:10.1371/journal.pcbi.1004151.g003
Fig 4. Number of newly-infected corals (NICs).The red dots represent the number of NICs observed in the field along the studied year. The grey dots represent the median number of NICs as predicted by generating infections according to the SIS epidemic model based onEq 2(see text), and the grey bars represent their 95% confidence interval.
disease prevalence laggedca. 3 months behind the sea surface temperature (SST) that reached its seasonal peak of 27.7°C at the end of August 2006. On the other hand, we found a high asso-ciation between SST andct(seeFig 5B; Adjustedr2= 0.88, goodness of fit is SSE: 3.02e-07, RMSE: 0.0001943), which is expressed by the polynomial relationship:
ct¼p1SST
2
þp2SSTþp3 ð10Þ
having coefficients [with 95% CI]:p1= 2.968e-05 [-6.95e-06, 6.631e-05],p2= -0.001216 [-0.002972, 0.0005402] andp3= 0.01267 [-0.008197, 0.03353].
We calculated the epidemiological reproductive numberR0[65] for the time period between June and August 2006, when the cumulative incidence of infections grows approximately expo-nentially with time (seeMaterial and Methods). The result shows that the development of the disease within the coral community resulted in an epidemic-like growth withR0= 1.2 (r= 0.35;
TG= 0.53).
Fig 5. Seasonal pattern of WPD. A)Number of corals infected with white-plague disease (WPD) within the studied plot (red squares), andB)the estimated parametersct(red circles) which express the transmission strength of the disease (seeEq 2), as opposed to sea-surface temperature (SST; 7 days running average; blue line) starting from June 2006 to May 2007. Polynomial regression betweenctand SST is shown in the insert.
Long-Term Impact of WPD and Implications of Climate Change
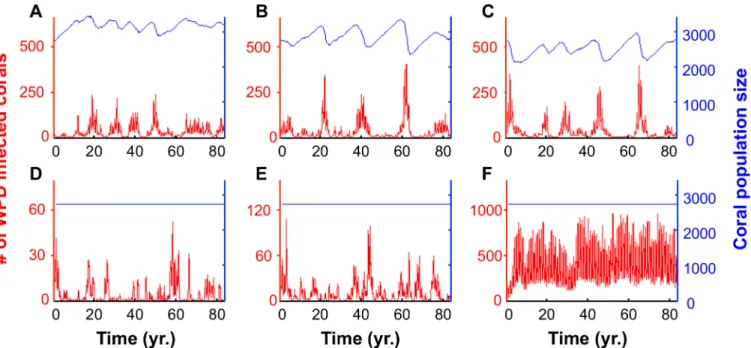
The unexpected high association found between SST and the transmission strengthctof WPD (Adj.r2= 0.88; seeFig 5B) extracted from fitting the spatiotemporal model to the data allows us to assess the potential long term impact of WPD on the local coral community under differ-ent climate change scenarios. We first examine model projections assuming that there is no cli-mate change and that the seasonal cycle of SST temperature repeats in exactly the same way from year to year. Projections of the disease 80 years into the future under these conditions (seeMaterial and Methods) show seasonally driven annual cycles (Fig6Aand6D). Indeed, each year the transmission strength of the disease increases as SST rises from March to August, and then rapidly decreases from September to February (Fig 5B).
We then considered the impact of a general mean increase in SST assuming a scenario of constant influx of recruits (“recruitment limited”).Fig 6Bshows the effects of increasing SST by 0.5°C whileFig 6Cshows the effect of only a 1°C increase. We find multi-annual cycles, in which severe epidemics take place every few years when the density of susceptibles corals build up to relatively high levels (Fig6A,6Band6C). The intensity of these epidemics increases with increasing SST, but their frequency is still restricted by the rate at which corals are replenished. The same simulations were examined under an assumption that the coral community is gov-erned by space limitation and is thus“free-space regulated,”or dependent on the level of free substrate available in the local patch. This follows from the hypothesis that space is a limiting re-source in many marine benthic populations [66–69]. Fig6D,6Eand6Fshow that under a sce-nario of free-space regulation of recruitment, a mean increase of only 0.5°C can cause epidemics to double in size, while a mean rise of 1°C can cause increases scaling in orders of magnitude.
Fig 6. Simulated future projections of the local coral community spanning 80 years.The future projections in panelsA,BandCrely on the
demographic scenario of constant influx of recruits (64 recruits per year). PanelsD,EandFrely on the scenario of free-space regulation of recruitment (see
Material and Methods). PanelsAandDare based on the SST time-series measured between June 2006 and May 2007 recurrently from year to year in the corresponding months. Based on this time-series, we generate future projections by adding 0.5°C (panelsBandE) and 1°C (panelsCandF) to the SST of each month. In these simulations we allow each new recruit to settle randomly anywhere on the 10×10 m plane.S4 Figdemonstrates robustness of these patterns under mild parameter variations.
Finally, we point out that these model“forecasts”should not be viewed as accurate predic-tions of monthly changes but more as qualitative guidelines as to what might be expected should there be a future long-term trend in SST temperatures. This corresponds to the“ strate-gic”approach suggested by May [70], which“sacrifices precision in an effort to grasp at general principles. Such general models, even though they do not correspond in detail. . .provide a conceptual framework for discussion and further exploration”.
Discussion
Our work offers the very first model fit of any coral disease epidemic, over the timescale of the epidemic, to be found in the literature. Other attempts failed to succeed either because they did not have the fine resolution data (e.g., 12 monthly sampling points) over the timespan of the epidemic, and/or because they did not have a modelling formulations to conduct parameter es-timates and model fits. At best other modelling attempts have only taken into account the total annual numbers of infected corals, which is the coarsest of descriptors when characterizing epidemic dynamics.
In the beginning of the transmission season, the spread of the disease in the local communi-ty exhibited epidemic-like growth motivating us to studyR0,the epidemiological reproductive number.R0was estimated (seeMaterial and Methods) for the time period between June and August 2006 (the development period of the disease within the community) and was found to be greater than unity (R0= 1.2;r= 0.35,TG= 0.53). This value ofR0was lower than these calcu-lated for BBD for the outbreaks of 2006 and 2007 (R0= 1.6 and 1.7, respectively; [16]). In BBD, both the exponential growth rate (r) and the mean generation interval of the epidemic (TG) were greater than these calculated for WPD. Although the observed seasonal outbreak generat-ed an epidemic-like growth, the disease did not spread over a large fraction of the susceptible corals (seeFig 5). Our model simulations suggest that seasonality and lowR0are not the only factors responsible for this restriction in disease spread, and in particular, that the spatial com-ponent of the system may also play a significant role.
The spatial scale of aggregations of NICs in the vicinity of existing infected corals indicates that small-scale inter-colonial transmission is significant within the community under study (see Figs2andS2). That is, infected corals are‘hotspots’of potentially infectious material, being transmitted to nearby susceptible corals on the reef (seeS3 Fig). We find that the larger the number of infected corals in proximity to a susceptible coral, and the closer they are, the higher the likelihood of this coral becoming infected itself. Similar results were found in previ-ous studies for WPD in the Florida Keys [50], for BBD in the Red Sea [16] and foraspergillosis
in the Caribbean [71].
for horizontal transmission of White Syndrome between corals across the Great Barrier Reef in Australia.
Testing the goodness of fit of our spatiotemporal model (Eq 2) in two different ways [e.g., distribution of NICs and clustering indexn(r)] reveals that in all cases the model could effec-tively predict the number of NICs and in nearly all cases it could simulate the actual spatial pat-terns of new infections. However, in a few cases the observedn(r) was found to be greater than the upper bound of the 95% CI envelope generated by the model realizations for certain dis-tance scales. These deviations suggest that there may be mechanisms involved in the transmis-sion process that are not fully captured by our simple model. However, by comparing the results obtained from the random simulated infections (S2a Fig) and those obtained from the spatiotemporal model (alongside withS2b Fig), it is clear that the spatiotemporal model always outperformed the random transmission model.
The unexpectedly high association found between SST and the transmission strengthctof WPD (Adj.r2= 0.88; seeFig 5B) extracted from fitting the model to the data indicates the power of the modeling approach. This association strongly suggests that SST is the seasonal driver behind the WPD dynamics, and might well be explained by the response of the host and/or pathogen to seasonal thermal fluctuations. High seawater temperatures may cause stress to coral hosts and increase their susceptibility to disease infections [73], while at the same time they may increase the virulence of the pathogen [74]. Previous studies from other lo-cations have also identified clear seasonal patterns of various coral diseases, such as white syn-drome [13,32], BBD [15,22], ulcerative white spots [46],aspergillosis[47] and white pox [48], related particularly to warm seawater temperatures. In this study, the seasonal patterns of the transmission strength of WPD (ct) preceded the seasonal patterns of the disease prevalence by
ca. three months (seeFig 5Bvs.Fig 5A, respectively). This suggests that the high seawater tem-peratures may directly affect the susceptibility of the corals and/or the virulence of the patho-gen, but indirectly affect the prevalence of WPD. That is, the impact of the disease on the reef might be the lagged response (ca. three months) to processes that advance the progression of the disease within and among coral colonies.
The strong coupling of the transmission strength of the disease (measured byct) and the seasonal variation in SST, forms the basis for our forecasts of future global warming scenarios. The association suggests that the higher seawater temperatures associated with future global warming will intensify the impacts of WPD on reefs. Our future predictions verify that in a de-mographic scenario, when recruitment is purely free-space regulated, such that the coral com-munity density is relatively constant in steady-state conditions, a mean increase of only 0.5°C can cause epidemics to double in size. Likewise, a mean rise of 1°C can even lead to increases in several orders of magnitude. However, in reality, the influx of recruits is likely to be limited to some extent and located along a continuum between the two extremes (i.e., constant influx vs. free-space regulation). Thus, it is reasonable to assume that during an intense epidemic, when many susceptible corals will be removed through death, the spatial component of the disease will play a role in the disease dynamics.
Indeed, our future predictions confirm that the spatial component of the disease transmis-sion system has, to some extent, a protective effect that restricts the magnitudes of annual epi-demics. Under a demographic scenario of constant influx of recruits, the mean coral
host density and disease transmission has been demonstrated in many host-pathogen systems [75–78], and is considered as an important property of the infectious process [79]. Specifically with infectious coral diseases, high coral density may have similar effects to that of high coral coverage; effectively this reduces the mean distance between neighboring corals, and as with our spatiotemporal epidemic model, increases the likeliness of inter-colonial transmission. In-deed, Brunoet al. [13] demonstrated that for white syndrome outbreaks to occur in the Great Barrier Reef in Australia, in addition to thermal stress, coral coverage must be relatively high (50% or higher).
Our model suggests that an infectious disease, such as WPD in the Red Sea, cannot lead to a complete destruction of the coral community, due to the spatial nature of the disease transmis-sion and its protective effect. However, this also implies that signs of recovery of local coral communities may be misleading, and are not truly indicative of their rehabilitation (see for ex-ample the sharp fluctuations in the disease prevalence inFig 6C). In addition, environmental changes, such as increasing levels of SST, can shift the nature of recruitment on local scales, al-tering the way in which the spatial component of the system restricts or enhances local disease dynamics. In addition, note that the remarkable transition in disease prevalence, which is ob-served when recruitment is free-space regulated (Fig6D,6Eand6F), may indicate that the in-teraction of the seasonal driving force and the spatial nature of the system has higher levels of complexity, beyond those described here. These more complex aspects of this system are be-yond the scope of the present paper.
To summarize, we have addressed some fundamental questions regarding the dynamics of WPD in the Red Sea. Spatiotemporal statistics combined with null hypothesis approaches proved to be effective tools for understanding epizootiological processes in coral reef commu-nities. The new spatiotemporal index,n(r), proved to be specifically tuned to detect the local-ized transmission dynamics among the infected corals. Previous approaches for modeling coral disease have not used powerful statistical inference methodologies to estimate parameters and for choosing the best model structure. Neither have they attempted to model the epidemic curve as it changes over a single season. In this study, however, a specially formulated maxi-mum-likelihood fitting procedure, enabled us to estimate the most likely parameters in the model (αandct), based on the disease dynamics in space and time. It also allowed us to link the
spatiotemporal dynamics of the disease to seawater temperature (seectin Eqs2and10) and gave us an opportunity to generate future projections that assess the impact of increasing SST on coral communities. Over any season, the spatial model revealed that as the temperature in-creases, the spread of WPD on corals looks similar to the spread of forest fires, where dense for-ests tend to burn completely while less dense forfor-ests are relatively resistant because the fire can hardly spread [80,81].
Current assessments on the future of these reef-building corals are still relatively uncertain, being hindered by a lack of knowledge and understanding. In this context, our study exposes the critical importance of conducting additional multi-annual surveys on local spatial scales, for deepening our insights into these unique systems, and for supporting our efforts to success-fully design effective conservation policies.
Materials and Methods
A Null Model for Testing the Spatiotemporal Pattern of WPD
month. The non-aggregated null distribution of the NICs, and thusn(r), was generated as fol-lows. Infected corals from the first month in each pair of sequential sampling dates defined the
mfixed PICs. Then, via computer simulation, a group ofksimulated NICs was randomly cho-sen from the entire pool of susceptible corals without any discrimination as to whether individ-uals were healthy or infected.n(r) was then determined for different radiir. This was repeated 1,000 times so thatn(r) could be calculated for each group ofkNICs for any value ofr. These results made it possible to generate a 95% confidence interval (CI) envelope forn(r) under the null hypothesis of no aggregation of the NICs. We then calculatedn(r) using only thek ob-served NICs found in the field. If the obob-servedn(r) was found within the envelope, then the null hypothesis could not be rejected and the spatial distribution of NICs was considered inde-pendent of the spatial distribution of the PICs. Otherwise, if the observedn(r) was found out-side the 95% CI envelope, the null hypothesis was rejected and the spatial distribution of NICs was considered significantly dependent on that of the PICs atα= 5% level (that is, the null
hy-pothesis was rejected). NICs are considered spatially aggregated around PICs where the ob-servedn(r) is greater than the null expectation, indicating inter-colonial (i.e. local) infections. On the other hand, NICs are considered over-dispersed in relation to PICs, ifn(r) is smaller than the null expectation. This test was carried out for all pairs of sequential sampling dates.
Testing the Validity of the Spatiotemporal SIS Model
To test whether the spatiotemporal model describes suitably the transmission pattern of the disease, we simulated the infection process at the studied site based on a given set of PICs for a particular date, using the most likely parametersð^a;c1ð^aÞ;. . .;c11ða^ÞÞ. Thus, infected corals
from the first month in each pair of sequential sampling dates define themfixed PICs. Then, for a simulation that required a generation of new infections, we simply chose NICs at random from the entire pool of corals, assuming that coral-ihas a probabilitypt(i) of being chosen (Eq 2). We repeated this process 1,000 times. Then, the model was tested for each pair of sequential sampling dates in two different ways: (i) the number of NICs observed in the field was com-pared with the distribution of the number of NICs obtained from the 1,000 random realiza-tions; and (ii) the spatiotemporal indexn(r) (Eq 1) that was calculated for the real data was compared with the distributions ofn(r) that was calculated for any distance scaler, for the 1,000 random realizations. We tested whether the observed number of NICs andn(r) were sig-nificantly different from the null distribution of those simulated under a two-tailed test of 5% significance level. If this occurred it implied that the results found in the field are inconsistent with the proposed null model.
The Epidemic Potential of WPD and
R
0In the beginning of the transmission season, the spread of the disease in the local community exhibited epidemic-like growth. The epidemiological reproductive number,R0[65], was calcu-lated for the time period between June and August 2006 (the development period of the disease within the community), using the approximate relationshipR0 erTG[82] (cf., Zvuloniet al.
[16] for black-band disease (BBD)). The exponential growth rate is governed by the parameter
r, which is estimated by fitting an exponential function to the (cumulative) incidence of the in-fective numbers. The parameterTGis the observed mean generation interval, i.e., the interval between a coral becoming infected and its subsequent infection of another coral (see Zvuloni
et al. [16]).R0measures the epidemic potential of a pathogen and is defined as the mean
in an outbreak. If, however,R0>1, then the introduction of the disease is likely to result in an epidemic that persists for extended periods.
Simulating Future Projections of WPD
Linking the spatiotemporal model (Eq 2) to seawater temperatures allows us to assess the po-tential future impact of WPD on the local coral community. We calculated the probability of each susceptible coral to become infected according toEq 2, wherectin this equation was de-termined by fitting a quadratic model to fit SST according to the SST in that month (Eq 10). We setα= 1.9, which was found to be the best fitting exponent. The use of Eqs2and10for
fu-ture predictions ensures that the probability of any susceptible coral to become infected has both spatial and seasonal/environmental components.
In accordance with our data, simulations are carried out in discrete time steps from month to month. For all simulated projections, we use the last month of the real data as initial condi-tions for the future projeccondi-tions, and SST is based on a time series measured between June 2006 and May 2007, which we assume repeats yearly. In light of global change, there is also obvious interest in trying to assess long-term effects of variations in SST, and we do this by varying the levels of SST in our simulated projections.
Each year in the beginning of the infection period we randomly infected one of the corals. This insured that the local population did not stay infection free due to stochastic fadeouts in the previous season. Clearance and death rates were month specific and calculated based on collected data, i.e., the probability of death, recovery, or remaining infected is determined by the fraction of infections that died, cleared, or stayed infected in the same month in the original data.
The locations for new recruits in the 10×10 m plot are randomly chosen anywhere on the plot whenever a recruitment event takes place. This approach sets no spatial restrictions on coral settlement, and as such does not constrain the topological distribution of the corals. We assume that theper capitarecruitment is either: (i)“recruitment limited”—independent of local community density by assuming a constant influx of recruits per year. Alternatively, we assume recruitment is (ii)“free-space regulated”—dependent on the level of free substrate in the local patch; following from the hypothesis that this is a limiting resource in many marine benthic populations [66–69]. Here it is assumed that following a coral’s death, a healthy recruit instantaneously replaces it. In the first scenario (i), due to the spatial component of the model, the coral density may play a significant role in the transmission probability of the disease. On the other hand, in the second scenario (ii), the coral community density remains constant, and the role of the spatial component in the model is also expected to be relatively constant. In real-ity, coral recruitment is likely to lie somewhere between these two extremes, with variations in the location of different reefs along this continuum (for further reading on these assumptions, see [66–69].
Supporting Information
S1 Fig. Size structure of the studied coral community. (a) The coral community at the study site is extremely dense (>50 corals/m2). As reference, the distance between the two parallel lines is 1 m. (b)This community is composed of mostly relatively small massive corals, many of which are susceptible to infection by WPD (average ofca. 27.5 susceptible corals/m2). No differences were found between the size frequency distribution of susceptible vs. infected corals (Pv= 0.47; Kolmogorov-Smirnov two-sample test).
S2 Fig. Plots of the spatiotemporal indexn(r) calculated for pairs of sequential sampling dates (see text).The black line represents the observedn(r) values (Eq 1) for corals infected with white-plague disease (WPD). The shaded areas are the Monte Carlo 95% confidence inter-val (CI) envelopes, representing two different null expectations:(a)new infections develop ran-domly within the studied plot, independent of the spatial location of infected corals from the previous month; and(b)new infections develop according to the spatiotemporal model (Eq 2). For distance scales (r) wheren(r) values fall within the envelope, the spatial distribution of in-fected corals does not differ significantly from the null distribution. Inin-fected corals are signifi-cantly more aggregated (/over-dispersed) where the observedn(r) values fall above (/below) the CI envelope. In all cases the NICs observed in the field appeared to form aggregations around PICs over distance scales of up to 4.5 m. That is, in all cases the hypothesis that the NICs were infected by a random process of disease transmission independent of the spatial lo-cation of the PICs was rejected. Almost in all cases, the observedn(r) was purely within the ex-pectation of the spatiotemporal model (Eq 2) for all distance scalesr. However, in a few cases the observedn(r) was found to be greater than the upper bound of the 95% CI envelope gener-ated by the model realizations for certain distance scales (see, for example, August-September 2006).
(PDF)
S3 Fig. Probability surface plots for all pair of sequential sampling dates between June 2006 and May 2007.The probability of infection at each point within the 10×10 m studied site is displayed as a gradient of colors. Such that, warm colors (e.g. red) represent a high probabili-ty of infection (‘disease hotspots’) and cold colors (e.g. blue) represent a lower probability of in-fection. The probability was calculated byEq 2(using the best fitting parametersα,c1,c2,. . .,
c11; see text) for a set of all Previously-Infected Corals (PICs; red circles) observed in the field. Note that in nearly all cases Newly-Infected Corals (NICs; white circles) develop in significant proximity to PICs as proposed by the model.
(PDF)
S4 Fig. Simulated future projections of the local coral community.InA)are the number of infected corals, and inB)is the total community size of live corals. The simulated projections in red are equivalent to those inFig 6of the main text (where we used the exact values of esti-matedc1,c2,. . .,c11), and in green are an example where we allowed each of the parametersc1,
c2,. . .,c11to vary uniformly +/-2.5% from their original estimated values. We found the results to be equivalent demonstrating the robustness of our described patterns under mild parameter variation. To make this clearer, we show here a close up of the projections from year 25 to year 75. As inFig 6, the simulations in panelsa,bandcrelied on the demographic scenario of con-stant influx of recruits (64 recruits per year), while in panelsd,eandf, they rely on the scenario of free-space regulation of recruitment (seeMaterial and Methods). Panelsaanddare based on the SST time-series measured between June 2006 and May 2007 recurrently from year to year in the corresponding months. Based on this time-series, we generate future projections by adding 0.5°C (panelsbande) and 1°C (panelscandf) to the SST of each month. In these simu-lations we allow each new recruit to settle randomly anywhere on the 10×10 m plane.
(PDF)
S1 Table. Maximum-likelihood estimates for the parametersct(c1,c2,. . .,c11) (see Eqs3–9),
Acknowledgments
We thank J. Belmaker and Y. Shaked for reviewing the manuscript and the Israel National Monitoring Program of the Gulf of Eilat (NMP) for SST data.
Author Contributions
Conceived and designed the experiments: AZ YAR LS YL. Performed the experiments: AZ. An-alyzed the data: AZ YAR GK. Contributed reagents/materials/analysis tools: AZ YAR GK LS. Wrote the paper: AZ YAR LS GK.
References
1. Weil E, Urreiztieta I, Garzón-Ferreira J. Geographic variability in the incidence of coral and octocoral diseases in the wider Caribbean.Proceedings of 9th international coral reef symposium2002; 2: 1231–8.
2. Nugues MM. Impact of a coral disease outbreak on coral communities in St. Lucia: What and how much has been lost?Marine Ecology Progress Series2002; 229: 61–71.
3. Richardson LL, Voss JD. Changes in a coral population on reefs of the northern Florida Keys following a coral disease epizootic.Marine Ecology Progress Series2005; 297: 147–56.
4. Aronson RB, Precht WF. White-band disease and the changing face of Caribbean coral reefs. 2001: 25–38.
5. Williams EH, Bunkley-Williams L. The world-wide coral reef bleaching cycle and related sources of coral mortality.Atoll Research Bulletin1990; 335: 1–71.
6. Santavy D, Peters EC. Microbial pests: coral diseases in the western Atlantic. Panama: Smithsonian Tropical Research Institute 1997.
7. Goreau TJ, J. C, M. G et al. Rapid spread of diseases in Caribbean coral reefs.Revista de Biologia Tropical1998; 46: 157–71.
8. Hayes RL, Goreau NI. The significance of emerging diseases in the tropical coral reef ecosystem. Revista de Biologia Tropical1998; 46: 173–85.
9. Harvell CD. Emerging Marine Diseases–Climate Links and Anthropogenic Factors.Science1999; 285: 1505–10. PMID:10498537
10. Kaczmarsky LT. Coral disease dynamics in the central Philippines.Diseases of aquatic organisms 2006; 69: 9–21. PMID:16703762
11. Jones RJ, Bowyer J, Hoegh-Guldberg O, Blackall LL. Dynamics of a temperature-related coral disease outbreak.Marine Ecology Progress Series2004; 281: 63–77.
12. Bally M, Garrabou J. Thermodependent bacterial pathogens and mass mortalities in temperate benthic communities: a new case of emerging disease linked to climate change.Global Change Biology2007; 13: 2078–88.
13. Bruno JF, Selig ER, Casey KS et al. Thermal Stress and Coral Cover as Drivers of Coral Disease Out-breaks.PLoS Biology2007; 5: e124. PMID:17488183
14. Rodríguez S, Cróquer A. Dynamics of Black Band Disease in a Diploria strigosa population subjected to annual upwelling on the northeastern coast of Venezuela.Coral Reefs2007; 27: 381–8.
15. Sato Y, Bourne DG, Willis BL. Dynamics of seasonal outbreaks of black band disease in an assem-blage of Montipora species at Pelorus Island (Great Barrier Reef, Australia).Proceedings of the Royal Society B:Biological Sciences2009; 276: 2795–803. doi:10.1098/rspb.2009.0481PMID:19419991
16. Zvuloni A, Artzy-Randrup Y, Stone L et al. Spatio-Temporal Transmission Patterns of Black-Band Dis-ease in a Coral Community.PLoS ONE2009; 4: e4993. doi:10.1371/journal.pone.0004993PMID:
19337384
17. Coles SL, Brown BE. Coral bleaching—capacity for acclimatization and adaptation. 2003; 46: 183–
223.
18. Kim K, Harvell CD. Aspergillosis of sea fan corals: dynamics in the Florida Keys: Boca Raton: CRC 2002.
19. Bruno JF, Petes LE, Drew Harvell C, Hettinger A. Nutrient enrichment can increase the severity of coral diseases.Ecology Letters2003; 6: 1056–61.
21. Baker DM, MacAvoy SE, Kim K. Relationship between water quality,δ15N, and aspergillosis of
Carib-bean sea fan corals.Marine Ecology Progress Series2007; 343: 123–30.
22. Kuta K, Richardson L. Ecological aspects of black band disease of corals: relationships between dis-ease incidence and environmental factors.Coral Reefs2002; 21: 393–8.
23. Rosenberg E, Falkovitz L. Thevibrio Shiloi/Oculina Patagonicamodel System of Coral Bleaching. Annu-al Review of Microbiology2004; 58: 143–59. PMID:15487933
24. Williams DE, Miller MW. Coral disease outbreak: pattern, prevalence and transmission in Acropora cer-vicornis.Marine Ecology Progress Series2005; 301: 119–28.
25. Aeby GS, Santavy DL. Factors affecting susceptibility of the coral Montastraea faveolata to black-band disease.Marine Ecology Progress Series2006; 318: 103–10.
26. Nicolet KJ, Hoogenboom MO, Gardiner NM et al. The corallivorous invertebrate Drupella aids in trans-mission of brown band disease on the Great Barrier Reef.Coral Reefs2013; 32: 585–95.
27. McClanahan TR, McLaughlin SM, Davy JE et al. Observations of a new source of coral mortality along the Kenyan coast. 2004; 178: 469–79.
28. Miller J, Waara R, Muller E, Rogers C. Coral bleaching and disease combine to cause extensive mortal-ity on reefs in US Virgin Islands.Coral Reefs2006; 25: 418-.
29. Ritchie KB. Regulation of microbial populations by coral surface mucus and mucus-associated bacte-ria.Marine Ecology Progress Series2006; 322: 1–14.
30. Muller EM, Rogers CS, Spitzack AS, van Woesik R. Bleaching increases likelihood of disease on Acro-pora palmata (Lamarck) in Hawksnest Bay, St John, US Virgin Islands.Coral Reefs2007; 27: 191–5. 31. McClanahan TR, Weil E, Maina J. Strong relationship between coral bleaching and growth anomalies
in massivePorites.Global Change Biology2009; 15: 1804–16.
32. Willis BL, Page CA, Dinsdale EA. Coral disease on the Great Barrier Reef. Heidelberg, Germany: Springer 2004.
33. Raymundo LJ, Rosell KB, Reboton CT, Kaczmarsky L. Coral diseases on Philippine reefs: genus Por-ites is a dominant host.Diseases of aquatic organisms2005; 64: 181–91. PMID:15997816
34. Sokolow S. Effects of a changing climate on the dynamics of coral infectious disease: a review of the evidence.Diseases of Aquatic Organisms2009; 87: 5–18. doi:10.3354/dao02099PMID:20095237
35. Williams GJ, Aeby GS, Cowie ROM, Davy SK. Predictive Modeling of Coral Disease Distribution within a Reef System.PLoS ONE2010; 5: e9264. doi:10.1371/journal.pone.0009264PMID:20174663
36. Heron SF, Willis BL, Skirving WJ et al. Summer Hot Snaps and Winter Conditions: Modelling White Syndrome Outbreaks on Great Barrier Reef Corals.PLoS ONE2010; 5: e12210. doi:10.1371/journal. pone.0012210PMID:20808912
37. Harvell D, Jordán-Dahlgren E, Merkel S et al. Coral Disease, Environmental Drivers, and the Balance Between Coral and Microbial Associates.Oceanography2007; 20: 172–95.
38. Cerrano C, Bavestrello G, Bianchi CN et al. A catastrophic mass-mortality episode of gorgonians and other organisms in the Ligurian Sea (North-western Mediterranean), summer 1999.Ecology Letters 2000; 3: 284–93.
39. Selig ER, Harvell CD, Bruno JF et al. Analyzing the relationship between ocean temperature anomalies and coral disease outbreaks at broad spatial scales. Washington (DC): American Geophysical Union 2006.
40. Weil E, Croquer A, Urreiztieta I. Temporal variability and impact of coral diseases and bleaching in La Parguera, Puerto Rico from 2003–2007.Caribbean Journal of Science2009; 45: 221–46.
41. Riegl B. Effects of the 1996 and 1998 positive sea-surface temperature anomalies on corals, coral dis-eases and fish in the Arabian Gulf (Dubai, UAE).Marine Biology2002; 140: 29–40.
42. Edmunds PJ. Extent and effect of Black Band Disease on a Caribbean reef.Coral Reefs1991; 10: 161–5.
43. Kuta KG, Richardson LL. Abundance and distribution of black band disease on coral reefs in the north-ern Florida keys.Coral Reefs1996; 15: 219–23.
44. Boyett HV, Bourne DG, Willis BL. Elevated temperature and light enhance progression and spread of black band disease on staghorn corals of the Great Barrier Reef.Marine Biology2007; 151: 1711–20. 45. Bruckner AW, Bruckner RJ. Outbreak of coral disease in Puerto Rico.Coral Reefs1997; 16: 260-. 46. Haapkylä J, Melbourne-Thomas J, Flavell M, Willis BL. Spatiotemporal patterns of coral disease
preva-lence on Heron Island, Great Barrier Reef, Australia.Coral Reefs2010; 29: 1035–45.
48. Patterson KL, Porter JW, Ritchie KB et al. The etiology of white pox, a lethal disease of the Caribbean elkhorn coral, Acropora palmata.Proceedings of the National Academy of Sciences2002; 99: 8725–
30. PMID:12077296
49. Sokolow SH, Foley P, Foley JE et al. Editor's choice: Disease dynamics in marine metapopulations: modelling infectious diseases on coral reefs.Journal of Applied Ecology2009; 46: 621–31.
50. Richardson LL, Goldberg WM, Kuta KG et al. Florida’s mystery coral killer identified.Nature1998; 392: 557–8.
51. Croquer A, Pauls SM, Zubillaga AL. White plague disease outbreak in a coral reef at Los Roques Na-tional Park, Venezuela.Revista de biologia tropical2003; 51 Suppl 4: 39–45. PMID:15264552
52. Barash Y, Sulam R, Loya Y, Rosenberg E. Bacterial Strain BA-3 and a filterable factor cause a white plague-like disease in corals from the Eilat coral reef.Aquatic Microbial Ecology2005; 40: 183–9. 53. Weil E, Smith G, Gil-Agudelo DL. INTRODUCTION Status and progress in coral reef disease research
Ernesto Weil1,*, Garriet Smith2, Diego L. Gil-Agudelo3.Diseases of Aquatic Organisms2006; 69: 1–
7.
54. Richardson LL, Goldberg WM, Carlton RG, Halas JC. Coral disease outbreak in the Florida Keys: Plague Type II.REVISTA DE BIOLOGIA TROPICAL1998; 46: 187–98.
55. Denner EB, Smith GW, Busse HJ et al. Aurantimonas coralicida gen. nov., sp. nov., the causative agent of white plague type II on Caribbean scleractinian corals.International journal of systematic and evolutionary microbiology2003; 53: 1115–22. PMID:12892136
56. Thompson FL. Thalassomonas loyana sp. nov., a causative agent of the white plague-like disease of corals on the Eilat coral reef.International Journal of Systematic and Evolutionary Microbiology2006; 56: 365–8. PMID:16449441
57. Efrony R, Atad I, Rosenberg E. Phage therapy of coral white plague disease: properties of phage BA3. Current microbiology2009; 58: 139–45. doi:10.1007/s00284-008-9290-xPMID:18923867
58. Yakob L, Mumby PJ. Climate change induces demographic resistance to disease in novel coral assem-blages.Proceedings of the National Academy of Sciences2011; 108: 1967–9. doi:10.1073/pnas. 1015443108PMID:21245326
59. Zvuloni A, Artzy-Randrup Y, Stone L et al. Ecological size-frequency distributions: how to prevent and correct biases in spatial sampling.Limnology and Oceanography:Methods2008; 6: 144–53. 60. Ripley BD. Spatial statistics: Wiley 1981.
61. Ripley BD. The second-order analysis of stationary processes.Journal of Applied Probability1976: 255–66.
62. Murray JD. Mathematical Biology. Berlin: Springer 1990.
63. Hethcote HW. The Mathematics of Infectious Diseases.SIAM Review2000; 42: 599–653.
64. Stone L, Olinky R, Huppert A. Seasonal dynamics of recurrent epidemics.Nature2007; 446: 533–6. PMID:17392785
65. Anderson RM, May RM. Infectious diseases of humans: dynamics and control. Oxford; New York: Ox-ford University Press 1991.
66. Gaines S, Roughgarden J. Larval settlement rate: A leading determinant of structure in an ecological community of the marine intertidal zone.Proceedings of the National Academy of Sciences of the Unit-ed States of America1985; 82: 3707–11. PMID:16593571
67. Hughes TP. Recruitment Limitation, Mortality, and Population Regulation in Open Systems: A Case Study.Ecology1990; 71: 12.
68. Roughgarden J, Iwasa Y, Baxter C. Demographic theory for an open marine population space-limited recruitment.Ecology1985; 66: 54–67.
69. Artzy-Randrup Y, Olinky R, Stone L. Size-structured demographic models of coral populations.Journal of theoretical biology2007; 245: 482–97. PMID:17182064
70. May RM. Stability and complexity in model ecosystems: Princeton University Press 2001.
71. Jolles AE, Sullivan P, Alker AP, Harvell CD. Disease Transmission of Aspergillosis in Sea Fans: Infer-ring Process from Spatial Pattern.Ecology2002; 83: 2373–8.
72. Muller EM, van Woesik R. Caribbean coral diseases: primary transmission or secondary infection? Global Change Biology2012; 18: 3529–35.
73. Fitt W, Brown B, Warner M, Dunne R. Coral bleaching: interpretation of thermal tolerance limits and thermal thresholds in tropical corals.Coral Reefs2001; 20: 51–65.
74. Richardson LL, Kuta KG. Ecological physiology of the black band disease cyanobacterium Phormidium corallyticum.FEMS Microbiology Ecology2003; 43: 287–98. doi:10.1016/S0168-6496(03)00025-4
75. Anderson RM, May RM. Population biology of infectious diseases, Part I.Nature1979; 280: 361–7. PMID:460412
76. Altizer S, Nunn CL, Thrall PH et al. SOCIALORGANIZATION ANDPARASITERISK INMAMMALS: Inte-grating Theory and Empirical Studies.Annual Review of Ecology,Evolution,and Systematics2003; 34: 517–47.
77. Rudolf VH, Antonovics J. Species coexistence and pathogens with frequency-dependent transmission. The American naturalist2005; 166: 112–8. PMID:15937794
78. Lafferty KD. Fishing for Lobsters Indirectly Increases Epidemics in Sea Urchins.Ecological Applica-tions2004; 14: 1566–73.
79. Lafferty KD, Gerber LR. Good Medicine for Conservation Biology: the Intersection of Epidemiology and Conservation Theory.Conservation Biology2002; 16: 593–604.
80. Roy M, Zinck RD, Bouma MJ, Pascual M. Epidemic cholera spreads like wildfire.Scientific reports 2014; 4: 3710. doi:10.1038/srep03710PMID:24424273
81. Grenfell BT, Dobson AP. Ecology of Infectious Diseases in Natural Populations: Cambridge University Press 2008.
82. Roberts MG, Heesterbeek JA. Model-consistent estimation of the basic reproduction number from the incidence of an emerging infection.Journal of mathematical biology2007; 55: 803–16. PMID: