M
ASTER OF
S
CIENCE IN
FINANCE
M
ASTERS
F
INAL
W
ORK
PROJECT
EQUITY RESEARCH
:
IBERSOL,
SGPS,
SA
S
IMÃO
L
OURENÇO
P
EREIRA
M
ASTER OF
S
CIENCE IN
FINANCE
M
ASTERS
F
INAL
W
ORK
PROJECT
EQUITY RESEARCH
:
IBERSOL,
SGPS,
SA
S
IMÃO
L
OURENÇO
P
EREIRA
S
UPERVISOR
:
VICTOR
MAURÍLIO
SILVA
BARROS
Abstract
This project performs a valuation of the Portuguese company IBERSOL, SGPS,
SA and integrates the final project of ISEG’s Master in Finance. It was elaborated under
the format typology recommended by the CFA Institute for the CFA Research
Challenge.
Ibersol reached the Portuguese major Stock Index, PSI 20, on March 2017, less
than one year after performed a great acquisition of the Spanish competitor EOG. The
recent changes in Ibersol structure at the operational, financial and strategical level,
makes the company very attractive to value in the context of the fast food industry.
Through the valuation process several assumptions were adopted enabling the
possibility to forecast the company evolution on operational, financing and investment
areas. Applying the discounted cash-flow methodology, the company’s shares have
been valued
at €9.70 for 2019YE, reflecting an (annualized) upside potential of 13%
(11%) when compared with 26
thOctober 2018 closing price of €8.56. Rated as a
Medium Risk company, the final recommendation is set as NEUTRAL. Complementary
market-based valuation sustains that the outlook is positive, although modest.
Resumo
Este projecto consiste na avaliação da empresa Portuguesa IBERSOL, SGPS,
SA e integra o projecto final do Mestrado em Finanças do ISEG. Foi elaborado sob o
formato recomendado pelo Instituto CFA para o “CFA Research Challenge”.
A Ibersol passou a integrar o maior índex de acções português, PSI 20, a Março
de 2017, menos de um ano depois da aquisição do competidor espanhol EOG. As
recentes alterações na estrutura da Ibersol a nível operacional, financeiro e
estratégico tornam a empresa bastante atraente para avaliação dentro do contexto do
mercado do fast-food.
No decorrer do processo de avaliação foram adoptadas várias assumpções que
permitiram a realização de previsões da evolução da empresa nas áreas operacionais,
financeiras e de investimento. Aplicando o método de avaliação dos Fluxos de Caixa
Descontados, as ações da empresa foram avaliadas em €9.70 para o final do ano de
2019, refletindo um potencial de crescimento (anualizado) de 13% (11%) quando
comparado com o preço de fecho do mercado a 26 de Outubro de 2018,
€8.56.
Classificada como uma empresa de Médio Risco, a recomendação final é estabelecida
como MANTER. Complementariamente, a avaliação com base no mercado sugere
que as perspectivas são positivas, no entanto modestas.
Index
Abstract
i
Resumo
ii
List of Figures
v
List of Tables
vi
1.
Research Snapshot
1
2.
Business Description
2
3.
Management and Corporate Governance
4
4.
Industry Overview and Competitive Positioning
6
Iberia Economic outlook
6
Consumer foodservice evolution - Industry
6
Market Sub - Sector
7
Competitive positioning
8
5.
Investment Summary
10
6.
Valuation
11
7.
Financial Analysis
15
8.
Investment Risks
17
Appendices
20
Appendix 1: Statement of Financial Position
20
Appendix 2: Income Statement
21
Appendix 3: Cash Flow Statement
22
Appendix 4: Key Financial Ratios
22
Appendix 5: Dupont analysis
23
Appendix 6: Common-Size Statement of Financial Position
24
Appendix 7: Forecasting assumptions
25
Appendix 8: Forecasting Assumptions – Revenues
27
Appendix 9: Forecasting assumptions – Amortization, depreciation, replacement and
expansion
29
Appendix 10: Forecasting assumptions – Personnel costs
30
Appendix 11: Forecast assumptions - Dividend policy
30
Appendix 12: Forecast assumptions – Debt
31
Appendix 13: Forecast assumptions – Accounts payable – Suppliers & accrued costs 31
Appendix 14: Business Structure and portfolio administrations
32
Appendix 15: Risk-free rate calculation
32
Appendix 16: Discounted Cash Flow Assumptions
32
Appendix 17: Cost of equity Calculation
33
Appendix 18: Discounted cash flow analysis
34
Appendix 18: Relative Valuation
35
Appendix 19: Peers description
38
Appendix 20: Pure-play Beta – Peers analysis
38
Appendix 22: Investment ratings and risk classification
39
Appendix 23: Scenarios
39
Appendix 23: Risk Matrix
41
Appendix 24:
Shareholders structure
42
Appendix 26: Corporate Governance – Administration
42
Appendix 27: Corporate Governance – Monist Model
43
Appendix 28: IBERSOL Business Portfolio description
43
Appendix 29: Business Units – Distribution
44
Appendix 30: Principal Costs evolution (2014-2017)
45
Appendix 31: EBITDA Evolution
45
Appendix 32: Porter’s Five Forces
46
References
47
List of Figures
Figure 1: Ibersol Historical Share price vs Price target
1
Figure 2: EBITDA margin forecasts
1
Figure 3: 10Y Revenue and Share price
2
Figure 4: Revenues per segment 2014-2017
2
Figure 5: Revenues per region
2
Figure 6: Stores per segment
2
Figure 7: Principal Operational Costs from 2017
3
Figure 8: Shareholder structure on 31/12/2017
3
Figure 9: Foodservice market evolution
6
Figure 10: Inflation forecast
6
Figure 11: Gross minimum monthly Portuguese and Spanish salary
6
Figure 12: Tourism evolution indicators
6
Figure 13: Fast food market evolution
7
Figure 15: Ibersol vs market vs economic environment 2013-2017- secondary axis for
company revenue evolution
7
Figure 14: Revenues per business typology
7
Figure 16: Foodservice market and sub segments forecasted evolution
7
Figure 17: Chained consumer food-service total sales and evolution
7
Figure 18: Revenues per segment
10
Figure 19: Risk matrix
17
List of Tables
Table 1: IBS Valuation Results
1
Table 2: IBS generic information for 27/10/2018
1
Table 3: Sensitivity analysis Revenues vs Main Operational Costs
1
Table 4: Company portfolio
2
Table 5: Revenues per operational segment, 2014 - 2017
2
Table 6: EOG acquisition impact in IBERSOL revenues
3
Table 7: Company EBITDA and EBITDA ratios, 2014-2017
3
Table 8: Qualifying shareholders structure on 31/12/2017
3
Table 10: Governance model
4
Table 9: Subsidiaries on 31/12/2017
4
Table 11: CMVM’s corporate governance recommendations
4
Table 12: Projected CAGR per business type and geography
6
Table 13: Main competitors per geographical segment
8
Table 14: EBITDA margin for foodservice sector in European companies with market
capitalization similar with IBERSOL
8
Table 15: Investment recommendation
10
Table 16: WACC and capital structure
10
Table 17: Personnel costs tests:Cost per worker vs number of workers per store. 10
Table 18: Revenues drivers
11
Table 19: Revenues estimators drivers
11
Table 20: Sub-segments geographical distribution
11
Table 21: Stores openings
12
Table 22: Amortization, Depreciation, Replacement and Expansion
12
Table 23: Sales, COGS and historical gross margin
12
Table 24: Sector debt structure
12
Table 25: EOG acquisition impact in Debt
13
Table 26: Personnel costs breackdown
13
Table 27 Dividend per share
13
Table 28- Days of suppliers Outstanding
13
Table 29: Cost of capital key figures
14
Table 30: Risk free rate and Cost of debt evolution
14
Table 31: WACC and cost of equity and debt
14
Table 33: Main costs estimated CAGR and average weight (2018-2022)
15
Table 34: Operational margins, historical and forecast
15
Table 35: Annual investment in replacement and expansion of the fixed assets
15
Table 36: Debt structure indicators and Net Debt to EBITDA
15
Table 37: Net working capital forecasts
15
Table 38: Cash-flow activities and cash account
16
Table 39: Efficiency ratios, Dupont analysis indicators
16
Table 40: Monte Carlo simulation
19
Table 41: Monte Carlo Sensitivity Analysis
19
IBS: Hungry for efficiency
(YE2019 Price Target of €9.70 +13%); Investment recommendation is set as
NEUTRAL.
1.
Research Snapshot
Investment in IBERSOL, SGPS, SA (IBS) is classified as Neutral with a price target of € 9.70 and an upside potential of 13%. This means that given the medium risk associated to the company, invest in Ibersol stock is not expected to become a profitable investment exceeding IBS’s cost of capital. Market multiples support the timidly positive outlook, which may result from the high potential to enhance competitiveness and increase efficiency.
Trending demand is one of the major risks associated with Ibersol sector. Operating within fast food market; restaurants; including two of the main pizza players of Iberia; catering and exploring
several concessions: namely central coffee shops, highway service stations and airports; company demand is highly influenced by the moment trends. All the risks associated with the demand patterns are, in part, mitigated for by Ibersol’s diversified portfolio. Playing an important role for Ibersol services demand, tourism evolution is also a key driver for revenues. Total revenues are expected to increase with a CAGR (compounded annual growth rate) of 5.37% until 2022; value directly influenced by the firm investments in new stores, yet considering cannibalization effects and by performance above industry average.
Increasing operational costs and the stretching of the operational margins represents an elevated risk to company financial health. Cost of goods sold (COGS), Personnel costs and rents represented, in 2017 almost 68.64 % of the firm total revenues. Raw materials prices, costs with the labor force and rentals markets represent operational sensitive areas, where Ibersol needs to pay special attention. Predicted increases, especially with the rental and personnels costs are expected to result in decreasing margins.
Debt structure is changing as extraordinary debt, contracted in 2016 due to EOG (Eat Out Group) acquisition, is being absorbed. Attending to the past disclosure regarding debt structure and targeted objectives, it is possible to understand the conservative positioning regarding debt. Despite targeting an optimal gearing ratio between 35% and 70%, Ibersol faced, in the past (2012 – 2015), figures below 20%. This ratio was shaken after the EOG acquisition in 2016 rising until 42%; however, adjusting to 31% in 2017. By 2020, it should reach 20% and expectations are for the ratio to be kept below such value thereafter.
Table 3: Sensitivity analysis Revenues vs Main Operational Costs (Source: Author)
Change in revenues 9.70 98.5% 99.0% 99.5% 100.0% 100.5% 101.0% 101.5% Cha n g e in co sts 98.50% 8.13 9.30 10.47 11.65 12.80 13.96 15.11 99.00% 7.48 8.65 9.83 11.00 12.16 13.31 14.46 99.50% 6.82 8.00 9.17 10.34 11.51 12.67 13.83 100.00% 6.17 7.35 8.52 9.70 10.87 12.03 13.19 100.50% 5.52 6.70 7.88 9.05 10.22 11.39 12.55 101.00% 4.86 6.05 7.23 8.40 9.58 10.75 11.91 101.50% 4.19 5.39 6.57 7.75 8.92 10.09 11.26 Closing price 8.56 51-wk High 10.55 52-wk Low 8.52
Shares outstanding 33.0 Million Market Capitalization 309.34 Million
Valuation 2019YE
DCF 9.70
EV / EBITDA 12.02
EV / Sales 12.54
P / E 11.21
Average Price multiples 11.28 Table 1: IBS Valuation Results (Source: Author) 8.58 9.7 0 2 4 6 8 10 12
Figure 1: Ibersol Historical Share price vs Price target (Source: Author and Yahoo Finance)
Company IBS
Neutral
Medium risk
26 October 2016Portugal
Table 2: IBS generic information for 27/10/2018 (Source: Reuters) 75% 80% 85% 90% 95% 100% 2017 2018F 2019F 2020F 2021F 2022F Operational Costs EBITDA Margin Figure 2: EBITDA margin forecasts (Source: Author)
2.
Business Description
IBERSOL SPSG, SA is a Portuguese restaurant chain company seeded in Porto. It started operating in 1990 in Algarve and since then the company has been submitted to continuous portfolios modifications. IBERSOL sales growth, during the last 10 years, increased in more than 25%. The quality of services has been in constant changing in order to satisfy new trends and client demands.
The company, SA is listed as a public limited company on the Euronext, of Lisbon. On March 2017, the company was integrated into the PSI 20, the main Portuguese stock market index. The group owns and explores a large number of firms, majorly within the food sector: the Ibersol Group. For the consolidated financial report IBERSOL SGPS, SA counts with 38 subsidiaries, 37 of them totally owned by the firm and one shared controlled company. The consolidation process is done in accordance with the International Financial Reporting Standards (IFRS).
Table 4: Company portfolio (Source: Company data)
The company offers different types of services within the food sector. It operates through traditional restaurants segment, composed by 224 restaurants where, during 2017, activities generated revenues upper than €103 million. The second segment is known as counters. This segment counts with 301 restaurants and a total revenue of €206 million, in 2017, representing around than 45% of the company total sales. The last segment identified includes services of Catering and concessions, such as kiosks, service areas in motorways and airports, and other less representative. Concessions businesses involve 121 sale vending units and in 2017 services originated around €138 million of euros. This segment more than triplicated its revenues from 2016 to 2017. This spike in sales was straight related with EOG portfolio, highly focused at the concessions business. This “EOG Factor” was observed within the three segments, please check Table 5: Revenues per operational segment, 2014 - 2017 (Source: Company data). All the segments are exposed and described in the Appendix 28: IBERSOL Business Portfolio description.
Table 5: Revenues per operational segment, 2014 - 2017 (Source: Company data)
Revenues per segment 2014 2015 2016 2017
Restaurants 66.95 69.14 80.65 103.45 Counters 97.32 119.13 150.08 205.86
Other 23.19 25.44 39.10 148.80
IBERSOL core operations are based in Portugal and Spain. However, the company expanded its services, in 2012, to Angola and in 2016, with the acquisition of the Eat Out Group (EOG), to Italy and India. India investments were promptly ceased. Currently, despite owning activities through Angola, Italy, Portugal, and Spain, African and Italian revenues are incomparable small. Thus, for financial analysis, Angola figures are included in Portugal results and Italian in the Spanish.
The EOG included Ibersol portfolio on the 31st October 2016. The company operates in the food sector in Spain. Through this acquisition, Ibersol acquired 13 new brands and 9 concessions on airports and train stations. The group counted with 2.181 employees and an EBITDA (earnings before interest, taxes, depreciation and amortization) of 16.4 million of euros. By the end on 2016, Ibersol increased its portfolio for a total 667 stores of which 163 franchised and 504 own (Appendix table 42: Stores distribution by region (Source: Author)). Spanish revenues stake increased from around 22% in 2015 to 48% in 2017 when comparing with total revenues on each year; representing an effective rise of more than 400% from 2015 to 2017. EOG investment policy contained a wide range of franchise agreements. The increase of this business was directly
Shared services Core Business
Restaurants Counters Others (PT & SP)
Administrative Pizza Hut (PT) KFC (PT) (AN) Service areas Logistics Pizza Hut (AN) BurgerKing (PT) (SP) Catering Management
control Pasta Café (PT)
Pans & Company
(PT) (SP) Airports
Development Pizza Móvil (SP) Miit (PT) Others
Finance
True American Barbecue
(SP) Coffee Kiosks Legal Santamaria (SP) Marketing FrescCo (SP) Food safety Human Resources €-€2.00 €4.00 €6.00 €8.00 €10.00 €12.00 0.00 100.00 200.00 300.00 400.00 500.00
Revenues Share price Figure 3: 10Y Revenue and Share price (Source: Reuters and Company data)
48.78 48.78 73.97 214.67 164.92 164.92 195.86 233.66 0.00 50.00 100.00 150.00 200.00 250.00 2014 2015 2016 2017 Spain Portugal
Figure 5: Revenues per region (Source: Company data) 35.7% 32.4% 29.9% 22.6% 51.9% 55.7% 55.6% 44.9% 12.4% 11.9% 14.5% 32.5% 0.0% 50.0% 100.0% 2014 2015 2016 2017
Restaurants Counters Other Figure 4: Revenues per segment 2014-2017 (Source: Company data)
0 200 400 600 800 2014 2015 2016 2017
Portugal Spain Angola Other Figure 6: Stores per segment (Source: Company data)
reflected in the “Other operating income” that faced an increase from €2.23 million to €9.09 million from 2015 to 2016. During 2017, franchising policy have been reviewed, resulting in a decrease of 19 franchised stores during that year.
Table 6: EOG acquisition impact in IBERSOL revenues (Source: Company data)
Revenues (Million €) 2012 2013 2014 2015 2016
TOTAL 171.30 1.73 187.50 213.70 269.80 IBERSOL without EOG 171.30 1.73 187.50 213.70 246.89
EOG 22.94
The subsidiaries englobe several companies dispersed within Spain and Portugal. These companies are strategically oriented in accordance with the plans and objectives of the mother company. Ibersol detains the representative power for use and exploits the name of several international brands, using them within different subsidiaries. However, the conjugation of subsidiaries facing each brand is not direct from an outsider point of view.
A double segmentation, operational and geographical is the model that best fits in this case. However, segmentation matrix cannot be applied for the entire model once access to such detailed information is limited. Revenues are going to be estimated independently for each company in accordance with the following geographical presence: Portugal, Spain or both (Appendix table 13 - Revenue estimative and new stores per segment (Source: Author). Analyzing the EBITDA values and ratio it is possible to identify the counter segment as the most profitable and the most efficient. In general, from a functional point of view, all the segments increased their EBITDA ratios from 2014 until 2016. This fact is an indicator of decreasing costs and major efficiency. However, in 2017, a strike back was verified. This reflects the full integration of EOG operations in IBERSOL accounts.
Ibersol operates in a highly competitive sector where the control of cost can be a key factor for profitability. Analyzing the company operational costs the following key factors are identified: the costs of the materials, labor force, rentals, royalties and electricity, water fuel and other fluids. Real estate prices variation, employment rate, energy and water industry, the commodities prices, taxation rules and the investment licenses for external brands and concessions are the principal areas to analyze.
As key drivers for revenues, the following factors were identified: sector demand evolution; the economic environment, namely inflation, gross domestic product (GDP) growth and employment rates and tourism evolution. These factors directly influence demand on food sector.
Ibersol is reinforcing its presence in the Iberian markets. The acquisition of EOG is proof of it. Portfolio diversification is also one of the objectives of the group. Allied to the stated two strategies it is safe to assure that the company is increasing its value through synergies and business model optimization.
The groups are also investing in advertising and propaganda. Expanding brand awareness within the markets is saw as a strategic play for solidifying the company’s market share.
As explicit in the following table, on December 2017, IBERSOL was owned in around 76% by qualifying shareholders. ATPS – SGPS has the larger quote of shares with, nearly, 54.92% of the company. The second larger investor with a 10.56% stake is Bestinver Gestion and the remaining four entities keeps a portion inferior to 4%.
Table 8: Qualifying shareholders structure on 31/12/2017 (Source: Company data)
Nº Shares Percentage
ATPS - SGPS, S.A. 16,476,749 54.92%
Bestinver Gestion 3169167 10.56%
FMR LLC 915,000 3.05%
Magallanes Iberian Equity FI 888,536 2.96%
Norges Bank 856,858 2.86%
Banco BPI, S.A. 600,000 2.00%
IBERSOL, SGPS, SA plays the role of the main company, the holding, and its consolidated financial statements resume the activities of more than its 30 subsidiaries, present in Table 9: Subsidiaries on 31/12/2017 (Source: Company data) plus the results from one jointly controlled entity. EBITDA (€ M) 2014 2015 2016 2017 Restaurants 7.00 8.69 12.79 16.82 Counters 15.30 20.78 26.49 32.07 Other 3.09 3.23 7.82 16.39 Total 25.39 32.70 47.11 65.28 EBITDA ratio 2014 2015 2016 2017 Restaurants 10.46% 12.57% 15.86% 16.26% Counters 15.72% 17.44% 17.65% 15.58% Other 13.54% 12.89% 20.18% 11.90% Total 13.54% 15.30% 17.46% 14.25%
Table 7: Company EBITDA and EBITDA ratios, 2014-2017 (Source: Company data)
24.21% 3.19% 15.98% 3.25% 3.78% 24.22% 6.38% 18.99%
Principal Operational Costs (2017) Cost of sales
Electricity, water, fuel and other fluids Rents and rentals Royalties Advertising and propaganda Salaries and wages Social security contributions Other
Figure 7: Principal Operational Costs from 2017 (Source: Company data)
54.92% 10.56% 3.05% 2.96% 2.86% 2.00% 13.65% 10.00% ATPS - SGPS, S.A. Bestinver Gestion FMR LLC Magallanes Iberian Equity FI Norges Bank Banco BPI, S.A. Others OWN Shares
Figure 8: Shareholder structure on 31/12/2017 (Source: Company data)
3.
Management and Corporate Governance
IBERSOL, SGPS, has a share capital of 30,000,000 euros represented by 30.00.000 shares with a nominal value of 1 euro each. The firm owns near 10% of its shares, more exactly 2.999.938 units. All the shares are transacted in the EuroNext Lisbon stock exchange and since 20 March 2017 the company integrates PSI20, the main Portuguese stock index.
On the 15th June 2018, the company went through a capital increase by incorporation of reserves. This was a neutral process for the shareholders that had their portfolio increased, one new share for each five owned. With the increase IBERSOL issued new 6.000.000 shares, having now a total of 36 million shares with the same nominal value.
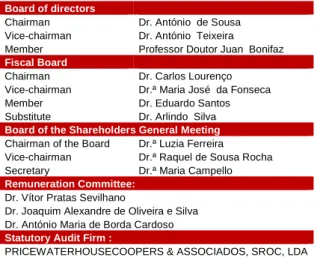
Regarding the governance model adopted, IBERSOL follows the classical monist model composed by the Board of Directors, the Audit Commission, and the Statuary auditor. This model, also known as Latin Model, combine the two perspectives of corporate governance, instrumental and institutional. Normally, chairman and vice-chairman tend to concentrate all the powers and large shareholders tend to be the more important stakeholders. The company control is mainly predicted by laws and regulations, and strategies are built considering the long-term economic relationships.
Board of directors is composed for three elements who are responsible for administrative and manage all activities related to the corporate object; determine and review the company main strategies, and oversee the work of Executive Committee. This commission is chosen by the board of directors and is responsible for management and reporting the operational processes and activities of the business. The executive committee is the bridge between unit’s top managers and corporate administration. IBERSOL executive committee is composed for the board of director’s chair and vice chairman. The operational administration of the firm vast portfolio was distributed by both members.
The Fiscal board and statutory auditor are responsible for auditing the company in accordance with company and public laws. The first one is composed for four members as can be seen in Table 10: Governance model (Source: Company data), the second regards Price Water House Coopers & Associates – Sociedade de Revisores Oficiais de Contas, Lda represented by Dr. Hermínio António Paulos Afonso. For both cases, the positions are discussed and agreed in the General Meeting. Statutory auditors chosen for a period of one year and for the remaining positions presented within the table, legacy has a duration of four years (more recent one, 2017-2020).
Remuneration policy agreed in the General Meeting coordinates the remunerations of the Board of Directors and Audit Committee. There are no further variable bonus or other remunerated objectives to be paid to the executive corporate governance.
Table 10: Governance model (Source: Company data)
Board of directors
Chairman Dr. António de Sousa
Vice-chairman Dr. António Teixeira
Member Professor Doutor Juan Bonifaz
Fiscal Board
Chairman Dr. Carlos Lourenço
Vice-chairman Dr.ª Maria José da Fonseca
Member Dr. Eduardo Santos
Substitute Dr. Arlindo Silva
Board of the Shareholders General Meeting
Chairman of the Board Dr.ª Luzia Ferreira Vice-chairman Dr.ª Raquel de Sousa Rocha
Secretary Dr.ª Maria Campello
Remuneration Committee:
Dr. Vítor Pratas Sevilhano
Dr. Joaquim Alexandre de Oliveira e Silva Dr. António Maria de Borda Cardoso
Statutory Audit Firm :
PRICEWATERHOUSECOOPERS & ASSOCIADOS, SROC, LDA Dr. Hermínio António Paulos Afonso
The structure of the firm at a corporate level, namely, the delegation and reporting processes within the firm segments, turns the information flow logical and pragmatic. Reporting and functional information flows from the operational basis to executive committee and consequently to board of directors. In the opposite direction board of directions spread their values, strategies guidelines and plans through an executive committee which is responsible for turn it into practical terms.
Subsidiaries Dec-17
Iberusa Hotelaria e Restauração, S.A. 100%
Ibersol Restauração, S.A. 100%
Ibersande Restauração, S.A. 100%
Ibersol Madeira e Açores Restauração, S.A. 100%
Ibersol - Hotelaria e Turismo, S.A. 100%
Iberking Restauração. S.A. 100%
Iberaki Restauração, S.A. 100%
Restmon Portugal, Lda 61%
Vidisco, S.L. 100%
Inverpeninsular, S.L. 100%
Ferro&Ferro, lda. 100%
Asurebi SGPS, S.A. 100%
Charlotte Develops, SL 100%
Firmoven Restauração, S.A. 100%
IBR - Sociedade Imobiliária, S.A. 100%
Eggon SGPS, S.A. 100%
Anatir SGPS, S.A. 100%
Lurca, S.A. 100%
Q.R.M.- Projectos Turísticos, S.A. 100%
Sugestões e Opções - Actividades Turíticas, S.A. 100% Resboavista - Restauração Internacional, Lda 100%
José Silva Carvalho Catering, S.A. 100%
Iberusa Central de Compras para Restauração ACE 100% Vidisco, Pasta Café Union Temporal de Empresas 100% Maestro - Serviços de Gestão Hoteleira, S.A. 100%
SEC - Eventos e Catering, S.A. 100%
IBERSOL - Angola, S.A. 100%
HCI - Imobiliária, S.A. 100%
Gravos 2012, S.A. 100%
Lusinver Restauracíon,S.A. 100%
The Eat Out Group S.L.U. 100%
Pansfood, S.A.U. 100%
Foodstation, S.L.U. 100%
Dehesa de Santa Maria Franquicias, S.L. 50%
Pansfood Italia, S.R.L. 100%
Control shared companies Dec-17
UQ Consult - Serviços de Apoio à Gestão, S.A 50%
CMVM’s corporate governance
recommendations A R
I Voting and control of the company (*) 4 5 II Supervision, management and oversight 13 15
II.1 Supervision and management (*) 8 10
II.2 Supervision 5 5
III Remunerations settings (*) 3 5
IV Remuneration 3 8
V Auditing 3 3
VI
Conflicts of interest and related party
transactions 2 2
VII Information 2 2
Total 30 40
A- Approved R - Recommendations
(*) all the non-approved recommendations were not applied as they were not applicable.
Table 9: Subsidiaries on 31/12/2017 (Source: Company data)
Table 11: CMVM’s corporate governance recommendations (Source: Company data)
Apart from chairman and vice-chairman, no other executive member owns, directly or indirectly, company shares. By the end on 2016, the chairman, Dr. António Alberto Guerra Leal Teixeira, and Chairman, Dr. António Carlos Vaz Pinto de Sousa, owned 1,680 shares, each, of the capital of IBERSOL, SGPS, SA.
Both characters perform several functions in the governance administration of several IBERSOL subsidiaries and other external companies. Dr. Sousa has been vice chairman of the company since 1991 and Dr. António Teixeira had been the chairman of IBERSOL since 1997. In the general meeting of 2017, the administration proposal was approved by almost 87% of the voting capital. To the mentioned meeting the percentage of the represented share capital was slightly above 78%.
Together, the president and vice president of the board of directors “own” more than 50% of ATPS - SGPS, S.A., Ibersol larger investor, with a quote of near 55%. Attending on the corporate governance model adopted and the shareholder structure, it is safe to affirm that power and influence is highly concentrated in Mr. Teixeira and Mr. Sousa. From the investor perspective, the voting power owned by both president and vice president might be a constraint.
As we are able to observe in Table 11: CMVM’s corporate governance recommendations (Source: Company data), from a total of 40 CMVM legal indicators and recommendations the firm adopted 31. The remaining nine were not suitable for the application. It suggests that CG strategies and information disclosures are done transparently.
For the internal control and risk management, there are specifies departments that grant the sustainable continuity of the business: food quality and food safety, health and safety at work, financial, environmental, legal and sector-specific.
4.
Industry Overview and Competitive Positioning
Iberia Economic outlookFocusing on Iberia, Portugal, and Spain follows identical macroeconomic trends. The economy is growing and recovering from the harshness enhanced by the 2008 crisis. Countries are facing an economic growth of 2.7% and 3.10% respectively, with both countries performing above the average of Western Europe average. International Monetary Fund (IMF) projects that GDP evolution slowly decreases until 2022, where values are estimated at 1.2% for Portugal, 1.7% for Spain and 1.5% for Western Europe. After the GDP increase, it is possible to identify a generalized increase in prices. In accordance with IMF, inflation rates, recovering, in the case of the two mentioned countries, from values under 0 (deflation), have reached their top on 2017 with values of 1.6% and 2%, for Portugal and Spain, respectively, being Western Europe between such figures with 1.7%. It is expected that inflations values positively converge, ending 2022 close to 2%. Also related to the current positive economic cycle, unemployment is expected to decrease. In Portugal, it is expected to decrease from 8.9% in 2017 to 5.6%; in Spain, such progression is estimated to be wider; however, for 2022, the unemployment rate in Spain is still projected to 13.7%, above Western Europe forecasted average of 7.40%.
Positive economic environment between Europe and in special emphasis on Portugal and Spain and it reflect a proper background for companies to strength and grew. Interest rates are still recovering from the financial crisis triggered in 2008. EURIBOR rates continue below 0 for all the maturities; although, projections predict the increase of the cost of debt. From the investment perspective, despite the current low leveraging costs, financing expenses will rise.
Demography is considered an important factor for the company performance once it is directly linked to the overall demand. Iberian countries are passing a negative stage in what concerns demographical evolution. However, the negative impact expected from the decreasing populations is being overtaken for the increasing travel demand. Travel expenses growth expected for Portugal, Spain, and Western Europe for the following 5 years, are, on average, of 5.69%, 5.16% and 3.18%, respectively. Increase in tourism is directly associated with the increase in the foodservice demand.
Costs prices are also affected by the positive economic environment. Despite no predictions for the extraordinary increase in the raw materials that include the Ibersol COGS group, some other costs are expected to increase above the inflation estimates. Rents and Costs with employees are two main expenses to the firm and also critical in what concern the price projections. The company has been, in the recent past, affected for an increase in labors wages. The impact from increases in gross minimum monthly wages in Portugal and Spain has been felt in the accounts. Under the prosperous economic projections for the near future, minimum wage, and salaries in general are likely to keep increasing in Portugal and Spain.
Consumer foodservice evolution - Industry
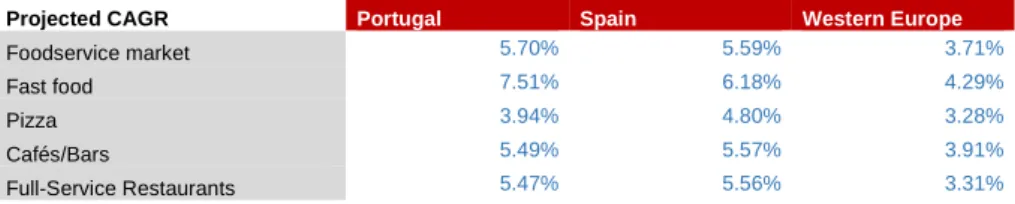
Iberian foodservice market for the food sector is expected to reach almost €90B in 2018. Spanish market has more than 10 times the size of Portugal, representing a potential market and justifying the 2016’s Ibersol investment. Until 2021 Portugal is estimated to maintain an annual evolution above 5%, reaching values above 6.5% on 2018. Such growth is predicted to be more stable for Spain, where the annual evolution rate is expected to reach the 5% reference in 2018 and to maintain above it, at least, until 2022. For the general foodservice demand, Western Europe is expected to maintain an increasing pace varying between 3.32% and 3.77%. Comparing with general European competitors, Ibersol benefits from an expected superior increase in the markets where it maintains the core its activities.
Table 12: Projected CAGR per business type and geography (Source: Euromonitor database)
Projected CAGR Portugal Spain Western Europe
Foodservice market 5.70% 5.59% 3.71%
Fast food 7.51% 6.18% 4.29%
Pizza 3.94% 4.80% 3.28%
Cafés/Bars 5.49% 5.57% 3.91%
Full-Service Restaurants 5.47% 5.56% 3.31%
Ibersol activities, as previously analyzed, are decomposed in restaurants, counters, catering, concessions, and others. But when comparing with the sector it can be divided into the groups present in Table 12: Projected CAGR per business type and geography (Source: Euromonitor database), Fast Foods, Pizza, Cafés/Bars, and Full-Service Restaurants. Analyzing the projections for each sector and cross-checking it with the Figure 15: Ibersol vs market vs economic environment 2013-2017- secondary axis for company revenue evolution - (Sources: Euromonitor database; Company data; IMF2018 data), it is possible to conclude that Ibersol
-1.00% -0.50% 0.00% 0.50% 1.00% 1.50% 2.00% 2.50% 3.00% 0.00% 5.00% 10.00% 15.00% 20.00% 25.00% 30.00% 2012 2014 2016 2018 2020 2022
Portugal Un. Spain Un. Western Europe Un. Portugal CPI Spain CPI Western Europe CPI Figure 10: Inflation forecast (Source: IMF 2018 data) 0 200 400 600 800 1000 2013 2015 2017 Portugal Spain
Figure 11: Gross minimum monthly Portuguese and Spanish salary (Source: Eurostats database)
0.00% 2.00% 4.00% 6.00% 8.00% 2017 2018 2019 2020 2021 2022
Portugal Spain Western Europe
Figure 12: Tourism evolution indicators (Source: Euromonitor database) -5.00% 0.00% 5.00% Portugal Spain Western Europe -10.00% -5.00% 0.00% 5.00% 10.00% 2013 2015 2017 2019 2021
Portugal Spain Western Europe
Figure 9: Foodservice market evolution (Source: Euromonitor database)
explores a major stake of its services on the fast-food sector, the one with the higher estimated growth rates. Cafés/Bars sector highly increased its weigh on the company portfolio from 2016 to 2017. This was due to the integration of EOG, which, as already stated, included a wide range of concessions. It is important to understand, when analyzing the above table, that Pizza growth rates are not independent, meaning that all pizza services, being full restaurants, fast-food or other, are concerned.
Disregarding Cafés/Bars segments, majorly included in the operational segment “Concessions and Catering” all the remaining business are very likely to be considered fast food. Restauration / Counter differentiation is based on the logical division providing, or not, the table service. Figure 15: Ibersol vs market vs economic environment 2013-2017- secondary axis for company revenue evolution - (Sources: Euromonitor database; Company data; IMF2018 data)
Comparing the different economic sector and company indicators exposed on Figure 15: Ibersol vs market vs economic environment 2013-2017- secondary axis for company revenue evolution - (Sources: Euromonitor database; Company data; IMF2018 data), it is possible to perceive the company’s sales are largely increasing above the average for the sector. However, high revenues registered for the years of 2016 and 2017, 29.17% and 64.24%, when compared with the previous year, are erroneous. Such comparison does not normalize the EOG acquisition, thus, it isn’t an accurate measure of Ibersol performance vs sector and economic growth. Nevertheless, when analyzing the years prior to 2016, it can be perceived that Ibersol operated always above from fast food sector (Iberian), general foodservice (Iberian) and European GDP growth. This industry shows very similarities with both countries economic growth.
Market Sub - Sector
Evolution within the foodservice market in Portugal and Spain combined is predicted to slowly converge to an annual growth of 5%. As already identified, fast-food services are expected to overperform the average, what represents an opportunity to Ibersol.
Ibersol portfolio faces several competitors and they can act as direct or indirect competition. The
indirect competition provides substitute products and services. Supermarkets are identified as a substitute service for food. Homemade meals directly affect food market services. For example, in a situation of overall economy constraints, it is expected that consumers avoid the food services in detriment of the supermarkets and consequent homemade meals.
Another important breakdown of direct competitors regards its ownership and environment in the food sector. There are two distinct type of firms, the chained and the independent firms. Ibersol is a perfect example of a chained company acting in this sector once it owns several food chains. The overall fast-food market is majorly controlled by chained companies. In accordance with Euromonitor, by the end of 2022, around 72% of the total consumer foodservice market will belong to food chains. Attending the Figure 13: Fast food market evolution (Euromonitor database), it is
0.00% 10.00% 20.00% 30.00% 40.00% 50.00% 60.00% 70.00% -4.00% -3.00% -2.00% -1.00% 0.00% 1.00% 2.00% 3.00% 4.00% 2013 2014 2015 2016 2017
European annual GDP growt Iberian foodservice
European foodservice IBERSOL Revenues
11% 28% 7% 5% 53% 44% 3% 5% 26% 17% 2016 2017
Cafés/Bars Catering & other Fast Food Full-Service Restaurants Pizza Consumer Foodservice
-5.00% 0.00% 5.00% 10.00%
2013 2015 2017 2019 2021
Iberian market combined - Forecast
Foodservice market Fast food Pizza
Cafés/Bars Full-Service Restaurants
-4.00% -2.00% 0.00% 2.00% 4.00% 6.00% 8.00% 10.00% 2013 2015 2017 2019 2021
Portugal Spain Western Europe
Figure 13: Fast food market evolution (Euromonitor database) 0.00% 5.00% 10.00% 15.00% 20.00% 25.00% 1,000.00 2,000.00 3,000.00 4,000.00 5,000.00 6,000.00 7,000.00 8,000.00 9,000.00 2012 2014 2016 2018 2020 2022 Spain Portugal Europe (%) Spain (%) Portugal (%)
Figure 17: Chained consumer food-service total sales and evolution (Source: Euromonitor database)
Figure 14: Revenues per business typology (Source: Author and Company disclosures)
Figure 16: Foodservice market and sub segments forecasted evolution (Source: Euromonitor database
possible to identify the companies with a major market share on the consumer foodservice sector. All of such companies corresponds to chained firms.
Competitive positioning Differentiation and Adaptability
Breaking down Ibersol portfolio the following specific services are covered: bakery, burger, chicken, Pizza stores, coffee and bars, healthy fast-food, tapas, traditional restaurants, and pasta services. Such services correspond to different ways of exploring the above-mentioned sectors: fast-food, full restaurants, coffee and bars, and Pizza food services.
This differentiation allows Ibersol to compete within a wider range of foodservice areas and it is perceived as an adaptation of the firm in accordance with the market trends and feelings. Demand structure is being impacted for a healthy tendency to which Ibersol responded with Pasta Café, Miit and O’Kilo adapting for this type of service.
Another increasing trend that Ibersol identified and to which the firm reacted was the increasing demand for snacks. These particular services were present, naturally within the Ibersol Coffee and Bars segment; however, especially in the counter segments, it was being disregarded. Ibersol actions facing this trend turned this rising threat in an important opportunity. Counters stores, most of them belonging to the fast-food segment, readapted their service offers including snacks offers, namely, the breakfast and lunch snack menus.
Expanding the business
Ibersol is an active company, especially in the Iberian market. At the end of 2016, with the acquisition of the EOG, its presence was reinforced in Spain specifically and within the Iberian foodservice sector. EOG portfolio was also composed of Italian and Indian stores. Indian ones were ceased promptly, reflecting the refusal from Ibersol to invest in Asia; Italian ones are still held by the firm (trough franchising agreements), what suggests that is the possibility to Ibersol invest within Italy or other European countries.
Although the company presence in Angola, investments in this market are suspended. The ongoing political and economic crises generated a negative environment for the business and brought severe constraints at management and logistic level. Analyzing from a different perspective, the presence in Angola can be a tremendous advantage when the turning of this negative cycle. Once the company is already established in the country, logistic and bureaucratic processes are already set and the competitor rivalry is, comparatively with Europe, inferior, Ibersol faces a privileged position to explore the market when an economy recovering emerge. Costs analysis
As mentioned, when analyzing the economic outlook, along with the increase in sales, costs are expected to rise as well as interest paid on debt. Financing and operational costs are predicted to negatively impact efficiency ratios. Such decreases are expected to be transversal to all companies within the sector. In accordance with what is forecasted, it is possible to observe (Table 14: EBITDA margin for foodservice sector in European companies with market capitalization similar with IBERSOL (Source: Reuters)) that EBITDA from companies within the sector is slowly decreasing since 2016.
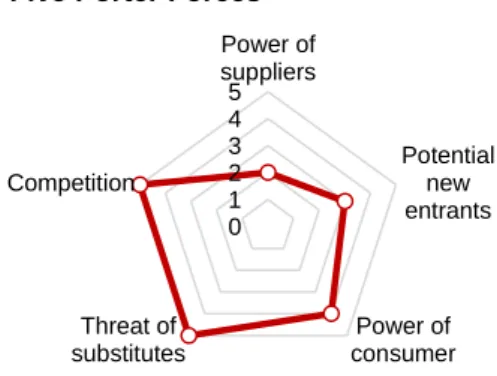
Analyzing the sector in accordance with the five Porter forces, it is possible to identify the restauration and, more specifically, fast food industry as an extreme fierce market. With a strong competitive rivalry, the industry is characterized for a large number of competitors with low market shares. There is also a high level of threat of substitutes; there are no switching costs from the client perspective and there is a high availability of substitute products, brands and submarkets. Within the industry, the consumer owns a significantly high power, sensitive to the branding and to price. Potential new entrants represent a medium risk, a considerable medium initial investment is required but it is difficult and expensive to become a known brand. Economies of scale can also affect the revenues from the new / senior companies within the sector. For another side, the suppliers are also vast. There is a large supplier offer and markets and low power from the supplier perspective.
Ibersol trust in their long and healthy relations with the supplier as a form of protecting against some aggressive market practices that might arise resulting from the cost increase fierceness. All the business expansion and portfolio modifications are accompanied by investments in managing, logistics, and planning. Increase on the centralization of the supply chain enables the firm to reduce costs, thus, create value. New technologies and the increasing usage and offer for mobile application is also a key factor within the market. Applications such as Uber Eats and Glovo are reinventing the delivery food services. Innovate within such companies and technologies is crucial to maintaining the business market share. The company is aware of such changes and developing relations with these logistic market intervenient. Arm-in-arm with the expansion and adapting of the business, employee’s valuation also represents a fundamental role. Employees are the support of a well run the company and successful operations.
Portugal Spain
McDonald's Corp McDonald's Corp Yum! Brands Inc Restaurant Brands
International Inc Restaurant Brands International Inc Telepizza Group SAU Café 3 Restauração SA Restalia Grupo de Eurorestauracion SL Telepizza Group SAU Alsea 2014 2015 2016 2017 Average 7.13% 10.87% 10.44% 9.43% 0 1 2 3 4 5 Power of suppliers Potential new entrants Power of consumer Threat of substitutes Competition
Five Porter Forces
Table 13: Main competitors per geographical segment (Source: Euromonitor
Table 14: EBITDA margin for foodservice sector in European companies with market capitalization similar with IBERSOL (Source: Reuters)
Figure 18: Five Porter Forces for foodservice sector (Source: Author)
Creating value to the client and foster its relation is the main objectives to fulfill. Client focusing is one of the main strategies to obtain a higher market share and client loyalty, especially in the fast food market where there are a huge offering and no costs associated to the client when switching from one brand to another. To achieve such goals, apart from investment in the services offered, Ibersol intensified its activities in the social networks and also embraced projects concerning social responsibility. Both processes spread the name of the company and lead the customer to identify his ideals with Ibersol ones.
5.
Investment Summary
Ibersol valuation through the discounted cash flow (DCF) methodology leads us to a target price of €9.70 2019YE and a respective upside level of 13%, from 26th October 2018. The recommendation is neutral with medium risk. Analyzing the company within enterprise value multiples the price target was of €12.05 and €12.54 for EV/EBITDA and EV/ Sales, respectively. In what concerns to price multiples, P/E valuated the company in 11.21€, Price to Book in €11.29 and Price to Sales in €11.26. All multiples support the positive although timid outlook.
Company operations were divided in three main operational segments: (i) restaurants, (ii) counters and (iii) concessions and catering and others, a less expressive segment. The segmentation for the purpose of valuation is further narrowed to sub segments accordingly to the type of business activities. Against with what was desirable due to the unavailability of information, not all the segments have been divided in accordance with the operational geographical division. It is important to state that Angolan inexpressive revenues were included in Portugal figures. Economic growth, Unemployment, and tourism have been identified as the main three drivers for the sector. Depending on the location of Ibersol business, each driver impacts the company differently. In general, the foodservice market is facing a growing phase, with special emphasis within the fast food sector. This brings the company a great environment to solidify their presence in the current markets. Attending on the past performance and on the current and expected competitive positioning within the industry, it is expected that Ibersol revenues increase at a greater pace that this market.
Similar to revenues, operational costs are also expected to increase. During 2017, with the changes in gross minimum wages, the company faced some strike on personnel costs. Until 2022, it is expected that this element reaches almost 25%. Rents are the third main cost to the firm and the one that is predicted to increase at a higher pace with a CAGR of 8.62%. Regarding this rubric, it is assumed that for the future, the percentage of owned stores vs rental ones will be the same as in 2017.
Conservative position facing debt despite bringing a solidify and reliable image for the firm, providing great liquidity ratios and a capitalized structure, also affects the firm valuation when calculation weighted average cost of capital (WACC). As normal, it is estimated a cost of equity higher than the cost of debt. For the terminal period, cost of debt is estimated to correspond to 3.404% while the cost of equity is foreseen to reach 6.195%. Conjugated with the capital structure, still, for terminal growth, it will result in a WACC rate of 5.462%.
Terminal growthis also considered a key factor whenvaluing the company. It is projected as 1.91% and was calculated in such a way that predicts the growth of the company facing the market and the prospects for the overall European economy.
Company Risks
Attending on the company industry one of the main risks associated are the trends. Demand patterns are consistently changing and the company needs to continue to adapt to the market in accordance with changes in demand. Increasing costs also represent a threat to the business. The increase in minimum wages, like happened in 2017, the growing rental prices and raw materials or commodities hyperinflation are examples of changes that will highly impact firm profits. It is also important to refer that the company highly depends on its worker. Labors are one of the main costs for the firm, thus its efficiency is crucial, but also because workers are the point of contact with clients. A good service might be a key for client satisfaction.
Angola investment is also a risk. But for another side it might also be considered a segment of huge potential. Being already present in the Angolan market, the company faces, comparatively with Portugal and Spain, lower competition. As soon as Angolan economy recover, Ibersol have a change to reinvest in this market and to assume an important place within the fast-food sector of the country.
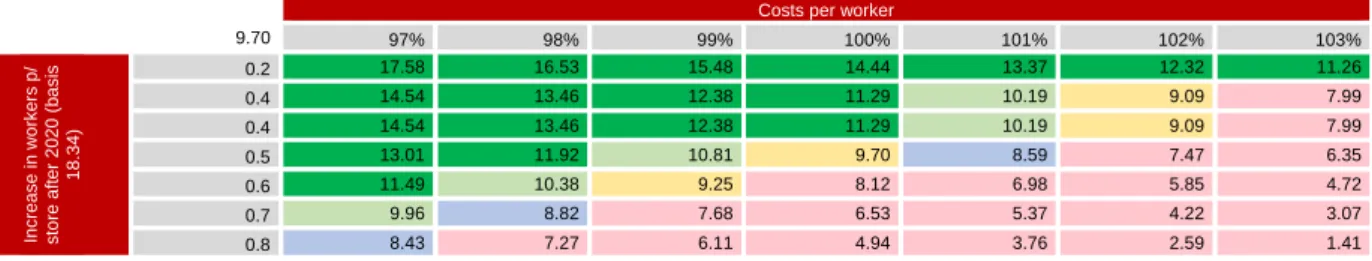
Table 17: Personnel costs tests:Cost per worker vs number of workers per store.
Costs per worker
9.70 97% 98% 99% 100% 101% 102% 103% In cr e a se in wo rke rs p / sto re a ft e r 2 0 2 0 ( b a sis 1 8 .3 4 ) 0.2 17.58 16.53 15.48 14.44 13.37 12.32 11.26 0.4 14.54 13.46 12.38 11.29 10.19 9.09 7.99 0.4 14.54 13.46 12.38 11.29 10.19 9.09 7.99 0.5 13.01 11.92 10.81 9.70 8.59 7.47 6.35 0.6 11.49 10.38 9.25 8.12 6.98 5.85 4.72 0.7 9.96 8.82 7.68 6.53 5.37 4.22 3.07 0.8 8.43 7.27 6.11 4.94 3.76 2.59 1.41 IBERSOL, SGPS, SA 16-Oct-18 8.56 31-Dec-19 DCF method 9.70 Up rise potential 13%
Recommendation: NEUTRAL
WACC Equity Debt
2018 4.54% 69.53% 30.47% 2019 4.65% 71.02% 28.98% 2020 4.77% 72.37% 27.63% 2021 4.90% 73.65% 26.35% 2022 4.98% 73.73% 26.27% Terminal 5.46% 73.73% 26.27% Table 16: WACC and capital structure (Source: Author) 0% 20% 40% 60% 80% 100% Other
Concessions and Catering Counters
Restaurants
Figure 18: Revenues per segment (Source: Company disclosures and Author)
Table 15: Investment recommendation (Source: Author)
6.
Valuation
DCF valuation model was applied in order to value the firm. This choice was made after analyzed and perceived the following company characteristics: uncertainty concerning the dividend policy; expected positive cash-flows; capital reinvestment policy; estimated stable growth and a slow deleverage policy. Due to this last factor, the free cash flow to the firm (FCFF) as chosen. DCF valuation was computed in accordance with the two-stage FCFF Model, where a 5 year forecast, until 2022, was performed together with a terminal valuation calculated from 2023 onwards. In order to evaluate the firm within the industry, a relative valuation through market multiples was also performed. Ibersol’s peer group was identified and a valuation was performed through enterprise value multiples, EV / EBITDA and EV / Sales, and price multiples, Price to earnings, price to book and price to sales.
Revenues
For estimation purposes, five factors have been identified and forecasted: general and specific foodservice markets, tourism, YoY real GDP and unemployment. For each driver in Portugal, Spain, and Western Europe forecast information was gathered and managed in order to achieve the final annual rate growth. Forecasts are applied to four segments: restaurants, counters, catering and concessions and others.
Table 19: Revenues estimators drivers (Source: Author)
A basket, with the estimator weights for each driver, was computed. The weights change in accordance with the company segment. Such proportions can be observed in the above table. These estimators reflect the different impacts the drivers hold in different segments. For example, tourism driver is expected to have a greater impact within the sectors directly connected to tourism, SOL and Travel. The estimator ponderation was attributed in accordance with historical sector data analysis. Other operating income, mainly composed of franchise income, is forecasted in accordance with the Western Euro general food market evolution.
All the factors have a positive impact on the expected revenues, except the unemployment rate. This means that a decrease in unemployment will result in a positive impact on the expected market demand.
As analyzed in the previous section, the firm past results overperformed the market evolution; thus, it is safe to state that the company is very likely to perform above the markets in the future as well. To reflect this, a factor has been added to the final estimated calculation. Such factor represents a 4% overperformance for each segment facing the expected evolution.
Through the analysis the sub-segments have been identified in accordance with type and location (Table 20: Sub-segments geographical distribution (Source: Company data). For each type, a different expected annual growth for the “specific market” was applied. Concerning geographical distribution, country data was applied to sub-segments present in only one country. When present both in Portugal and Spain it was assumed that the revenues should follow the Western European forecasts.
Revenues are also directly impacted by the expansion policy. For each new store, in accordance with its segment (restaurant, counter or concession and catering), it is expected that revenue increases in accordance with the subsegment average revenue per store multiplied by an efficiency factor. This factor aims to reflect cannibalization effect and constraints that restrict the demand for the new stores. In this case, we are assuming a factor for each new project of 70%, meaning that each new store will impact the revenues by 30% of the revenue expected to be generated per store. This high cannibalization effect was applied due to fast food market characteristics. ; despite the high demand in the industry, there are several equivalent products and services with no switching costs for consumers. A new store will always be concurrent to the existent ones, thus clients are likely to migrate within Ibersol services.
Investment and replacement policy
Estimators Impact
Fixed Foodservice market +
Variable
Specific market + Travel revenues +
Real GDP YoY +
Unemployment* - Table 18: Revenues drivers (Source: Author)
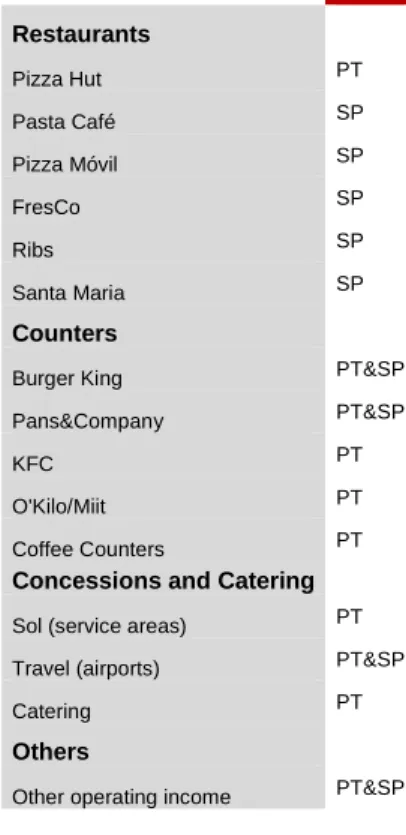
Geo. Restaurants Pizza Hut PT Pasta Café SP Pizza Móvil SP FresCo SP Ribs SP Santa Maria SP Counters
Burger King PT&SP
Pans&Company PT&SP
KFC PT
O'Kilo/Miit PT
Coffee Counters PT
Concessions and Catering
Sol (service areas) PT
Travel (airports) PT&SP
Catering PT
Others
Other operating income PT&SP
Basket: Impact Normal Weight Sol & Travel Weight Other
Foodservice market + 25% 35% 100%
Specific market + 40% 0% 0%
Travel revenues + 10% 55% 0%
Real GDP YoY + 15% 10% 0%
Unemployment* - 10% 0% 0%
Table 20: Sub-segments geographical distribution (Source: Company data)
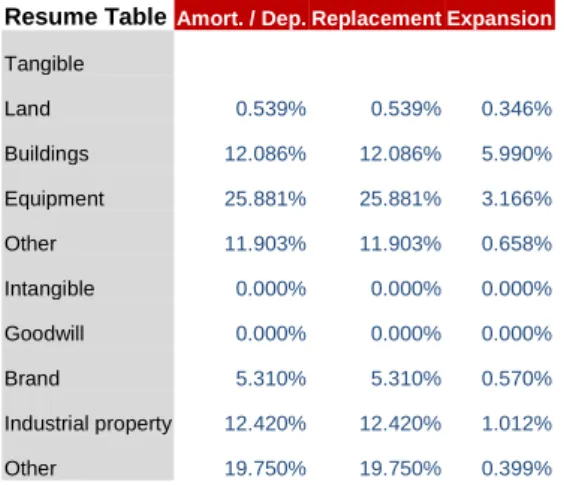
Depreciation will affect fixed tangible assets, namely, Land, Buildings, Equipment and Other. Amortizations will impact intangible fixed assets, such as Brand, Industrial property and other. For the future, it was assumed that amortization shall follow historical rates. For Land, it is applied the average of the effective rates of 2015 and 2016; for buildings, we assumed that the 2017 figure will remain the same; for Equipment and Other rubrics we assumed the average of the last four years, excluding 2016 figures, as it was identified as an outlier. For the amortization’s rubrics, the last four year average was applied. In the case of Brand, as it started to be amortized since 2015 and the value of such year is far from the amortization verified in 2017, we assumed the figures from this last year.
As the rate of replacement, it was assumed the depreciation and amortization rates. The company is stable and reinvestment is forecasted to null the D&A effect.
Expansion rates estimation for all fixed assets was done together. Projections were made upon the company’s disclosures of maintaining the investment pace of the last years and also looking for keeping the same structure observed within the fixed assets. To forecast it (excluding goodwill) the following logic was applied: 1st, normalize the 2016 and 2017 tangible and intangible fixed assets subtracting the amounts disclosed as the increment impact of EOG acquisition (65,000,000 – investment in fixed assets); 2nd, analyze the normalized growth for the previous years (2015-2017). It is projected that the company keeps the same investment pace of 2017; 3rd, decompound the fixed assets structure, averaging the historical data from 2016 and 2017. It is assumed that the company will invest in fixed assets in the same proportion of this structure. This assumption is also supported for the historical date. In periods of investment, the rubrics with more impact in the fixed assets, tend to increase in a higher proportion than the remaining ones; 4th distribute the previously mentioned investment rate through the tangible fixed asset structure. Goodwill is not amortized. Changes in the rubric should result in the new acquisition of companies and/or impairment tests performed annually. It is predicted Goodwill will be maintained for the future. It is assumed no impairment losses or gains will result from the mentioned tests and no future acquisitions are forecasted, thus no increments are expected.
In accordance with such investment, company historical and investment pace disclosure in annual reports, we assume the following stores opening figures (check Table 21: Stores openings (Source: Author) . It is important to understand that these openings are not related to direct investment in buildings, as Ibersol explores several stores through rental contracts. For the future, we predict that the ratio between stores owned and rented will be maintained.
COGS
The historical average rate for the gross margin is applied. The commodities market is very competitive and likely to be stable. Ibersol also looks for improvement and solidification of its relationship with suppliers. For such reasons the investment in COGS is predicted to be constant, representing 23.13% of the total revenues.
Debt structure
Non-Current debt is composed by Bank overdrafts, loans, Commercial papers, derivative instruments, and financial leasing as well. Non-current debt is formed by Bank loans, commercial papers programs, and financial leasing contracts. Long-term debt is a source of strategical financing for the company’s investment and on the opposite side, current loans finance the operational activities. The company sets as the acceptable parameters to maintain the financial leverage ratio (net remunerated debt/net remunerated debt + cash) between 35%-70% interval. Despite such disclosure, before EOG acquisition (2012-2018), the company had always been below the lower limit. It was stated that this was a safeguard facing the financial markets constraints.
When estimating loans rubrics, both short and long-term, it is crucial to analyze the consequences of the indebtedness the group entered in 2016, the growth projections for the firm investment in fixed assets, the sector reference ratios and the company’s positioning face debt. EOG acquisition makes part of a strategical plan that aims to diversify and increase the company's market quote, in this specific case, strengthening the company presence in Spain. The firm debt ratios after the EOG acquisition increased, Total Debt to Total Assets increased from 18.0% in 2015 up to 39.43% in 2016 and Debt to Equity increased from 32% to 110%. Such impact is now being absorbed.
For the future, as previously mentioned, the company assumes keeping investing in new stores, however, no large acquisitions are expected. For such reason long and short-term borrowings are estimated to maintain a similar structure from the past, slowly converging with the sector. For the forecasts, it is assumed that long-term debt will depend directly on the company fixed assets. It was established a reference ratio of 25% between the total fixed assets and the long-term debt. Currently, this ratio stands at 33.04% and it is estimated that it shall reach the reference in four years, constantly converging during this period (2.01% decrease each year).
Stores Opening 2018 2019 2020 2021 2022 Number of stores 512 522 537 552 567 Openings 10 10 15 15 15 Restaurants 150 153 157 161 165 Counters 266 271 279 287 295 Other 96 98 101 104 107
Table 21: Stores openings (Source: Author)
Resume Table Amort. / Dep. Replacement Expansion
Tangible Land 0.539% 0.539% 0.346% Buildings 12.086% 12.086% 5.990% Equipment 25.881% 25.881% 3.166% Other 11.903% 11.903% 0.658% Intangible 0.000% 0.000% 0.000% Goodwill 0.000% 0.000% 0.000% Brand 5.310% 5.310% 0.570% Industrial property 12.420% 12.420% 1.012% Other 19.750% 19.750% 0.399% 2014 2015 2016 2017 Total operating Income 189,639,805 215,939,377 278,922,365 458,110,130 Cost of sales 44,031,371 51,220,642 64,546,632 102,831,054 Average COGS proportion 23.22% 23.72% 23.14% 22.45% 23.13%
Restauration sector reference values 2017
Long-term Debt 84.27%
Short-term Debt 15.73%
Proportion 18.66%
Debt to Asset ratio 31.72%
Debt / Equity 37.05%
Table 24: Sector debt structure (Source: Bloomberg) Table 23: Sales, COGS and historical gross margin (Source: Company data)
Table 22: Amortization, Depreciation, Replacement and Expansion (Source: Author)