Can overtime premium
flexibility promote
employment? Firm- and
worker-level evidence
from a labour law reform
Pedro S. Martins
Working Paper
#607
Can overtime premium flexibility promote employment?
Firm- and worker-level evidence from a labour law reform
∗Pedro S. Martins†
Queen Mary University of London & NovaSBE & IZA
August 29, 2016
Abstract
In 2012, in the midst of a recession, a labour law reform in Portugal allowed firms to reduce the overtime premium paid to their workers by 50% or more. Until then, overtime premiums were set by law at a relatively high level and could not be cut unilaterally. We analyse matched employer-employee panel data, including worker-level base and overtime hours and pay, to shed light on the effects of the resulting greater flexibility in overtime pay setting. We find that half of the firms using overtime in 2011 did reduce their overtime premiums in a manner consistent with the reform, in particular those firms making greater use of overtime and paying higher premiums. Moreover, using difference-in-differences matching and a long list of covariates, we find that those firms that cut overtime premiums exhibit significant relative increases in overtime usage, employment and sales following the reform. Overall, our results highlight the important but not exclusive role of legal restrictions behind downward nominal pay rigidity. Our findings also suggest a significant potential of overtime pay flexibility to promote employment, even during a downturn.
Keywords: Working time, wage rigidity, employment resilience, labour reforms. JEL Codes: J22, J23, J38.
∗
The author thanks Jan van Ours and Richard Upward for helpful discussions and the Ministry of Em-ployment, Portugal, for data access. The author was Secretary of State of Employment in the Government of Portugal in 2011-2013 and was co-responsible for designing and implementing the reform evaluated in this paper.
†
Email: p.martins@qmul.ac.uk. Web: http://webspace.qmul.ac.uk/pmartins. Address: School of Business and Management, Queen Mary, University of London, Mile End Road, London E1 4NS, United Kingdom. Phone: +44/0 2078827472.
1
Introduction
Policymakers worldwide are constantly on the lookout for measures to increase employment, particularly during downturns or when economies are recovering from recessions. This paper examines the potential of a novel combination of two types of measures in this regard, namely working time and wage flexibility. Specifically, we examine the extent to which greater flexibil-ity in the setting of overtime pay premiums may increase employment, including in challenging macroeconomic periods.
Of course, each one of these types of measures have received considerable attention on their own. In the case of working time, the evidence available (such as Hunt (1999), Crepon & Kramarz (2002) or Chemin & Wasmer (2009)) is generally pessimistic about the potential of working time reductions to increase employment, underlining the relevance of the ‘lump of labour fallacy’. In the case of wage flexibility, there is a continuing debate in academia about the magnitude and effects of downward nominal pay rigidity (Fehr & Goette 2005, Dickens et al. 2007, Elsby 2009, Babecky et al. 2010, Martins et al. 2010, Babecky et al. 2012, Caju et al. 2015). However, the comparative evidence from the financial and sovereign debt crises highlights the potential of wage flexibility in promoting employment resilience if one compares Anglo-Saxon and Souther European labour market performances (Carneiro et al. 2014, Doris et al. 2015), particularly in low inflation environments.
In this context, our paper is the first to evaluate the effects of a policy that increases flexibility in the setting of overtime premiums. Our study is based on a labour law reform introduced in Portugal in 2012 which allowed firms to unilaterally reduce their overtime pre-miums. Before the reform, these premiums mainly ranged between 50% and 100%, depending on the type of hours of overtime (e.g. during the week or during the weekend), while after the reform the premiums could be reset to a range between 25% and 50%, again depending on the type of hours of overtime.
The closest papers to ours are Cahuc & Carcillo (2014) and Andrews et al. (2015). The first examines a reduction in the overtime tax wedge in France, finding evidence of a positive impact on overtime hours but no significant impact on total hours. The authors attribute this finding to manipulation of overtime hours declared, in order to reduce tax costs. On the other hand, Andrews et al. (2015) analyse the effect of increased standard hours on employment drawing on evidence from a number of firms in Germany, finding that only overtime plants
increased their employment.
Our study is based on rich matched employer-employee panel data, including information, at the worker level, on base and overtime pay and base and overtime hours. After describing the data in detail, we conduct a two-pronged analysis. First, we examine the take-up of the reform, which we find to be only partial, event if at striking contrast to extensive base pay rigidity. This motivates us, paraphrasing Bewley (2002), to ask ‘Why don’t firms cut overtime premiums during a recession?’, especially when the legal restrictions in this regard are lifted by a labour reform. Second, we use difference-in-difference matching methods to analyse the effects on key outcomes such as employment, hours and firm sales. Our evidence indicates that firms that implement the overtime premium cuts exhibit not only steep increases in overtime hours but also in employment and sales, a result which highlights the importance of wage flexibility, even if only at a specific margin.
The structure of the paper is as follows: the next Section presents the overtime premium reform and its context. Section 3 then discusses a number of relevant theoretical aspects raised by overtime. Section 4 presents the data sets and their descriptive statistics. The main results on both take up and outcomes of interest are presented in Section 5. Finally, Section 6 concludes.
2
The overtime premium reform in Portugal
Following years of increasing macroeconomic imbalances and deteriorating competitiveness (Blanchard 2007), Portugal embarked in May 2011 on an adjustment programme funded by the European Union and International Monetary Fund (IMF 2011).1 One pillar of this programme was devoted to structural reforms, including in the labour market. These labour reforms targeted a number of institutions and legal frameworks perceived as sub-optimal by the European Commission, the International Monetary Fund and, to a lesser extent, the national authorities. These included a centralised and unrepresentative collective bargaining system, very restrictive individual dismissals, long but unequal unemployment benefits, and relatively superficial unemployment activation practices.2
Another labour market dimension identified as meriting action concerned working time
1
Greece, Ireland and, to some extent, Spain followed similar programmes over the same period.
2See Martins & Pessoa e Costa (2014), Hijzen & Martins (2016) and Martins (2016) for more on some of
flexibility and pay. In particular, the memorandum of understanding signed by the govern-ment of Portugal in May 2011 (IMF 2011) indicated that ‘Draft legislation will be submitted to Parliament by Q1-2012 on [the] revision of the minimum additional pay for overtime es-tablished in the Labour Code: (i) reduction to maximum 50% (from current 50% for the first overtime hour worked, 75% for additional hours, 100% for overtime during holydays); (ii) elimination of the compensatory time off equal to 25% of overtime hours worked’.
Following a number of events, including general elections and a new government in June 2011 and a tripartite agreement (between the government and employer and union confed-erations) signed in January 2012, the overtime pay reform was submitted to parliament in March and approved and published in June, coming into force in August 1st, 2012. This law (23/2012) also included several other labour reforms established in the above-mentioned memorandum or following from the programme of the government. These additional reforms covered areas such as individual dismissals, severance levels, bank holidays, ‘work accounts’, short working time schemes, involvement of workers’ councils in collective bargaining, in-formation provision to the labour inspectorate, and very short term contracts. All changes increased the flexibility of employment law (from the previous very high levels of rigidity) and or reduced unit labour costs.
In the case of overtime premiums, as indicated above, the law in force up to July 2012 (article 268 of the labour code) established that the first hour of overtime in a normal day of work would be subject to a premium of 50% while the second and subsequent hours would be subject to a premium of 75%. Moreover, any hour of work during the weekend (or equivalent period) or during a bank holiday would be subject to a premium of 100%. In stark contrast, from August 2012, the three overtime premiums above were cut by half, to 25%, 37.5% and 50%.
It is important to note that these overtime premiums could be changed (upward or down-ward) by collective agreement. However, all cases of collective agreements we know of that introduced changes in overtime premiums did so increasing of these premiums. Overtime could also be remunerated in a more flexible manner both before and after the law reform, through the ‘work accounts’ and ‘adaptability’ formats.3 In this respect, the law reform also established that any overtime premiums set at a higher level by collective agreements would
3In the former case, working time can be increased by a specific number of hours over a specific period
determined by the employer; in the latter case, working time can be defined in average terms, whereby working time can be increased and decreased over specific periods again determined by the employer.
be reset to the same, lower levels as in the case of general labour law for a period of two years (article 7).4 Moreover, the law introduced new forms of ‘work accounts’ which made the cost of overtime potentially even lower.
3
Theoretical discussion
From a political economy perspective, the case for overtime premium regulation may be re-garded as not particularly strong. Indeed, several countries establish very light provisions regarding the remuneration of overtime, letting employers and employees (or their represen-tatives, via collective bargaining) freely decide on these rates. In any case, some potential market failures may be mentioned even if, to the best of our knowledge, they lack supporting empirical evidence. One such failure may involve monopsony power, as firms may otherwise pay overtime rates much below the value of the resulting marginal product. Another poten-tial failure concerns the public good dimension of the overtime regulation, in that it reduces the transaction costs involved in individual bargaining and coordination of different workers in a given team or firm. Moreover, the market failure case for overtime regulation is most likely not sufficiently strong to justify steep premiums, especially if also subject to significant downward nominal rigidity.
Moving to the economics of overtime, from a theoretical perspective, firms are assumed to trade-off employment and hours. Given the quasi-fixed costs of employment, overtime may be a better option than more workers in some cases. Indeed, an optimal choice will be such that the marginal product per dollar cost of an additional hour of work will equal the marginal product per dollar cost of an additional worker. In this context, a straightforward implication of the law reform under study here (a reduction by at least 50% of the overtime premium) is that firms will want to increase their total number of overtime hours.
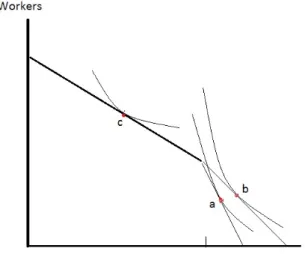
On the other hand, the prediction on employment is less clear, given the opposite signs of the resulting substitution and scale effects. Figure 1 illustrates one possible case, in which a firm faced with the reduction in the overtime premium chooses not only to increase overtime hours but also increase employment (the intersection of its highest feasible isoquant with the applicable isocosts moving from point a to point b). However, depending on the ratios of
4
The law also established that, following the two-year period, any overtime premiums set at a higher level by collective agreements would fall by 50% or be set at the general labour law, whichever higher. However, this provision was later declared unconstitutional.
marginal products of hours and workers and the magnitude of the overtime premium cut, a firm may also find it optimal to reduce employment, in which case the substitution effect would be greater than the scale effect. Other firms, not using overtime before the reform, would not be expected to change their employment or overtime choices.
In general, labour being a quasi-fixed input, the possibility of paying less for overtime makes the employment of existing workers and the hiring of new workers more attractive for firms. In this context, and following Marshall’s laws of derived demand, employment would be expected to increase following a reduction of the overtime premium depending on the following factors: first, the extent to which the production process is relatively labour intensive; second, the increase in product demand resulting from any reductions of the price of the product made possible by the reduction in the overtime premium; third, the availability of new staff in the labour market.
One last theoretical aspect we discuss here concerns the drivers of the take up of the legal possibility of a unilateral reduction in the overtime premium. As we explained above, firms would have to follow until July 2012 the minimum overtime premiums established in labour law; while from August 2012 they were free to unilaterally lower those overtime premiums by at least 50%. We argue that one potential important driver of this take-up decision is the firm-specific elasticity of labour demand. This elasticity will be influenced by the labour intensity and other factors mentioned above as well as by the relevance of the downward nominal wage rigidity as applicable to the case of base pay. In particular, we posit that the more sensitive the labour demand with respect to labour costs, the greater the probability of overtime premium cuts.
A second potential driver of unilateral overtime premium cuts (following the coming into effect of the 2012 labour law reform) is the relative bargaining power of firms with respect to their employees. This could then be explained by workers’ firm-specific skills (potentially proxied by their tenure in the firm) and the conditions of the local labour markets (including the number of vacancies in similar firms and the number of workers searching for jobs).
Two additional potential drivers that we posit are the size of the premium already paid by the firm and the information that the firm will have regarding the new provisions of the labour law reform regarding overtime. If the premium is sufficiently high, the gains from its reduction will more than compensate the required adjustment costs, in particular those
involved in discussing the matter with workers or their representatives.
On the other hand, different firms may have access to different sets of information regarding the provisions of the reform and may be able to implement the cut at different times. In particular, firms that are better informed about the forthcoming changes may be able to start preparing for them earlier, in terms both of the introduction of the changes (including the lower overtime premiums) and their response to the resulting new conditions (in terms of hours of work, employment levels and prices of their products).
4
Data and descriptive statistics
We use the well-known ‘Quadros de Pessoal’ data set, a comprehensive matched employer-employee panel. This data set provides detailed information on virtually all firms based in Portugal and all their employees, including time-invariant firm and person identifiers. Crit-ically for the purpose of the paper, the data includes individual-level information on base and overtime pay and base and overtime hours of all workers.5 These and other worker-level variables concern the census month of October of each year: while this may leave behind overtime usage in other months, the information is highly comparable as it refers to the same month in different firms and different years (we consider the period 2010-2013 in this paper) and is in all cases reported by the firm.
From a simple analysis of these micro data, a few interesting statistics can immediately be provided. For instance, on average, each one of the 2.55 million workers reported in the 2011 data is paid for 1.3 hours per overtime during the month (and for 158.3 hours of standard time). We also find that average overtime payments correspond to 12.4 euros per worker, in contrast to total base pay of 816.2 euros and total pay of 1067.7 euros. In other words, (paid) overtime corresponds to 0.8% of the total paid time in the economy and 1.2% of the total wage bill. Moreover, the cross-sectional dispersion of overtime is considerably greater than that of standard time, with coefficients of variation five to 30 times higher.6
A critical step in our analysis concerns the definition and implementation of an overtime premium. We compute this premium by dividing the hourly pay for overtime of each worker by the hourly pay for normal time of the same worker (using data for October of each year).
5
On the other hand, the data does not include information on unpaid overtime.
6All results are own calculations based on ‘Quadros de Pessoal’. See Bauer & Zimmermann (1999), Bell &
At this point, it is important to mention that the data does not indicate the labour law overtime categories (first hour during a week day, second and subsequent hours during the week, or hours during the week-end or bank holidays) of each hour of overtime - but we do know how many hours of (paid) overtime each employee works in the reference month.
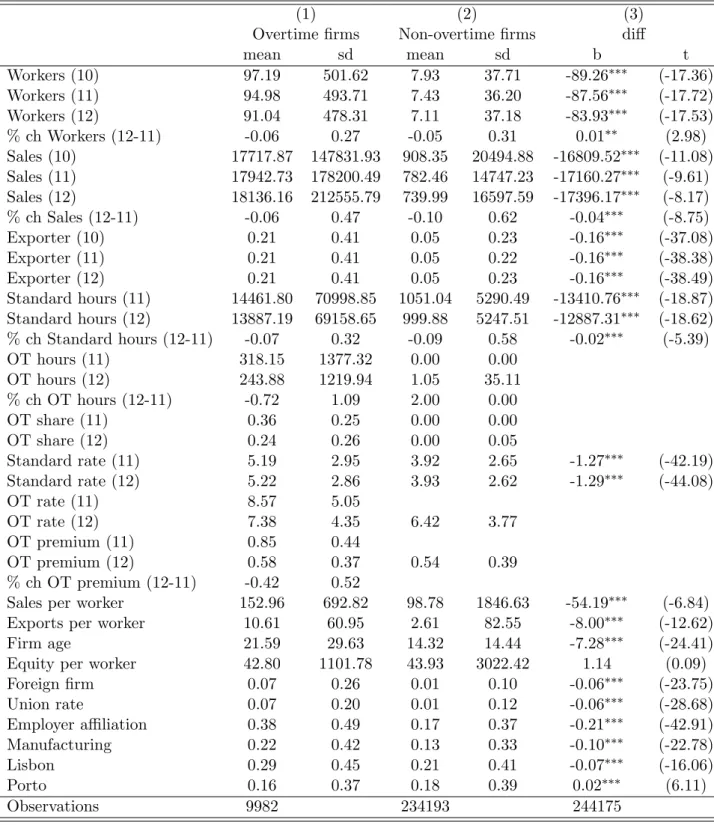
Using the criteria above, we split our data into two groups: firms that paid at least one hour of overtime in (October) 2011 and firms that do not use overtime in that period. Table 1 presents a large number of descriptive statistics of the two groups of firms and reveals a number of important differences between them. We find that only 9,982 (or little more than 4%) of the 244,175 firms covered report overtime. Moreover, ‘overtime firms’ are much larger in terms of several dimensions, including number of workers, sales, sales per worker, and exports. Considering firm size, these differences between the two groups - 95 workers per overtime firm and only 7.5 workers per non-overtime firm - imply that more than half (52.5%) of all workers are employed by firms that pay overtime.
The differences between the two averages can vary considerably across dimensions, includ-ing a factor of 18 (sales), 13 (firm size), 7 (foreign ownership and union rate), 4 (export status), 2 (employer association affiliation), and 1.8 (base hourly pay and manufacturing status). Eq-uity per worker is the only variable where there are no statistically significant differences between the averages of the two groups.
Focusing on the case of overtime firms, we find that an average of 36% of workers report overtime, which corresponds to an average of 318 total overtime hours per firm (as mentioned above, this concerns the month of October 2011). Moreover, the average overtime premium across overtime firms in 2011 is 85%. This figure sits comfortably between the two extreme rates of 50% and 100% established in labour law up to July 2012, especially when taking into account that these rates were higher in a number of collective agreements.
When comparing these overtime figures between 2011 and 2012, we find a significant decline in the number of overtime hours and overtime shares. This is most likely related to the downturn in 2012, when GDP contracted by 4% (after already having fallen by 1.3% in 2011). Another important change concerns the overtime rate and premium: the former falls from 8.57 to 7.38 euros per hour while the base rate increases slightly from 5.19 to 5.22 euros per hour. These two groups of statistics result in an overtime premium that falls from 85% to 58% between 2011 and 2012, which is broadly in line with the content of the labour law
reform.
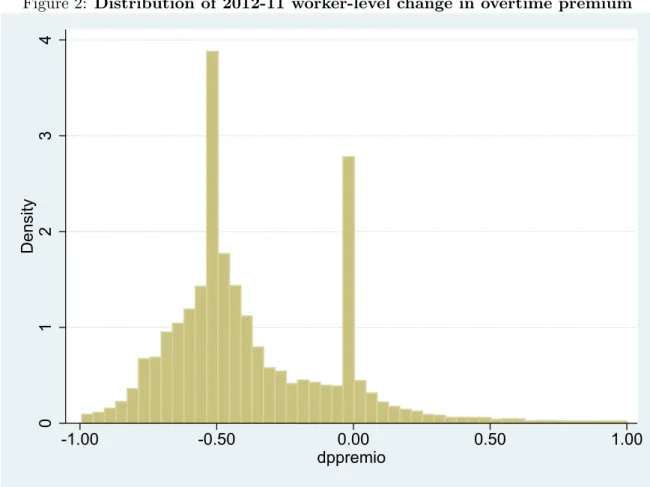
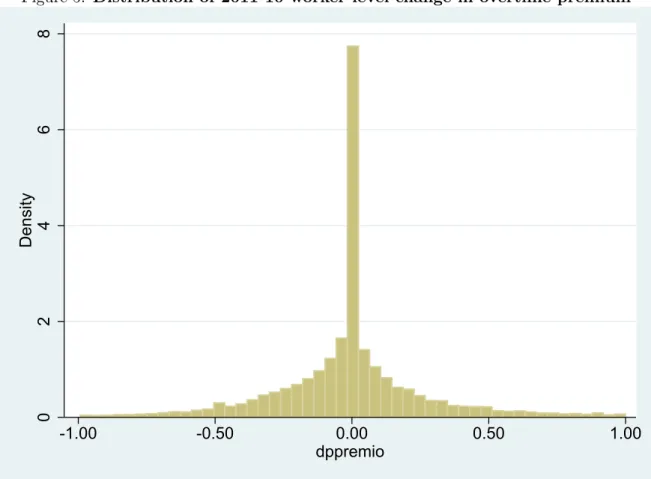
We examine the change in the overtime premium in greater detail in Figure 2, which presents the distribution of the difference in the premiums for the same workers between 2011 and 2012. More specifically, the sample used here are workers in the same firm in the two months (October 2011 and 2012), that are paid overtime in both months and at a positive premium. We find two clear peaks in the distribution, one at 0% (firms that leave their overtime premium unchanged between the two years) and the other at -50% (firms that cut their overtime premium in half, exactly as made possible by the labour law reform).
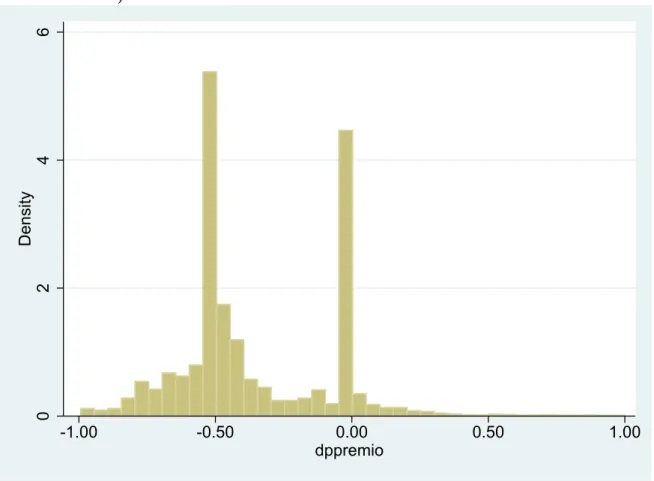
This pattern is even clearer in Figure 3, which follows the same methodology as Figure 2, except that the sample is further restricted to workers that have the same number of hours of overtime in the two months. We find that this restriction reduces considerably the number of observations outside the dual peaks of 0% and -50% changes in the overtime premium. This difference suggests that a large part of the cases in which the change in the overtime premium is different from those two values is driven by changes in the number of the hours of overtime, not by different overtime premiums for the same type of overtime hours. Indeed, workers that retain the same number of hours of overtime are likely to have a similar distribution across the three premium categories established in law (for instance, the first hour during a week day), allowing us to focus more clearly on the price effect.
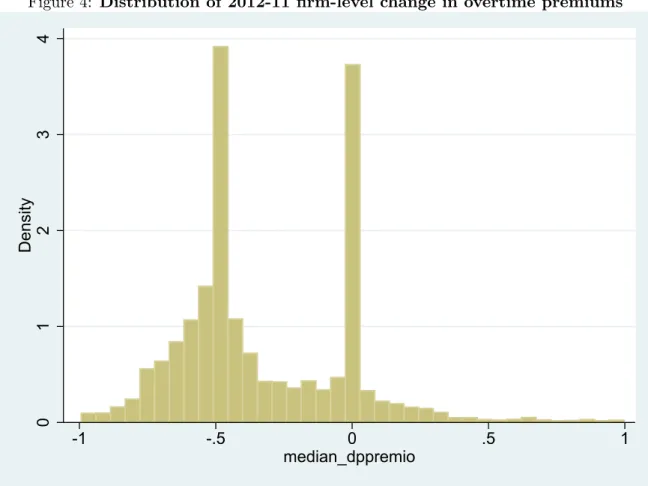
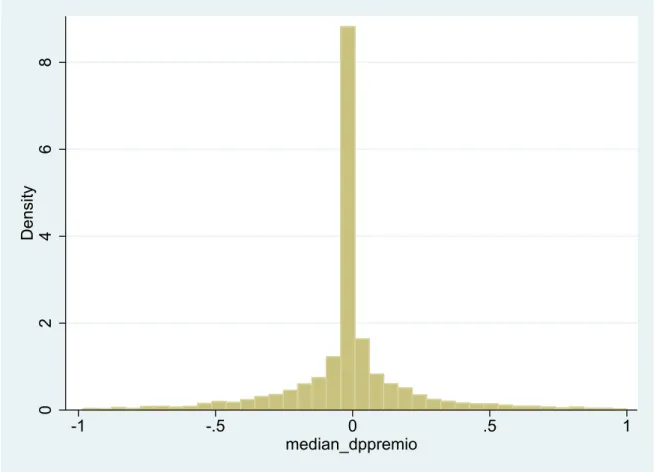
Finally, we compute a firm-level, year-specific overtime premium, defined as the average premium across all workers that are paid overtime in that firm and year.7 Figure 4 presents the distribution of the difference in such overtime premiums, comparing 2012 and 2011. As in the case of the worker-level analysis, we find two clear peaks in the distribution, one at 0% and the other at -50%.
In order to assess in greater detail the extent to which these twin peaks follow from the labour law reform, we redo the analyses underpinning Figures 2 and 4 (which were based on 2011 and 2012 data) but now using equivalent data for 2010 and 2011. The results are displayed in Figures 5 and 6 where we find no evidence of twin peaks. Quite on the contrary, there is evidence of considerable stability in the overtime premiums, with a very large propor-tion of cases (over 50% in the two approaches) in which overtime premiums remain exactly unchanged.
7See Martins et al. (2012) for a different approach to the identification of ‘representative’ firm-level wages,
Finally, we wish to describe the overall context regarding (nominal) wage flexibility by focusing on base pay and its potential trade-offs with the changes presented above regarding overtime. For instance, Trejo (2003) finds evidence consistent with downward adjustments in base hours when overtime premiums are expanded. However, in a number of other European countries, downward nominal wage rigidity is established by law. For instance, in Portugal, the nominal salary of a continuing worker can only be cut in a small number of exceptional circumstances.
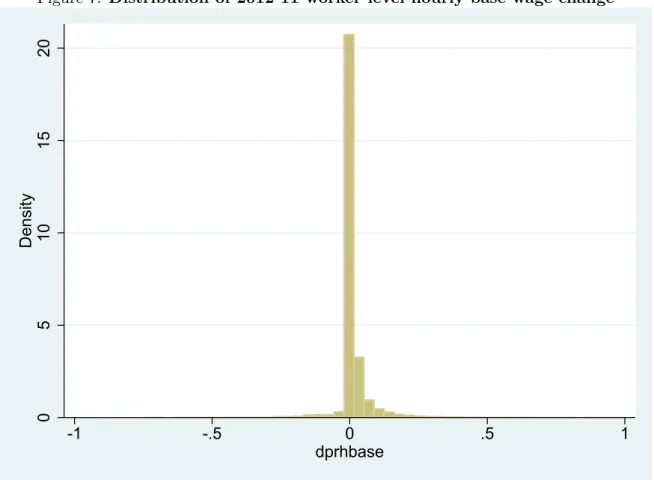
To shed light on this matter, we analyse the same sample as in Figure 2 (workers in the same firm, paid overtime in both 2011 and 2012) but now focusing on the change of their hourly base wages over the same period. Figure 7 presents the results, which indicate a particularly high level of nominal wage rigidity - note the much higher range of densities in Figure 7 compared to the previous cases. These findings are consistent with other studies that cover a wider sample of workers (Carneiro et al. 2014, Portugal & Martins 2014) and also find strong evidence of high levels of wage rigidity (particularly during the peak of the crisis, 2012).8 However, our findings in Figure 7 are in stark contrast with the major reductions in overtime pay presented above.
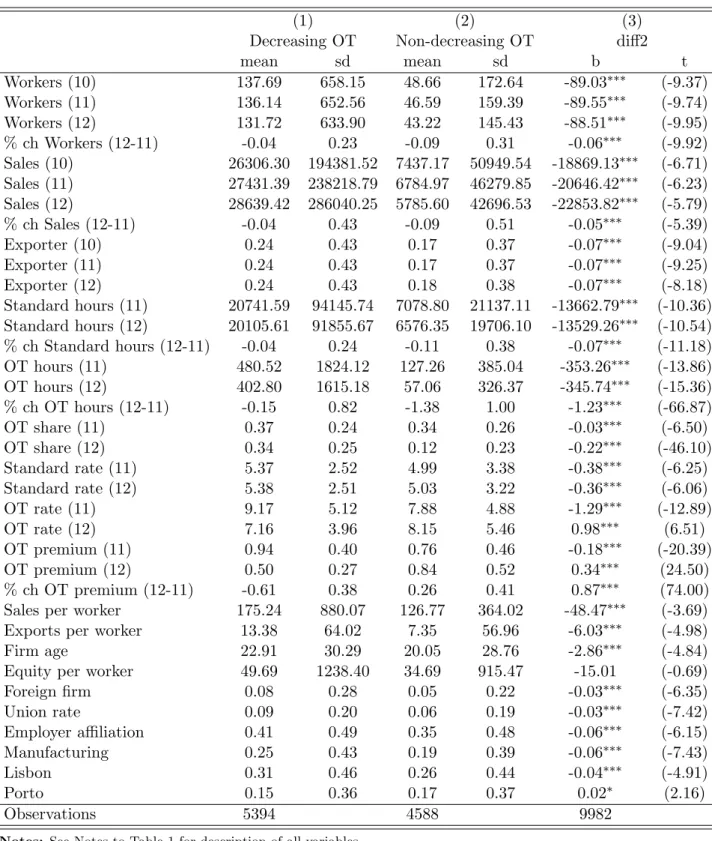
We now turn to a more detailed analysis of the firms that do pay overtime in 2011, comparing between those that do decrease their overtime premiums (a total of 5,394 firms) and those that leave their overtime premiums unchanged or even increase them (a total of 4,588 firms). Their differences are presented in Table 2, following a similar structure to that of Table 1.
In general, our analysis indicates that firms that do decrease their premiums are more distinctive than firms that do not, in terms of a comparison with firms that do not use overtime at all. Firms that do not decrease their premiums are in between the two groups in terms of many if not all variables considered. More specifically, we find that decreasing overtime premium firms tend to employ more workers (136 vs 47), have higher sales and higher productivity, export more, and have slightly higher overtime intensities, salaries, and overtime premiums. Decreasing overtime premium firms also have slightly higher age, equity per worker, foreign ownership, union and employer affiliation rates, and are more likely to be in the manufacturing sector. In any case, the means of virtually all variables are statistically
8Martins et al. (2012) finds high levels of real wage cyclicality (in entry positions) but covers a much longer
time period (1982-2008), including several years of high inflation, in contrast to the period of virtually zero inflation studied here.
significantly different.
Also important for our main results, we find significant differences in a number of outcomes between the two groups. First and foremost, while employment declines in both groups of firms, non-decreasing premium firms experience a steeper decline from 2011 to 2012, of -0.09 compared to -0.04 (as noted above, 2012 was characterised in Portugal by a steep GDP decline, as well as a significant increase in unemployment and a significant decrease in employment).9 Similarly, sales and total standard hours decline at a higher rate amongst non-decreasing premium firms.
Second, we find that, while overtime hours again decline in both groups of firms, the decline is much steeper amongst firms that do not cut their overtime premiums (-1.38 compared to only -0.15). Correspondingly, the average share of workers paid overtime also declines by much more amongst non-decreasing premium firms while it is virtually unchanged in the case of decreasing premium firms (from 0.34 to 0.12 in the former case compared to 0.37 to 0.34). Finally, as required by the classification of firms, we find a significant decline in premiums in the first group of firms (from 94% to 50%), while average premiums increase in the second group (from 76% to 84%). These changes in the premiums do not reflect changes in base wages - as expected from Figure 7 - and are completely driven by changes in overtime rates, following the content of the law reform.
5
Results
In this Section, we present two groups of results. The first concerns the determinants of overtime premium reductions. The second addresses the potential effects of overtime premium reductions on a number of outcomes of interest.
5.1 Determinants of premium reductions
We examine the potential drivers of a premium decreasing behaviour by estimating a simple linear probability model, in which the dependent variable is a dummy variable taking value one if the firm reduces its overtime premium between 2011 and 2012. We consider a number of potential predictors, following from our simple theoretical discussion in Section 2 plus
9Variables depicting percentage changes are computed as in the labour flows literature, (x
2− x1)/((x2+
x1)/2), and therefore bound between -2 and +2. This ensures greater comparability across variables, in contrast
to a more standard percentage changes approach, given the large dispersion of some variables, in particular overtime usage.
additional covariates of potential interest. These variables are firm size, sales and exports (all of which covering both 2010 and 2011), firm age, equity per worker, foreign ownership, sales and exports per worker, employer association and union rates, total base and overtime hours, and base and overtime hourly pay. We also consider specifications including region, sector and collective bargaining agreement fixed effects.
The findings - presented in Table 3 - indicate a number of important stylised facts. First, labour intensity (measured by base and overtime hours, after controlling for total number of workers, sales, and pay levels) is systematically related to higher probabilities of premium reductions. Second, higher hourly base pay is related to lower probabilities of premium reductions. On the other hand, higher hourly overtime pay is associated to higher probabilities of premium reductions. Finally, employer association affiliation is associated to overtime premium reductions. Union rates, if anything, are related positively to premium reductions but their effect is insignificant when industry (and collective bargaining) fixed effects are taken into account.
These results are consistent with the simple theoretical discussion in Section 2, focused on labour demand elasticities, bargaining power, adjustment costs and information. First, we found that measures of labour intensity that will increase the elasticity of labour demand, such as base and overtime hours, are indeed associated to higher probabilities of premium cuts. A lower base pay - a reflection of more elastic labour demands and or higher relative bargaining power by employers - also predicts greater take-up of the premium cut.
Second, we find that the overtime premium is associated to a higher probability of pre-mium cuts, which is consistent with the adjustment costs perspective. If firms are subject to high premiums, perhaps because of collective agreements or because of a concentration of overtime amongst a small percentage of workers or in periods of time when premium rates are higher, then the gains from cutting these premiums towards the new levels are more likely to compensate for the one-off adjustment costs of bringing them down.
Finally, the result regarding employer association affiliation may also support the bargain-ing power explanation. Indeed, affiliated firms are more likely to coordinate their decisions, strengthening their bargaining power with respect to their workers. For instance, affiliated firms may use extensions of collective agreements to force non-affiliated firms to pay higher salaries (Martins 2014, Hijzen & Martins 2016), thereby pricing them out of the market and
reducing the outside employment opportunities for the current workers of affiliated frms. The result on employer association affiliation are also consistent with the information effect discussed above. Employer associations tend to provide information regularly to their members, including about labout law changes. These employer associations are also affiliated to higher-level employer confederations which discussed with the government the contents of the labour law reform (and signed the tripartite agreement of January 2012). Therefore those firms were likely to be particularly well informed about the new provisions on overtime premiums. This may have facilitated the early adoption of these new rules in October, only three months after they came into effect, in August.10
5.2 Effects of premium reductions
We now turn to the analysis of the employment effects of the overtime premium reductions. As discussed above, this question is anchored in the important policy debate on worksharing (Hunt 1999, Crepon & Kramarz 2002, Chemin & Wasmer 2009), including recent measures towards reducing the taxation of overtime in France (Cahuc & Carcillo 2014) or extending working time in Germany 15 or increasing the group of workers potentially subject to overtime in the US.
We approach this question by comparing a number of outcomes of interest between over-time firms that do cut their premiums and overover-time firms that do not cut their premiums. While both groups of firms are eligible to benefit from the lower premiums established from August 2012,11 any possible direct effects of lower premiums may only be observed amongst the firms that do in fact put in practice lower rates. At the same time, this setup may lead to a process of self-selection into treatment and reverse causality that can then compromise the extent to which one can attribute any differences in subsequent outcomes to the reduction of premiums. For instance, one may argue that, if firms that reduce overtime are found to have better relative performance in terms of employment (as suggested by the descriptive statistics in Table 2), this may be because firms with previously determined expansion plans are more likely to reduce their overtime premiums. Of course, it is also very important to take into account the macroeconomic environment in the country at the time the reform is
10
Higher union rates may also facilitate the discussion of the new premiums, even if its coefficient is not significant in the most detailed specification.
11
Of course, even firms not using overtime before the reform may be considered as eligible as they may become more likely to use it in the future. We disregard this additional margin of adjustment in this paper.
introduced, characterised by a pronounced downturn, including increasing unemployment, involving reductions of employment, sales and overtime hours by firms.
In order to minimise, if not fully eliminate the concerns above, we adopt a difference-in-difference matching approach (Heckman et al. 1997, 1998, Blundell et al. 2004, Hijzen et al. 2013). This approach allows us to adopt a lighter version of the conditional independence assumption applicable in standard matching. Specifically, we consider a differenced version of a standard difference-in-difference model coupled with matching. We then analyse the extent to which the changes in a number of outcomes between 2011 and either 2012 or 2013 vary with the introduction or not of lower overtime premiums in 2012.
Moreover, we implement different matching methods and control for different trends across types of firms to ensure greater comparability between firms that do introduce overtime cuts and those that do not. This matching is conducted along a long list of covariates: employment in 2010 and 2011, sales in 2010 and 2011, exports in 2010 and 2011, firm age, three firm legal type dummy variables, equity, foreign and public ownership dummy variables, employer asso-ciation affiliation dummy variable, unionisation rate, base and overtime pay in 2010 and 2011, base and overtime hours in 2010 and 2011, and district, industry and collective agreement dummy variables.12
The results, for two types of matching and two types of dependent variables, are presented in Tables 4, 5 and 6 and are very similar. First of all, we observe very large effects in terms of overtime hours, particularly when comparing 2012 and 2011. Moreover, the coefficient obtained, 1.216, is reassuringly very close to the difference between the mean changes in overtime hours in Table 2. When comparing overtime hours in 2013 and 2011, we again find very large and significant effects, even if at a smaller magnitude.
In the case of base and total hours (which will be driven by intensive and extensive margins), we again we find significant positive effects. However, the latter (total hours, i.e. base and overtime hours) effects are larger, given the much higher relative growth of overtime hours.
Turning to the key outcome of interest, employment (number of workers), we find again significant positive effects, both for 2012 and 2013 - coefficients of .056 and .054, respectively. In fact, the coefficients are very similar to the case of base hours, indicating that much of
12In the case the year of the variable is not mentioned, it refers to the latest available (2010 or 2011 in all
the increase in the latter are driven by the extensive margin (more workers), rather than the intensive margin (more base hours of existing workers). Once again, these difference-in-difference matching employment effects are reassuringly very close to the difference-in-difference between the mean changes in employment in Table 2.
Similar results are obtained on sales, with statistically significant coefficients of .052 and .041 for 2012 and 2013, even if slightly less precise than those for employment. In the case of exports or export entry (a dummy variable defined only for firms that do not export in 2011 and equal to one if a firm exports in 2012), we do not find significant effects.13 We also conducted robustness analysis for all outcome variables, considering small changes in the threshold between declining and non-declining premium firms, i.e. establishing the threshold at -5% or -10%, instead at 0%, finding similar results (available upon request).14
Overall, our findings on the effects of overtime premium flexibility indicate that firms that implemented the cuts made possible by the reform experienced much better relative performance in terms of a number of key variables. First of all, as expected from theory, these firms increased significantly, in relative terms, the volume of overtime hours. More interestingly, we find that the balance between the substitution and scale effects discussed above was clearly in favour of the latter, as employment, total hours and sales have also increased significantly.
6
Conclusions
This paper explored a recent labour law reform in Portugal to investigate the potential of overtime premium flexibility to increase employment. This is a novel question in the aca-demic literature, drawing together the literatures on working time and wage rigidity. This is also a question of great potential from a policy perspective, particularly given the disappoint-ing evidence from workshardisappoint-ing initiatives (Hunt 1999, Crepon & Kramarz 2002, Chemin & Wasmer 2009).
The law reform studied here allowed firms to unilaterally reduce the overtime premium paid to their workers by 50% or more. Until this reform came into effect, overtime premiums were set by law at a relatively high level and could not be cut, as in many other (Southern)
13
Data for 2013 is not yet available at the time of writing.
14We also considered using employer affiliation status as an instrumental variable, following the discussion
European countries. Collective bargaining could in theory establish lower premiums but in practice only the opposite has been the case.
Using detailed matched employer-employee panel data, including worker-level information on both base and overtime hours and base and overtime pay, we shed light on the effects of the resulting greater flexibility in overtime pay setting. First, we find that half of the firms using overtime in 2011 did reduce their overtime premiums in a manner consistent with the reform. This was particularly the case for larger firms making greater use of overtime and already paying higher premiums. This flexibility in overtime pay contrasts strikingly with the extreme rigidity in base pay, which was still subject to significant legal constraints regarding downward nominal adjustments.
Second, we find that overtime firms that cut overtime premiums, compared to overtime firms that do not, exhibit significant relative increases in overtime usage, employment and sales following the reform, both in 2012 and 2013. Following standard theory, these results are consistent with scale effects dominating substitution effects: firms can produce more at the same cost and do so by increasing both overtime and employment. Our approach, based on difference-in-difference matching and a long list of covariates, should minimise self-selection effects. Moreover, one would expect that, if any selection remains, it would be the firms that are undergoing negative unobserved demand shocks that would be more likely to cut their overtime premiums, not the other way around. Further research, based on different sources of variation in overtime premiums, may shed more light on this question.
Overall, our results highlight the important but not exclusive role of legal restrictions behind downward nominal pay rigidity. Psychological factors (Bewley 2002), for instance, may also be relevant, even in the case of other salary components than base pay. Our findings also offer additional evidence of the potential negative effects of wage rigidity on employment and other economic outcomes: a firm’s ability to adjust even a relatively small (but highly variable) component of total pay can make an important difference to a number of key economic variables in a challenging product market environment.
References
Andrews, M., Gerner, H.-D., Schank, T. & Upward, R. (2015), ‘More hours, more jobs? The employment effects of longer working hours’, Oxford Economic Papers 67(2), 245–268.
Babecky, J., Caju, P. D., Kosma, T., Lawless, M., Messina, J. & Room, T. (2010), ‘Downward Nominal and Real Wage Rigidity: Survey Evidence from European Firms’, Scandinavian Journal of Economics 112(4), 884–910.
Babecky, J., Du Caju, P., Kosma, T., Lawless, M., Messina, J. & Room, T. (2012), ‘How do European firms adjust their labour costs when nominal wages are rigid?’, Labour Economics 19(5), 792–801.
Bauer, T. & Zimmermann, K. F. (1999), ‘Overtime Work and Overtime Compensation in Germany’, Scottish Journal of Political Economy 46(4), 419–36.
Bell, D. N. F. & Hart, R. A. (2003), ‘Wages, Hours, and Overtime Premia: Evidence from the British Labor Market’, Industrial and Labor Relations Review 56(3), 470–480.
Bewley, T. F. (2002), Why Wages Don’t Fall during a Recession, Harvard University Press.
Blanchard, O. (2007), ‘Adjustment within the euro. The difficult case of Portugal’, Portuguese Economic Journal 6(1), 1–21.
Blundell, R., Costa Dias, M., Meghir, C. & Reenen, J. (2004), ‘Evaluating the employment impact of a mandatory job search program’, Journal of the European Economic Association 2(4), 569–606.
Cahuc, P. & Carcillo, S. (2014), ‘The Detaxation of Overtime Hours: Lessons from the French Experiment’, Journal of Labor Economics 32(2), 361 – 400.
Caju, P. D., Kosma, T., Lawless, M., Messina, J. & Rm, T. (2015), ‘Why Firms Avoid Cutting Wages’, ILR Review 68(4), 862–888.
Carneiro, A., Portugal, P. & Varejao, J. (2014), ‘Catastrophic Job Destruction during the Portuguese Economic Crisis’, Journal of Macroeconomics 39(PB), 444–457.
Chemin, M. & Wasmer, E. (2009), ‘Using Alsace-Moselle Local Laws to Build a Difference-in-Differences Estimation Strategy of the Employment Effects of the 35-Hour Workweek Regulation in France’, Journal of Labor Economics 27(4), 487–524.
Crepon, B. & Kramarz, F. (2002), ‘Employed 40 Hours or Not Employed 39: Lessons from the 1982 Mandatory Reduction of the Workweek’, Journal of Political Economy 110(6), 1355– 1389.
Dickens, W. T., Goette, L., Groshen, E., Holden, S., Messina, J., Schweitzer, M., Turunen, J. & Ward, M. E. (2007), ‘How wages change: Micro evidence from the international wage flexibility project’, Journal of Economic Perspectives 21(2), 195–214.
Doris, A., O’Neill, D. & Sweetman, O. (2015), ‘Wage flexibility and the great recession: the response of the Irish labour market’, IZA Journal of European Labor Studies 4(1), 1–24.
Elsby, M. (2009), ‘Evaluating the economic significance of downward nominal wage rigidity’, Journal of Monetary Economics 56(2), 154–169.
Fehr, E. & Goette, L. (2005), ‘Robustness and real consequences of nominal wage rigidity’, Journal of Monetary Economics 52(4), 779–804.
Hart, R. A. (2004), The Economics of Overtime Working, Cambridge University Press.
Heckman, J., Ichimura, H. & Todd, P. (1997), ‘Matching as an econometric evaluation es-timator: Evidence from evaluating a job training program’, Review of Economic Studies 64(4), 605–654.
Heckman, J., Ichimura, H. & Todd, P. (1998), ‘Matching as an econometric evaluation esti-mator’, Review of Economic Studies 65(2), 261–294.
Hijzen, A. & Martins, P. S. (2016), No Extension without Representation? Evidence from a Natural Experiment in Collective Bargaining, Working paper 16/143, International Mone-tary Fund.
Hijzen, A., Martins, P. S., Schank, T. & Upward, R. (2013), ‘Foreign-owned firms around the world: A comparative analysis of wages and employment at the micro-level’, European Economic Review 60(C), 170–188.
Hunt, J. (1999), ‘Has Work-Sharing Worked in Germany?’, Quarterly Journal of Economics 114(1), 117–148.
IMF (2011), Memorandum of economic and financial policies: Portugal, Report, International Monetary Fund.
Martins, P. S. (2014), 30,000 minimum wages: The economic effects of collective bargaining extensions, Discussion paper 8540, IZA, Bonn.
Martins, P. S. (2016), Should the maximum duration of fixed-term contracts increase in recessions? Evidence from a law reform, CGR Working Paper 73.
Martins, P. S. & Pessoa e Costa, S. (2014), Reemployment and Substitution Effects from Increased Activation: Evidence from Times of Crisis, IZA Discussion Paper 8600.
Martins, P. S., Snell, A. & Thomas, J. P. (2010), ‘Downward Wage Rigidity in a Model of Equal Treatment Contracting’, Scandinavian Journal of Economics 112(4), 841–863.
Martins, P. S., Solon, G. & Thomas, J. (2012), ‘Measuring what employers do about entry wages over the business cycle: A new approach’, American Economic Journal: Macroeco-nomics 4(4), 36–55.
Portugal, P. & Martins, F. (2014), ‘Wage adjustments during a severe economic downturn’, Economic Bulletin and Financial Stability Report Articles (Bank of Portugal) .
Trejo, S. J. (2003), ‘Does the Statutory Overtime Premium Discourage Long Workweeks?’, Industrial and Labor Relations Review 56(3), 530–551.
Figure 1: Theoretical effects of an overtime premium cut
Notes: The figure display an isocost before and after the decrease of the overtime premium and possible optimal choices in the two cases (points a and b), for a firm already paying overtime hours before, and a possible optimal choice for a firm prefering not to pay overtime (point c), determined by the intersections with different isoquants.
Figure 2: Distribution of 2012-11 worker-level change in overtime premium 0 1 2 3 4 Density -1.00 -0.50 0.00 0.50 1.00 dppremio
Notes: The Figure compares the overtime premium of the same worker in October 2011 and October 2012. The overtime premium is computed from the ratio between the hourly overtime pay (total overtime pay in the month divided by the total number of overtime hours in the month) and the hourly base pay (total base pay in the month divided by the total number of base hours in the month). The sample used are workers in the same firm in the two months (October 2011 and 2012) that are paid overtime in both months and at a positive premium. The percentage change presented in the Figure corresponds to the difference in the premiums divided by the premium in 2011.
Figure 3: Distribution of 2012-11 worker-level change in overtime premium (same overtime hours) 0 2 4 6 Density -1.00 -0.50 0.00 0.50 1.00 dppremio
Notes: Same as Figure 2 except that extra sample restriction of same number of overtime hours in October 2011 and October 2012 is now also imposed.
Figure 4: Distribution of 2012-11 firm-level change in overtime premiums 0 1 2 3 4 Density -1 -.5 0 .5 1 median_dppremio
Notes: The figure compares the overtime premium of the same firm in October 2011 and October 2012. The change in overtime premiums is computed from the median change in premium at the worker level (see Figure 2) in each firm.
Figure 5: Distribution of 2011-10 worker-level change in overtime premium 0 2 4 6 8 Density -1.00 -0.50 0.00 0.50 1.00 dppremio
Notes: The Figure compares the overtime premium of the same worker in October 2010 and October 2011. See Figure 2 for more details.
Figure 6: Distribution of 2011-10 firm-level change in overtime premiums 0 2 4 6 8 Density -1 -.5 0 .5 1 median_dppremio
Notes: The figure compares the overtime premium of the same firm in October 2010 and October 2011. The change in overtime premiums is computed from the median change in premium at the worker level (see Figure 2) in each firm.
Figure 7: Distribution of 2012-11 worker-level hourly base wage change 0 5 10 15 20 Density -1 -.5 0 .5 1 dprhbase
Notes: The Figure compares the (nominal) hourly base pay of the same worker in October 2011 and October 2012. The hourly base pay is equal to the total base pay in the month divided by the total number of base hours in the month. The sample used are workers in the same firm in the two months (October 2011 and 2012) that are paid overtime in both months and at a positive premium. The percentage change presented in the Figure corresponds to the difference in the hourly base pay in 2012 and 2011 divided by the hourly base pay in 2011.
Table 1: Descriptive statistics, overtime and non-overtime firms
(1) (2) (3)
Overtime firms Non-overtime firms diff
mean sd mean sd b t Workers (10) 97.19 501.62 7.93 37.71 -89.26∗∗∗ (-17.36) Workers (11) 94.98 493.71 7.43 36.20 -87.56∗∗∗ (-17.72) Workers (12) 91.04 478.31 7.11 37.18 -83.93∗∗∗ (-17.53) % ch Workers (12-11) -0.06 0.27 -0.05 0.31 0.01∗∗ (2.98) Sales (10) 17717.87 147831.93 908.35 20494.88 -16809.52∗∗∗ (-11.08) Sales (11) 17942.73 178200.49 782.46 14747.23 -17160.27∗∗∗ (-9.61) Sales (12) 18136.16 212555.79 739.99 16597.59 -17396.17∗∗∗ (-8.17) % ch Sales (12-11) -0.06 0.47 -0.10 0.62 -0.04∗∗∗ (-8.75) Exporter (10) 0.21 0.41 0.05 0.23 -0.16∗∗∗ (-37.08) Exporter (11) 0.21 0.41 0.05 0.22 -0.16∗∗∗ (-38.38) Exporter (12) 0.21 0.41 0.05 0.23 -0.16∗∗∗ (-38.49) Standard hours (11) 14461.80 70998.85 1051.04 5290.49 -13410.76∗∗∗ (-18.87) Standard hours (12) 13887.19 69158.65 999.88 5247.51 -12887.31∗∗∗ (-18.62) % ch Standard hours (12-11) -0.07 0.32 -0.09 0.58 -0.02∗∗∗ (-5.39) OT hours (11) 318.15 1377.32 0.00 0.00 OT hours (12) 243.88 1219.94 1.05 35.11 % ch OT hours (12-11) -0.72 1.09 2.00 0.00 OT share (11) 0.36 0.25 0.00 0.00 OT share (12) 0.24 0.26 0.00 0.05 Standard rate (11) 5.19 2.95 3.92 2.65 -1.27∗∗∗ (-42.19) Standard rate (12) 5.22 2.86 3.93 2.62 -1.29∗∗∗ (-44.08) OT rate (11) 8.57 5.05 OT rate (12) 7.38 4.35 6.42 3.77 OT premium (11) 0.85 0.44 OT premium (12) 0.58 0.37 0.54 0.39 % ch OT premium (12-11) -0.42 0.52
Sales per worker 152.96 692.82 98.78 1846.63 -54.19∗∗∗ (-6.84)
Exports per worker 10.61 60.95 2.61 82.55 -8.00∗∗∗ (-12.62)
Firm age 21.59 29.63 14.32 14.44 -7.28∗∗∗ (-24.41)
Equity per worker 42.80 1101.78 43.93 3022.42 1.14 (0.09)
Foreign firm 0.07 0.26 0.01 0.10 -0.06∗∗∗ (-23.75) Union rate 0.07 0.20 0.01 0.12 -0.06∗∗∗ (-28.68) Employer affiliation 0.38 0.49 0.17 0.37 -0.21∗∗∗ (-42.91) Manufacturing 0.22 0.42 0.13 0.33 -0.10∗∗∗ (-22.78) Lisbon 0.29 0.45 0.21 0.41 -0.07∗∗∗ (-16.06) Porto 0.16 0.37 0.18 0.39 0.02∗∗∗ (6.11) Observations 9982 234193 244175
Notes: Workers (x) denotes the number of workers in October 20x. Sales refer to the total value of sales during the entire year. Exporter is a dummy variable equal to one for firms exporting at least one euro in that year. Standard (OT) hours refer to the total volume of hours of all workers in October. OT share denotes the percentage of employees that work at least one hour of overtime during October of the reference year. Standard rate is the average hourly pay of base (non-overtime) hours in nominal euros of all workers in the firm. OT rate is the average houly pay (in nominal euros) of all employees that worked overtime. OT premium is the ratio of the overtime rate and the standard rate for overtime workers. Union rate is the percentage of workers that are affiliated with unions. Lisbon and Porto are dummy variables equal to one for firms located in those districts. Variables depicting percentage changes are computed as in the labour flows literature, (x2− x1)/((x2+ x1)/2), and therefore bound between -2 and +2.
Table 2: Descriptive statistics, OT-premium-decreasing and non-OT-decreasing firms
(1) (2) (3)
Decreasing OT Non-decreasing OT diff2
mean sd mean sd b t Workers (10) 137.69 658.15 48.66 172.64 -89.03∗∗∗ (-9.37) Workers (11) 136.14 652.56 46.59 159.39 -89.55∗∗∗ (-9.74) Workers (12) 131.72 633.90 43.22 145.43 -88.51∗∗∗ (-9.95) % ch Workers (12-11) -0.04 0.23 -0.09 0.31 -0.06∗∗∗ (-9.92) Sales (10) 26306.30 194381.52 7437.17 50949.54 -18869.13∗∗∗ (-6.71) Sales (11) 27431.39 238218.79 6784.97 46279.85 -20646.42∗∗∗ (-6.23) Sales (12) 28639.42 286040.25 5785.60 42696.53 -22853.82∗∗∗ (-5.79) % ch Sales (12-11) -0.04 0.43 -0.09 0.51 -0.05∗∗∗ (-5.39) Exporter (10) 0.24 0.43 0.17 0.37 -0.07∗∗∗ (-9.04) Exporter (11) 0.24 0.43 0.17 0.37 -0.07∗∗∗ (-9.25) Exporter (12) 0.24 0.43 0.18 0.38 -0.07∗∗∗ (-8.18) Standard hours (11) 20741.59 94145.74 7078.80 21137.11 -13662.79∗∗∗ (-10.36) Standard hours (12) 20105.61 91855.67 6576.35 19706.10 -13529.26∗∗∗ (-10.54) % ch Standard hours (12-11) -0.04 0.24 -0.11 0.38 -0.07∗∗∗ (-11.18) OT hours (11) 480.52 1824.12 127.26 385.04 -353.26∗∗∗ (-13.86) OT hours (12) 402.80 1615.18 57.06 326.37 -345.74∗∗∗ (-15.36) % ch OT hours (12-11) -0.15 0.82 -1.38 1.00 -1.23∗∗∗ (-66.87) OT share (11) 0.37 0.24 0.34 0.26 -0.03∗∗∗ (-6.50) OT share (12) 0.34 0.25 0.12 0.23 -0.22∗∗∗ (-46.10) Standard rate (11) 5.37 2.52 4.99 3.38 -0.38∗∗∗ (-6.25) Standard rate (12) 5.38 2.51 5.03 3.22 -0.36∗∗∗ (-6.06) OT rate (11) 9.17 5.12 7.88 4.88 -1.29∗∗∗ (-12.89) OT rate (12) 7.16 3.96 8.15 5.46 0.98∗∗∗ (6.51) OT premium (11) 0.94 0.40 0.76 0.46 -0.18∗∗∗ (-20.39) OT premium (12) 0.50 0.27 0.84 0.52 0.34∗∗∗ (24.50) % ch OT premium (12-11) -0.61 0.38 0.26 0.41 0.87∗∗∗ (74.00)
Sales per worker 175.24 880.07 126.77 364.02 -48.47∗∗∗ (-3.69)
Exports per worker 13.38 64.02 7.35 56.96 -6.03∗∗∗ (-4.98)
Firm age 22.91 30.29 20.05 28.76 -2.86∗∗∗ (-4.84)
Equity per worker 49.69 1238.40 34.69 915.47 -15.01 (-0.69)
Foreign firm 0.08 0.28 0.05 0.22 -0.03∗∗∗ (-6.35) Union rate 0.09 0.20 0.06 0.19 -0.03∗∗∗ (-7.42) Employer affiliation 0.41 0.49 0.35 0.48 -0.06∗∗∗ (-6.15) Manufacturing 0.25 0.43 0.19 0.39 -0.06∗∗∗ (-7.43) Lisbon 0.31 0.46 0.26 0.44 -0.04∗∗∗ (-4.91) Porto 0.15 0.36 0.17 0.37 0.02∗ (2.16) Observations 5394 4588 9982
Table 3: OT-decreasing predictors (1) (2) (3) Workers (2011) -.0002 -.0002 -.0003 (.0001) (.0001) (.0001)∗∗∗ Workers (2010) -.0001 -.00009 -.00006 (.0001) (.00009) (.00008) Firm age .0003 .0003 .0004 (.0002) (.0002) (.0002)∗∗ Foreign firm .034 .033 .029 (.020)∗ (.020)∗ (.022)
Exports per worker .0002 .0002 .00002
(.00009)∗ (.0001) (.0001)
Employer assoc affiliated .042 .044 .033
(.010)∗∗∗ (.010)∗∗∗ (.012)∗∗∗
Union rate .063 .064 .007
(.028)∗∗ (.028)∗∗ (.031)
Base hourly pay -.006 -.006 -.007
(.002)∗∗∗ (.002)∗∗∗ (.002)∗∗∗
Overtime hourly pay .010 .010 .009
(.001)∗∗∗ (.001)∗∗∗ (.001)∗∗∗ Base hours .002 .002 .003 (.0007)∗∗∗ (.0006)∗∗∗ (.0007)∗∗∗ Overtime hours .033 .033 .024 (.004)∗∗∗ (.007)∗∗∗ (.006)∗∗∗ District FE X X Sector FE X Obs. 10066 10066 10066 R2 .043 .048 .145
Notes: The sample used are firms that pay overtime in October 2011. The dependent variable is a dummy variable equal to one if the overtime premium is lower in October 2012. Other control variables (not reported and not significant in any specification) are sales (2010 and 2011), sales per worker, equity per worker, and exports (2010 and 2011). Sector fixed effects are defined at the 5-digit level and also include additional fixed effects for the ten most representative collective agreements.
Table 4: Difference-in-difference matching results, overtime firms Outcome: change in... Coeff Std error z-ratio p-value Obs Overtime hours (2012) 1.216 .022 53.82 0.000 9,483 Overtime hours (2013) .521 .027 19.12 0.000 9,022 Base hours (2012) .069 .007 9.07 0.000 9,483 Base hours (2013) .048 .009 5.08 0.000 9,022 Total hours (2012) .087 .007 11.46 0.000 9,483 Total hours (2013) .056 .009 5.87 0.000 9,022 Employment (2012) .054 .006 8.41 0.000 9,483 Employment (2013) .040 .008 4.91 0.000 9,022 Sales (2012) .052 .011 4.55 0.000 9,347 Sales (2013) .041 .012 3.19 0.001 8,920 Exports (2012) -.044 .064 -0.70 0.486 2,398 Export entry (2012) -.001 .005 -0.24 0.807 7,939
Notes: Nearest neighbour matching. The treatment is the reduction of the overtime premium. All dependent variables are as described in Table 2 and ’Export entry (2012)’ is a dummy variable equal to one if the firm exports in 2012 (defined for firms that do not export in 2011). The matching variables are: employment in 2010 and 2011, sales in 2010 and 2011, exports in 2010 and 2011, firm age, three firm type dummies, equity, foreign and public ownership dummies, employer association affiliation dummy, main collective agreement dummies, unionisation rate, base and overtime pay in 2010 and 2011, base and overtime hours in 2010 and 2011, and district, industry and collective agreement dummies. Sample restricted to firms using overtime in October 2011.
Table 5: DDM results, overtime firms (robustness I)
Outcome: change in... Coeff Std error z-ratio p-value Obs Overtime hours (2012) 1.211 .022 55.05 0.000 9,460 Overtime hours (2013) .550 .027 19.85 0.000 9,000 Base hours (2012) .077 .007 10.08 0.000 9,460 Base hours (2013) .050 .010 4.79 0.000 9,000 Total hours (2012) .095 .007 12.49 0.000 9,460 Total hours (2013) .059 .010 5.63 0.000 9,000 Employment (2012) .062 .006 9.19 0.000 9,460 Employment (2013) .040 .009 4.26 0.000 9,000 Sales (2012) .044 .011 4.01 0.000 9,324 Sales (2013) .036 .013 2.66 0.008 8,898 Exports (2012) -.029 .057 -0.51 0.607 2,325 Export entry (2012) -.010 .005 -1.90 0.057 3,686
Table 6: DDM results, overtime firms (robustness II: percentage changes)
Outcome: change in... Coeff Std error z-ratio p-value Obs Overtime hours (2012) 1.407 .181 7.74 0.000 9,483 Overtime hours (2013) -.334 .295 -1.13 0.257 9,022 Base hours (2012) .046 .008 5.75 0.000 9,483 Base hours (2013) .026 .011 2.33 0.020 9,022 Total hours (2012) .063 .007 8.17 0.000 9,483 Total hours (2013) .034 .010 3.14 0.002 9,022 Employment (2012) .045 .008 5.22 0.000 9,483 Employment (2013) .028 .012 2.34 0.019 9,022 Sales (2012) .017 .043 0.39 0.694 9,231 Sales (2013) -.056 .053 -1.05 0.295 8,785 Exports (2012) 9.566 10.857 0.88 0.378 2,105
Nova School of Business and Economics
Faculdade de Economia Universidade Nova de Lisboa Campus de Campolide 1099-032 Lisboa PORTUGAL Tel.: +351 213 801 600