PROMOTING MEDICAL SERVICE QUALITY WITH HIGH
PERFORMANCE WORK SYSTEMS: THE ROLE OF
SAFETY LEARNING CLIMATE AND PARTICIPATORY
SAFETY
Zhang Kao
Dissertation submitted as partial requirement for the conferral of MSc. in Business Administration
Supervisor:
Prof. Nelson Campos Ramalho, ISCTE Business School, BRU-IUL, Human Resources and Organizational Behaviour Department
i PR O MOT IN G MED IC A L SE R V IC E Q U A LITY WI T H H IG H PE R FO R MAN C E WOR K SY ST EMS: TH E R O LE O F S A FE TY LE A R N IN G C LIM A TE A N D PA R TICIPA TO R Y SA FE TY Z han g kao
ii Abstract
Improving the quality of medical care is a very important priority for any hospital. This is a matter that needs long-term pursuit and persistence and is mostly dependent on people and how they are managed. Alongside with the service quality in healthcare is the issue of safety. This study explores the mediation role of safety learning climate and the moderating role of participatory safety in the relationship between HPWS and service quality. Using the data collected from 135 physicians working in Public Chinese hospitals, findings show positive effects of HPWS on service quality, mediated also by safety learning climate. Findings also show the indispensability of participatory safety. Finally, the significance of these findings is discussed.
KEYWORDS: High performance work practices; safety learning climate; participatory safety; medical service quality
iii Resumo
Melhorar a qualidade dos cuidados médicos é uma prioridade muito importante para qualquer hospital. É uma questão que precisa de continuidade e persistência no longo prazo e que é muito dependente de pessoas muitos qualificadas e da forma como são geridas. Este estudo explora o papel mediador do clima de aprendizagem de segurança e o papel
moderador da segurança participativa na relação entre as HPWS e a qualidade do serviço. Usando os dados recolhidos de 135 médicos que trabalham em hospitals públicos na China, os resultados mostraram efeitos positivos da HPWS na qualidade do serviço, igualmente por via do clima de aprendizagem de segurança. Os resultados mostraram também a
indispensabilidade da segurança participativa. Finalmente, o significado destes resultados é discutido.
PALAVRAS CHAVE: Sistemas de Trabalho de Elevado Desempenho; Climate de aprendizagem de segurança; Segurança na participação; Qualidade de Serviços Médicos CLASSIFICAÇÃO JEL: M12, I10
iv Figures Index
Figure 1: Conceptual Model Figure 2: The moderation graph
Tables Index Table 1: Descriptive and bivariate statistics
Table 2: Model summary for sales growth, financial performance, and profitability Table 2.1: Results for Conditional Mediation for Service Quality Response
Table 2.2: Results for Conditional Mediation for Service Quality Reliability Table 2.3: Results for Conditional Mediation for Service Quality Assurance
v (this page is purposively blank)
vi Index Abstract ... ii Resumo ... iii Figures Index ... iv Tables Index ... iv Index ... vi 1. Introduction ... 1
2. Review of the Literature ... 3
2.1. HPWS and Medical Service Quality ... 3
2.2. HPWS, Safety learning climate and Medical Service Quality ... 5
2.2.1 Safety learning climate and medical service quality ... 5
2.2.2 HPWS and safety learning climate ... 5
2.3. Participatory safety, HPWS and safety learning climate ... 6
3. Method ... 9
3.1. Procedure ... 9
3.2. Sample... 9
3.3. Measures ... 9
3.4. Data analysis strategy... 11
4. Results ... 13
5. Discussion and Conclusion ... 21
7. References ... 23
vii (this page is purposively blank)
1 1. Introduction
The issue of Medical service quality has been valued by advanced countries in the world for a long time. The reform of the medical system internationally has been controlled by medical expenses, and gradually turned to attach importance to and emphasize the improvement of medical quality and the promotion of patient safety. The issue of patient safety is already the policy trend of the future medical system, from the control of medical expenses, to the improvement of medical quality and patient safe working environment. Medical quality is the lifeblood of hospital survival and development, so how to improve Medical Service Quality is an important task in modern hospital management.
Like other companies, healthcare organizations are focused on maximizing their functions. However, in the healthcare industry, improving the health of patients and avoiding death determine their effectiveness (West, Guthrie, Dawson, Borrill & Carter, 2006). In addition, there are some special factors in the healthcare industry that affect the organization's operation and effectiveness. For example, contemporary healthcare organizations face many challenges, such as fierce competition, limited financial resources, staff shortages, brain drain, and job intensiveness. In addition, there are numerous, multi-disciplinary workforces and a large number of stakeholders, such as: government, insurance organizations, media, management, patients, among others (Hyde, Sparrow, Boaden & Harris, 2013). Under this pressure, it is not easy for healthcare organizations to improve the quality of care and effectiveness of patients.
As a human-centered service, the solution very much lies on how professionals are managed. Human resource management policy and practice is a relatively modern tool for organizations to cope with the current complex, adverse and problematic environment. For this reason, recent theoretical and empirical studies conducted in medical institutions have emphasized that high performance work practices/systems (HPWS) are effective tools to solve the above problems and promote higher performance results (Gkorezis, 2016). In this sense, a large number of empirical studies have shown that HPWSs have played an active role in generating employees and organizational results. Namely, regarding individuals, research by some scholars has shown the relationship between HPWSs and personal outcomes, including job satisfaction, organizational commitment, social identity, and organizational citizenship behavior (Boselie, 2010; Harmon et al., 2003; Young, Bartram, Stanton, & Leggat, 2010).
2 These results are critical because they can nurture the organizational environment, thereby promoting employee development, motivation, commitment, and positive relationships, which in turn improve key organizational results, such as performance, efficiency, and productivity.
Therefore, for healthcare organizations, implementing HPWS, as described earlier, is very likely to foster in professionals a sense of enjoyment in their work (job satisfaction), feelings of engagement and also of being highly recognized by the organization (organizational commitment and recognition). It is likely that such workforce exceeds its formal job requirements but still promotes effective organizational functions (organizational citizenship behavior). All of this is reasonably linked to higher service quality, which is the effective answer in healthcare industry to the emerging challenges.
Through the use of a 2-1-2 multilevel mediation model and British National Health Service secondary data, Ogbonnaya (2018) and his colleagues analyzed at both the organizational level and the employee level and found that HPWS can improve employee performance, including job satisfaction and employee engagement, while job satisfaction and patient satisfaction are positively related, it can also be understood that HPWS has a positive role in improving patient satisfaction.
Therefore, this study will start by reviewing the main topics involved with a focus on the learning and participatory dimensions, opening with introducing HPWS and its relationship to medical service quality, and then elaborating on both the safety learning climate, and participatory safety. These is the basis for two hypotheses involving a moderated mediation model. Following, the study will depict the methods used to collect and analyze data from a medical population and tests the hypotheses to find and discuss results at the light of theory. Conclusions are drawn and limitations and well as suggestions for future research are made at the end.
3 2. Review of the Literature
2.1. HPWS and Medical Service Quality
Generally, HPWS is implemented as a coordinated bundle of policies and practices when it is implemented. It invests in human capital, enhances employee capabilities, motivation, commitment, and productivity to improve worker satisfaction and ultimately improve organizational performance (Appelbaum et al., 2001; Burke, 2006; Pfeffer, 1996; Sullivan 2004). In the past few decades, research and practice on high-performance work practices / systems have increased. However, few studies have tested or evaluated the relative effectiveness of different combinations of HPWS. In view of the problems and limitations of medical institutions, high-performance work systems are considered to be effective "drugs" for the operation of organizations.
In medical institutions, HPWS has only recently received attention. In the field of health care, doctors or nurses are the people most affected by HPWS, so the research is mainly conducted among them. In addition, it has a great relationship with improving staff commitment and reducing health care errors (Gowen, McFadden & Tallon, 2006; Harmon et al., 2003; West et al., 2006). With growing health care needs and an aging population, first-line health care workers (FLW), who account for more than 50% of health care workers, are increasingly being used as a more effective way to meet basic service needs and expand primary health care services organizational adoption (Brownstein et al., 2011; Schindel et al. 2006). Therefore, workforce management and job redesign strategies are increasingly critical because they can enable healthcare organizations to recruit and retain skilled workers without increasing costs, while improving service quality (Standing & Chowdhury 2008). Additionally, if HPWS is implemented as a series of complementary policies and practices, and FLW is integrated into the medical team and is provided with the opportunity to participate in decision-making, it can positively affect job satisfaction and perceived quality of care (Chuang et al., 2012).
A survey conducted by Pearson and his team (2008) in Massachusetts showed that a special type of HPWS (Pay-for-Performance) has a significant effect on improving the quality of care. Salary and benefits refer to the direct and indirect rewards that organizations and
4 companies provide to employees in exchange for work. Pay-for-performance is a monetary reward which was found to be the most direct way to attract employees. In this transactional view, employees exchange qualified performance for corresponding remuneration. This has been generally acknowledged as a key issue in professional services (Chuang et al., 2012).
At the same time, scholars have demonstrated the impact of HPWSs on core organizational outcomes. For example, West and colleagues (2002, 2006) provided some of the most forward-looking findings. In their study, they found that after controlling for previous mortality and other factors (such as doctor-patient ratio), these practices were related to patient mortality. Therefore, these studies show that, in addition to the impact of many important control variables, HPWS that focuses on training, decentralized decision making, team and work safety, etc. may be effective for high-quality healthcare. In other words, such actions are likely to be mutually reinforcing and coherent as an interconnected system, and therefore produce the behaviors that lead to the provision of high quality health care and, as a consequence, lower patient mortality (West et al., 2006).
After combining the research results of individuals and organizations, most empirical studies attempt to clarify the impact of HPWS on organizational results with employee outcomes as the core influencing factors. For example, researchers in a nine-hospital study suggested that the intensity of relational cooperation among healthcare professionals (doctors, nurses, physical therapists, social workers, etc.) lead to the relationship between HPWSs and the outcomes for their patients in terms of quality and efficiency (Gittell et al., 2010). In a similar pattern, researchers (Bartram, Karimi, Leggat, & Stanton, 2014; Bonias, Bartram, Leggat, & Stanton, 2010) showed that HPWSs have a positive impact on quality of treatment through the mediating role of psychological empowerments. On this basis, we anticipate a direct positive relationship between HPWS and medical service quality and we hypothesize that:
5 2.2. HPWS, Safety learning climate and Medical Service Quality
2.2.1 Safety learning climate and medical service quality
It is generally agreed that the key to improving health services lies in workplace culture (Morello et al., 2013; Pannick, Beveridge, Wachter & Sevdalis, 2014; Weaver et al., 2013). Cultural management often leads to better patient outcomes and improved medical efficiency (Sacks et al., 2015). Improving the overall workplace culture in the hospital can heighten the quality of medical services; it can also improve the quality of nursing, and bring better results for patients (Olsen, 2018).
Generally, the safety climate approach is a reflection of the safety culture at the grass-roots level and the employees' attention to the safety factors of the organization (Flin,2007; Olsen,2009). The attributes and elements of the organization are included in the safety climate approach. Safety climate is more specifically related to safety than the broader concept of organizational climate. The safety climate evaluates employee's perception of labor habits and behaviors in the work environment, and it reflects the importance of safety compared to other organizational goals (Flin et al., 2006).
According to Olsen's (2018) study, there are several organizational factors that can interact and affect the safety environment of Norwegian hospitals. Therefore, he established a multi-level system method model to prove his conjecture. This model includes three levels: hospital level, department leadership level, and employee level. This includes: at the hospital level, there must be a positive security atmosphere and cross department team cooperation support, leaders must establish sufficient staffing, and employees must learn and develop. The safety culture will enhance after improving all these factors at different levels, which will increase medical service quality. So, safety learning climate is positively linked to higher medical service quality.
2.2.2 HPWS and safety learning climate
Through HPWS, a safety learning climate can be effectively established, and HPWSs have a positive impact on safety performance. Zacharatos, Barling, and Iverson (2005) found HPWSs improve employee safety and the safety learning atmosphere in the organization by
6 increasing employee trust in management and employees' perception of a strong security atmosphere.
These HPWSs include Pfeffer's (1998) seven factors (employment security, selective hiring, extensive training, teams and decentralized decision making, reduced status distinctions, information sharing, and contingent compensation). The employment security in HPWS refers to providing stable employment for employees. Employment security means that employees can be rewarded for their commitment to the company. It also means that the organization is willing to invest time and resources for employees. As a result, as employee safety increases, trust in management will increase, and employees who trust management may be more inclined to work in a safe manner (Cascio, 1993). Extensive training is also a type of HPWS. Occupational safety training is widely used in organizations as training enables employees to gain greater ability to control their work, and so they can perform their work more safely. In addition, self-managed teams can increase the familiarity between the organization’s personnel and make individuals feel more responsible for the safety of themselves and each other; the team can also strengthen the exchange of ideas to provide better solutions, which improve occupational safety, and finally achieve the goal of a safer learning atmosphere. In addition to these, three other equally important practices (transformational leadership, high-quality work, and measurement of management practices) are useful in enhancing the safety learning atmosphere (Barling, Kelloway, & Iverson, 2003; Barling, Loughlin, & Kelloway, 2002). Thus, HPWS is logically built to favor learning climate. Because of this connection, we hypothesize that:
H2: Safety learning climate mediates the positive relation between HPWS and medical service quality
2.3. Participatory safety, HPWS and safety learning climate
The definition of participatory safety comes from West (1990) four factor theory, which refers to the interaction of team members in a participatory and interpersonal environment without threat. By definition, “participative safety is a psychological construct in which the contingencies are such that involvement in decision-making is motivated and reinforced while occurring in an environment which is perceived as interpersonally nonthreatening” (West, 1990, p. 311).
7 There are two interrelated concepts: participation in decision making and intra group safety (West, 1990). The former mainly refers to people's enthusiasm to participate in the decision-making process, share information and listen to each other's idea. The author believes that the more employees are able to participate in decision-making in various ways, such as making suggestions or sharing information, the more likely they are to put their best efforts into these decisions and to propose new ideas conducive to improving working methods. Therefore, the formation of participative safety is related to the active participation of employees in group activities. Among them, intra group safety is extremely important. This is an interpersonal atmosphere of mutual trust, mutual support, and no threat to each other. When team members are filled with non-threatening interpersonal atmosphere and trust, they are more willing to propose new ideas because they do not care about the negative judgments of others (Anderson & West, 1998). For example, when all members of an organization can propose new ideas and solve problems in a non-judgmental environment, participatory security is usually essential (Rogers, 1983). Research from Paolillo and Silva (2019) shows that in the relationship of trust in communication and safety participation behaviours, group safety climate plays an mediational role, and co-workers’ safety climate is more influential than supervisor’s safety climate in the results. This also illustrates the importance of a good climate among colleagues. This kind of people's active participation in the decision-making process, as well as an equal organizational atmosphere, is precisely related to some practices in HPWS, so we established the following hypothesis:
H3: Participatory safety positively moderates the relation between HPWS and safety learning climate
Overall, the hypotheses are integrated into a research model that configures a moderated mediation, as follows (Figure 1).
8 Figure 1
Conceptual Model
H1: HPWS is positively associated with medical service quality
H2: Safety learning climate mediates the positive relation between HPWS and medical service quality
H3: Participatory safety positively moderates the relation between HPWS and safety learning climate
Hypotheses pertaining the dependent variable will split into several sub-hypotheses to reflect each of service quality dimensions under analysis. So, H1a and H2a will concern service quality response, H1b and H2b service quality reliability, and H1c and H2c service quality assurance.
9 3. Method
3.1. Procedure
Data was collected with an online questionnaire that stated the nature of the survey, that participants were invited to freely participate, with guarantees of anonymity and confidentiality. That they could quit at any time without consequence. The invitation was sent with a link via WeChat to targeted contacts that were healthcare workers actively engaged in hospital settings as well as posted in a social media platform. A total of 135 answers was received from which 129 were usable answers, thus corresponding to a response rate of 95.6%.
3.2. Sample
The sample comprises 129 healthcare professionals, mainly females (53.5%), from a young age group (93.8% are aged up to 34 years old) mostly working in 3rd tier (82.9%) and 2nd tier (13.2%) public general hospitals, in Guangdong, China. The majority of participants are doctors (91.5%) and hold at least a Bachelor degree (95.3%), and is mostly occupying a junior position as assistant doctors. Expectably, for such a junior working population, the organizational tenure matches the professional tenure with approximately 85% working up to 5 years.
3.3. Measures
Except where indicated, participants were requested to answer in a 7-point Likert scale (1=Strongly disagree to 7=Strongly agree)
Safety learning climate was measured with Zhu et al. (2014) scale that comprehends a single factor with 5 items (e.g. “We are actively doing things to improve patient safety”, “Lessons learned from previous mistakes have led to a positive change”, “Our opinions about preventing mistakes are reflected in patient safety activities”, “After we make changes to improve patient safety, we evaluate their effectiveness”, and “In this unit, anyone who violates standard procedures or safety rules is swiftly corrected”. The measure is reliable (Cronbach alpha=.886).
10 HPWS was measured with an adaptation of the seven Pfeffer (1998) dimensions extended from Boon, Hartog and Lepak (2019) indication. Each practice was represented with two items. The practices concern traditional HRM domains of practice (i.e. Selective hiring, Extensive training, Performance management, Generous contingent compensation, and Career management) as well as complementary practices (i.e. Job security, autonomous teams, Low status distinction, Extensive sharing of financial / performance). All reliabilities are found to be between .719 and .918, to the exception of selective hiring (rSB=.576) and generous
compensation (rSB =.635). Although this may create issues the global Cronbach alpha for the
18 items is .93, which indicates we can work with an overall index. <so, the overall index was computed as a simple means.
Participatory safety was measured with Kivimaki, and Elovainio (1999) scale that comprehends 4 items (e.g. “People keep each other informed”, or “Real attempts to share information”). The measure is reliable (Cronbach alpha=.871).
Service quality was measured with three factors taken from SERVQUAL (Parasuraman, Zeithaml & Berry, 1985) and Berry, Seiders & Grewal (2002) as used in hospital settings in China by Chang, Chen and Lan (2013). The factors were “Service response” (3 items, i.e. “The entire service process has a good feedback system and management”, “The entire service process allows questions to be answered easily”, and “The entire service process can complete service in a short period of time”, Cronbach alpha=.872), “Service reliability” (3 items, i.e. “The entire service process has complete record of transaction details”, “The entire service process is able to correctly complete designated service items”, and “The entire service process has no error”, Cronbach alpha=.803), and “Service assurance” (3 items, i.e. “The entire service process can fulfill its promise to customers”, “The entire service process has a good security mechanism”, and “The entire service process is trustworthy”, Cronbach alpha=.794).
Control variables were used to account for possible effects due to: time related variables (age 1=18 to 24 years old, 2=25-34, 3=35-44, 4=45 to 54, 5=55 or more; organizational tenure 1=up to 5 years, 2=6 to 10, 3=11 to 15, 4=16 or more; professional tenure 1=up to 5 years, 2=6 to 10, 3=11 to 15, 4=16 or more), to gender (1=male, 2=female), to organizational context (nature of hospital, 1=specialized, 2=general, 3=community, 4=other and hospital level, 1=3rd tier, 2=2nd tier, 3=1st tier, 4=other), professional variables (profession, 1=doctor, 2=nurse,
11 3=administrative staff, 4=other; category, 1=professor, 2=associate professor, 3=lecturer, 4=assistant professor) and education (1=up to bachelor, 2=bachelor, 3=master, 4=doctorate).
3.4. Data analysis strategy
Data was firstly screened for unusable answers due to missing data and monotonous answers which indicate that the respondent did not pay enough attention. We have also checked the time of response that allows to cross check if monotonous answer could be attributed to this cause.
After guaranteeing the quality of data, we tested for measure reliability via Cronbach alpha (that should attain at least .70, Nunnally, 1978) as well as Spearman-Brown corrected correlation for cases than included only two items.
Data analysis descriptive focus on means and standard deviations and bivariate statistics are shown with Pearson correlation, that is considered significant at p values below .05. Lastly, the hypotheses are tested with Process Macro (Hayes, 2018) which allows for the simultaneous test of all parameters according to the designated model. In the case of the proposed model of analysis, we opted for model 7, matching a moderated mediation model, with the moderation occurring in the first step, between the predictor and the mediator. The Process Macro will compute direct, indirect and total effects for all paths in the model (where suitable) as well as the conditional effects depending in the moderator. Thus, for each case the program shows a coefficient (that stands as a B in the regression analysis) with a t-test a p value and, most importantly, a bootstrapped interval comprehending the lower bound and the upper bound of the effect found for a confidence interval of 95%. As recommended by Hayes (2018) the number of repetitions is set to 5000.
12 (this page is purposively blank)
13 4. Results
Findings firstly concern the descriptive statistics as well as the bivariate correlations, and then the hypothesis testing.
As stated, the sample is rather young, occupying junior positions and having correspondingly low organizational and professional tenures. However, the sample is highly educated as expectable in a doctor population. The highest mean concerns safety learning climate which averages 5.91 and has the lowest choice set at 3, which means, no one from the sample perceives it as being very low. Service quality also ranges from 4.9 to 5.26 which is moderately high (the original sample ranges 1 to 7). Participatory safety averages similarly (5.26) but shows a wider variation from minimum (1.75) to maximum (7) suggesting is varies more across organizational settings. Lastly, HPWS have the lowest mean (4.78), also leaning rightwards to the scale midpoint towards the more positive half of the scale, but having cases where the mean can be as low as 2.06, in clear indication that there are settings where such practices are perceived as almost inexistent.
Bivariate statistics (Table 1) show that almost no significant association is found between control variables and those that compose the model of analysis. The only cases that deserve mention are gender and hospital tier where females seem to report higher service quality (reliability and assurance) than males in a same manner than participants working in lower tier hospitals seem to report higher service quality (response and assurance) than those working in higher tier hospitals. The magnitude of correlations is however, very modest (around .19, p<.05). Overall, the absence of significant correlations encourages the model, although for safety sake we opt control for all variables in the hypothesis testing.
Bivariate statistics also show that all variables in the model have positive correlations. It is especially encouraging that HPWS has a strong correlation with service quality indicators (ranging from .509, p<.01 to .713, p<.01) as well as with the safety learning climate (.451, p<.01). Safety learning climate is also strongly correlated with the service quality indicators (averaging .536, p<.01), which enables the possible mediation effect. The moderator is also positively correlated with all these variables, although with lesser magnitude (ranging from .411 p<.01 to .594, p<.01).
14 Table 1
Descriptive and bivariate statistics
Min-max means sd 1 2 3 4 5 6 7 8 9 10 11 12 13 14 1. Gender 1-2 - - 1 2. Age 1-5 1.95 .653 -.113 1 3. Education 1-4 2.29 .578 -.271** -.115 1 4. Nature of hospital 1-4 - - .055 -.208* -.004 1 5. Hospital tier 1-4 - - .164 -.207* -.186* .298** 1 6. Category 1-5 - - .166 -.629** -.025 .182* .116 1 7. Profession 1-4 - - .112 -.001 -.181* .091 .203* .334** 1 8. Professional tenure 1-4 1.29 .775 -.007 .687** -.193* -.068 -.095 -.666** .047 1 9. Organizational tenure 1-4 1.28 .760 .005 .714** -.217* -.049 -.100 -.677** .056 .955** 1 10. HPWS 2.06-6.83 4.78 .953 .163 -.138 .012 .074 .153 .140 .085 -.135 -.127 1 11. SLCmean 3.40-7.00 5.91 .729 .117 -.126 -.019 .133 .012 .034 -.088 -.065 -.080 .451** 1 12. SQres 1.00-7.00 4.90 1.101 .084 -.117 -.015 .088 .189* .072 -.034 -.005 -.016 .713** .510** 1 13. SQreli 2.33-7.00 5.24 1.008 .193* -.061 -.129 .053 .150 .066 .030 -.013 -.011 .509** .609** .611** 1 14. SQassurance 3.00-7.00 5.26 .883 .175* -.113 -.010 .110 .188* .088 -.035 .000 -.016 .537** .497** .600** .739** 1 15. PSmean 1.75-7.00 5.26 .965 .117 -.044 .051 .008 .160 -.005 .056 -.058 -.054 .662** .411** .594** .512** .422** *p<.05; ** p<.01
15 As stated, hypotheses are tested simultaneously, and so, in this section we show the results from all paths linking the variables, the direct and indirect effects, the respective bootstrapped intervals for each estimated coefficient and the case for the moderated mediation effect. Because the program operates with one dependent variable at a time, we conducted three separate tests, one for service quality response, another for service quality reliability, and another one for service quality assurance.
Table 2 shows the main findings for all these tests.
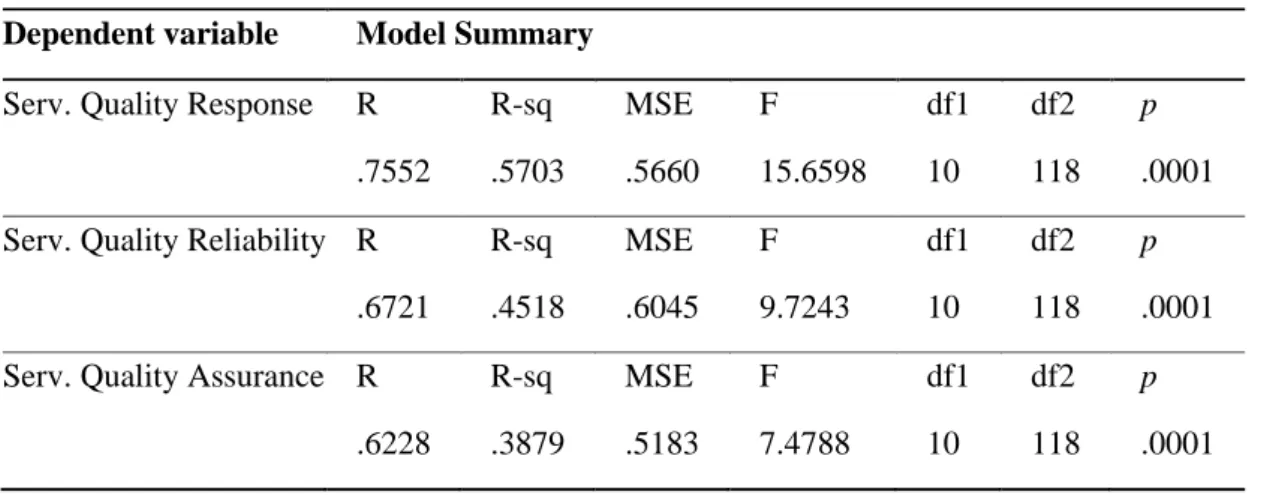
The moderation test showed the overall model is able to account for 57% of variance of the service quality response, 45% of service quality reliability, and 39% of service quality assurance (see Table 2).
Table 2
Model summary for sales growth, financial performance, and profitability Dependent variable Model Summary
Serv. Quality Response R R-sq MSE F df1 df2 p
.7552 .5703 .5660 15.6598 10 118 .0001 Serv. Quality Reliability R R-sq MSE F df1 df2 p
.6721 .4518 .6045 9.7243 10 118 .0001 Serv. Quality Assurance R R-sq MSE F df1 df2 p
.6228 .3879 .5183 7.4788 10 118 .0001
The results for the conditional mediation are shown for each dependent variable in tables 2.1 to 2.3.
16 Table 2.1
Results for Conditional Mediation for Service Quality Response
B SE t BootLLCI BootULCI
Mediator variable model
Constant 6.4913 .7790 8.3332 4.9486 8.0340
HPWS (predictor) .1987 .0784 2.5336 .0434 .3539 Participatory safety (mod) .2219 .0791 2.8064 .0653 .3785 HPWS*Participatory Safety .1617 .0540 2.9966 .0548 .2686
Dependent variable model
Constant 1.6538 1.1566 1.4299 -.6365 3.9442
HPWS .6880 .0791 8.6953 .5313 .8447
Safety learning climate (med) .3537 .1041 3.3964 .1475 .5599
Effect BootSE BootLLCI BootULCI Conditional Indirect effect analysis
M – 1 SD (5.26 -.9650 + = 4.295) .0151 .0475 -.0662 .1265
M (5.26) .0703 .0480 .0019 .1850
M + 1 SD (5.26+.9650 = 6.225) .1255 .0646 .0268 .2749
Johnson-Neyman Effect SE t BootLLCI BootULCI
1.74 (5.26-3.5194) -.3704 .2148 -1.7245 -.7958 .0550 5.02 (5.26-.2356) .1606 .0811 1.9805 .0000 .3211 (...)
7.00 (5.26+1.7306) .4785 .1137 4.2068 .2532 .7037
Moderated mediation Index BootSE BootLLCI BootULCI
Participatory safety .0572 .0312 .0060 .1281
Table 2.1 depicts the main findings for the moderated mediated model. It firstly shows the association coefficients between the predictor (HPWS), the moderator (Participatory safety) and the mediator (Safety learning climate) variables as well as the interaction effect (HPWS * Participatory safety). Findings show both the predictor and the moderator are positively associated with safety learning climate. As regards the dependent variable model (service
17 quality response) findings show a significant positive association with HPWS (B=.6880, CI95 [LL.5313; UL.8447]) which supports H1a. The indirect effect (B=.0703) is also significant (CI95 [LL.0019; UL.1850]) and positive, which support H2a. Finally, the moderation effect is found to be significant with a positive B=.1617 (CI95 [LL.0548; UL.2686]) which supports H3.
Table 2.2
Results for Conditional Mediation for Service Quality Reliability
B SE t BootLLCI BootULCI
Mediator variable model
Constant 6.4913 .7790 8.3332 4.9486 8.0340
HPWS (predictor) .1987 .0784 2.5336 .0434 .3539 Participatory safety (mod) .2219 .0791 2.8064 .0653 .3785 HPWS*Participatory Safety .1617 .0540 2.9966 .0548 .2686
Dependent variable model
Constant 0.6067 1.1953 0.5076 -1.7603 2.9737
HPWS .2755 .0818 3.3690 .1136 .4374
Safety learning climate (med) .6987 .1076 6.4916 .4855 .9118
Effect BootSE BootLLCI BootULCI Conditional Indirect effect analysis
M – 1 SD (5.26 -.9650 + = 4.295) .0426 .0997 -.1548 .2400
M (5.26) .1987 .0784 .0434 .3539
M + 1 SD (5.26+.9650 = 6.225) .3547 .0882 .1800 .5294
Johnson-Neyman Effect SE t BootLLCI BootULCI
1.74 (5.26-3.5194) -.3704 .2148 -1.7245 -.7958 .0550 5.02 (5.26-.2356) .1606 .0811 1.9805 .0000 .3211 (...)
7.00 (5.26+1.7306) .4785 .1137 4.2068 .2532 .7037
Moderated mediation Index BootSE BootLLCI BootULCI
18 Table 2.2 replicates findings for the dependent variable model (service quality reliability). Results show a significant positive association with HPWS (B=.2755, CI95 [LL.1136; UL.4374]) which supports H1b. The indirect effect (B=.1987) is also significant (CI95 [LL.0434; UL.3539]) and positive, which supports H2b. Finally, the moderation effect is exactly the same as previously showed and so, H3 is again supported with this set of data and variables.
Table 2.3
Results for Conditional Mediation for Service Quality Assurance
B SE t BootLLCI BootULCI
Mediator variable model
Constant 6.4913 .7790 8.3332 4.9486 8.0340
HPWS (predictor) .1987 .0784 2.5336 .0434 .3539 Participatory safety (mod) .2219 .0791 2.8064 .0653 .3785 HPWS*Participatory Safety .1617 .0540 2.9966 .0548 .2686
Dependent variable model
Constant 1.4328 1.1068 1.2945 -.7590 3.6246
HPWS .3378 .0757 4.4616 .1879 .4878
Safety learning climate (med) .3888 .0997 3.9008 .1914 .5861
Effect BootSE BootLLCI BootULCI Conditional Indirect effect analysis
M – 1 SD (5.26 -.9650 + = 4.295) .0426 .0997 -.1548 .2400
M (5.26) .1987 .0784 .0434 .3539
M + 1 SD (5.26+.9650 = 6.225) .3547 .0882 .1800 .5294
Johnson-Neyman Effect SE t BootLLCI BootULCI
1.74 (5.26-3.5194) -.3704 .2148 -1.7245 -.7958 .0550 5.02 (5.26-.2356) .1606 .0811 1.9805 .0000 .3211 (...)
7.00 (5.26+1.7306) .4785 .1137 4.2068 .2532 .7037
Moderated mediation Index BootSE BootLLCI BootULCI
19 Table 2.3 replicates findings for the dependent variable model (service quality assurance). Results show a significant positive association with HPWS (B=.3378, CI95 [LL.1879; UL.4878]) which supports H1c. The indirect effect found is exactly the same as the previous analysis (B=.1987; CI95 [LL.0434; UL.3539]) which supports H2c. Finally, the moderation effect is unaltered and H3 is again supported.
The moderation graphic (Figure 2) depicts the interaction found in all three analyses, and allows for an interpretation on how the moderator conditions the relationship between HPWS and safety learning climate.
Figure 2
The moderation graph
The graphic clearly shows that safety learning climate is relatively lower when participatory safety is low and it does not make aby difference if hospitals have or not HPWS (the regression line corresponds to a non-significant association coefficient). Conversely, when hospital do not have HPWS but participatory safety is high, safety learning climate will remain relatively low, but when hospitals have HPWS under these conditions, safety learning climate substantially increases up to approximately 6.4 (at one standard deviation above HPWS means). Generally, the best possible situation occurs when hospitals have both established HPWS and
20 high safety participatory environment. This is the situation that maximizes safety learning climate.
21 5. Discussion and Conclusion
In healthcare management, professionals such as physicians and nurses, play a key role in guaranteeing health delivery is done with excellence, and that organizations achieve top level of service quality. Such professionals require good HRM practices, such as HPWS, that are known to foster higher motivation, organizational commitment and willingness to go beyond minimum professional role. Because such professionals are highly qualified, the scientific knowledge develops quickly, and they are often faced with clinical situations that are complex and require the input from many professionals domains, continuous learning and fostering a climate where people learn and are comfortable to participat and feel at ease to share their thoughts, is fundamental for the professional service. In healthcare one of the critical dimensions is safety. A safety learning climate is therefore part of the good practices that HRM should foster in a working environment. Putting together these variables, the conceptual model depicted a mediation of safety learning climate between HPWS and medical service quality where participatory safety should facilitate, via interaction effect, how much HPWS builds such safety learning climate.
Findings show that HPWS has a direct positive effect on medical service quality supporting the first hypothesis. This evidence corroborates HPWS as a useful tool in the medical industry because it has a positive effect on the quality of employees’ work (Ogbonnaya, 2018). This also shows precisely that the effectiveness of HPWS has been proven in the public health care sector we studied in China. This finding is also in line with Pfeffer's theory that HPWS impact is universally positive, i.e. that it has positive outcomes regardless of industry or organization (Pfeffer, 1994).
Findings also show that when evaluating from three aspects: service quality response, service quality reliability, and service quality assurance, safety learning climate has an active mediating role in HPWS and service quality, this supporting hypothesis 2. With this mediation effect, HPWS gives a good answer to the critical need for a strong safety learning climate in healthcare which is also a contributive factor to increase medical service quality. This mediation brings light to a mechanism that links the overall philosophy of modern HRM, expressed in HPWS, that is in line with higher qualified work and more need for continuous self-directed improvement.
22 Another important finding concerns the participatory safety moderation in the positive effect between HPWS and safety learning climate. That is to say, under the premise of a high participatory safety, HPWS is more likely to positive foster the safety learning climate. However, if the participatory safety is low, HPWS will not lead to higher safety learning climate. This finding supports hypothesis 3 and further proves the importance of participatory safety. In other words, a highly participatory safety environment and HPWS is indispensable in creating a safety learning climate.
These findings must be gauged against the methodological options made in this empirical study. Firstly, the sample is not very large although the population studied is truly difficult to mobilize as their work rhythm and attention demand is constant and very high. However, from a technical point of view, the data analysis used with Process Macro, does conduct bootstrapping which mitigates possible issues arising from relatively smaller samples. Secondly, opting for a cross-sectional design was an option that allowed for a timely data collection as the repeated call for survey filling would require a much larger sample at the beginning and could actually be found to be too low at the end of the data collection waves. The main issue that cross-sectional design has concerns our inability to actually clarify is the variables behave in the way they do in real settings, or if their associations just reflect the opinion of respondents, based on their own theory or their expectations about what makes sense. This common-method/source bias is a major issue that has been well documented and should be a matter of concern in conducting research (Podsakoff et al., 2012). However, we did take measures to reduce the occurrence of common method, namely by stating the questionnaire was anonymous, that data would be treated at aggregated level only, that there were no right or wrong answers and the respondent could quit at any time. We also showed a contact if the respondent would like to put a doubt or just to ascertain this was a legitimate study. Also, the existence of an interaction effect would not be expectable in common method bias occurred (Siemsen, Roth & Oliveira, 2010) and the intercorrelations between the directly linked variables in the study are not overly large (only one correlation is above .700) therefore we trust this was not an issue in this research.
To tackle these limitations, future studies might benefit from a multi-wave design (targeting also a larger sample), and evolve by adopting a multi-level approach where safety learning climate is measured at the team level instead of being measured at individual level. It could also be promising to differentiate between the several types of medical services as the
23 dynamics and clinical complexity may change and thus alter the importance of these variables. We also think one of the options made in this research should be adopted in the future, which is controlling for many variables that could explain possible outcomes, namely, age, education, the nature of the hospital, the level of the hospital, the professional category (clinical and teaching), and the professional and organizational tenure. However, due to the specific dynamics of hospitals (reflecting e.g. their tier) it is possible that some of these variables are indeed moderators. This can be further explored in future research.
To conclude, this study shows that HPWS in HRM practices can directly improve medical service quality, and that safety learning climate mediates the positive association between HPWS and medical service quality. The study also highly encourages participatory safety because it seems to be indispensable in creating a safety learning climate as it leverages HPWS effects. These findings have both a theoretical and practical value. From the theory point of view they help uncover the mechanisms that link HPWS to positive outcomes in healthcare. From the practical point of view, healthcare managers should not only invest in HPWS as they should also foster a safety learning climate and a culture of participatory safety, so that professionals can develop up to their maximum level while leveraging up organizational outcomes as important as medical service quality. Out results provide a way to improve the final quality of service in the workplace and illustrate the role of innovative human resource management in public health organizations.
7. References
Anderson, N. R., & West, M. A. 1998. Measuring climate for work group innovation: development and validation of the team climate inventory. Journal of Organizational Behavior: The International Journal of Industrial, Occupational and Organizational Psychology and Behavior, 19(3), 235-258.
Appelbaum, E., Bailey, T., Berg, P., & Kalleberg, A. L. 2001. Do high performance work systems pay off?. Research in Sociology of work, 85-108.
Barling, J., Kelloway, E. K., & Iverson, R. D. 2003. High-quality work, job satisfaction, and occupational injuries. Journal of applied psychology, 88(2), 276-283.
Barling, J., Loughlin, C., & Kelloway, E. K. 2002. Development and test of a model linking safety-specific transformational leadership and occupational safety. Journal of applied psychology, 87(3), 488-496.
Bartram, T., Karimi, L., Leggat, S. G., & Stanton, P. 2014. Social identification: linking high performance work systems, psychological empowerment and patient care. The
24 Berry, L. L., Seiders, K., & Grewal, D. 2002. Understanding service convenience. Journal of
Marketing, 66(3), 1-17.
Boon, C., Boselie, J. P., & Dietz, G. 2005. Commonalities and contradictions in research on human resource management and performance. Human resource management, 15(3), 67-94.
Boon, C., Den Hartog, D. N., & Lepak, D. P. 2019. A systematic review of human resource management systems and their measurement. Journal of management, 45(6), 2498-2537.
Brownstein, J. N., Hirsch, G. R., Rosenthal, E. L., & Rush, C. H. 2011. Community health workers “101” for primary care providers and other stakeholders in health care systems. The Journal of ambulatory care management, 34(3), 210-220.
Burke, R. J., & Cooper, C. L. 2006. The human resources revolution: Why putting people first matters. Reinventing Human Resource Management: Challenges and New Directions, Oxford: Elsevier.
Cascio, W. F. 1993. Downsizing: What do we know? What have we learned?. Academy of Management Perspectives, 7(1), 95-104.
Chang, C. S., Chen, S. Y., & Lan, Y. T. 2013. Service quality, trust, and patient satisfaction in interpersonal-based medical service encounters. BMC health services
research, 13(1), 22-32.
Chuang, E., Dill, J., Morgan, J. C., & Konrad, T. R. 2012. A configurational approach to the relationship between high‐performance work practices and frontline health care worker outcomes. Health Services Research, 47(4), 1460-1481.
Flin, R. 2007. Measuring safety culture in healthcare: a case for accurate diagnosis. Safety Science, 45(6), 653-667.
Flin, R., Burns, C., Mearns, K., Yule, S., & Robertson, E. M. 2006. Measuring safety climate in health care. BMJ Quality & Safety, 15(2), 109-115.
Gittell, J. H., Seidner, R., & Wimbush, J. 2010. A relational model of how high-performance work systems work. Organization science, 21(2), 490-506.
Gkorezis, P., & Theodorou, M. 2016. High-Performance Work Practices in Healthcare Sector. In Effective Methods for Modern Healthcare Service Quality and
Evaluation (pp. 16-44). IGI Global.
Gowen, C. R., McFadden, K. L., & Tallon, W. J. 2006. On the centrality of strategic human resource management for healthcare quality results and competitive advantage. Journal of management development, 25 (8), 806-826.
Harmon, J., Scotti, D. J., Behson, S., & Farias, G. 2003. Effects of high-involvement work systems on employee satisfaction and service costs in veterans healthcare. Journal of healthcare management, 48(6), 393-406.
Hayes, A. F. 2018. Partial, conditional, and moderated moderated mediation: Quantification, inference, and interpretation. Communication Monographs, 85(1), 4-40.
Kivimaki, M., & Elovainio, M. 1999. A short version of the Team Climate Inventory: Development and psychometric properties. Journal of Occupational and
Organizational Psychology, 72(2), 241-246.
Leggat, S. G., Bartram, T., Casimir, G., & Stanton, P. 2010. Nurse perceptions of the quality of patient care: confirming the importance of empowerment and job satisfaction. Health Care Management Review, 35(4), 355-364.
McDermott, A. M., Keating, M. A., Hyde, P., Sparrow, P., Boaden, R., & Harris, C. 2013. High performance HRM: NHS employee perspectives. Journal of Health Organization and management, 27 (3), 296-311.
25 Morello, R. T., Lowthian, J. A., Barker, A. L., McGinnes, R., Dunt, D., & Brand, C. 2013.
Strategies for improving patient safety culture in hospitals: a systematic review. BMJ Quality & Safety, 22(1), 11-18.
Nunnally, J. C. 1978. Psychometric Theory: 2d Ed. McGraw-Hill.
Ogbonnaya, C., & Valizade, D. 2018. High performance work practices, employee outcomes and organizational performance: a 2-1-2 multilevel mediation analysis. The
International Journal of Human Resource Management, 29(2), 239-259.
Olsen, E. 2009. Safety climate and safety culture in health care and the petroleum industry: psychometric quality, longitudinal change, and structural models. PhD Thesis,
University of Stavanger, Norway.
Olsen, E. 2018. Influence from organisational factors on patient safety and safety behaviour among nurses and hospital staff. International Journal of Organizational Analysis, 26 (2), 382-395.
Pannick, S., Beveridge, I., Wachter, R. M., & Sevdalis, N. 2014. Improving the quality and safety of care on the medical ward: a review and synthesis of the evidence
base. EuropeanJjournal of Internal Medicine, 25(10), 874-887.
Paolillo, A. & Silva, S.A. 2019. Trust and safety participation: co-workers’ safety climate matters. In: 19th Congress of the European Association of Work and Organizational Psychology (EAWOP): Working for the greater good; 29 May - 01 Jun 2019, Turin, Italy.
Parasuraman, A., Zeithaml, V. A., & Berry, L. L. 1985. A conceptual model of service quality and its implications for future research. Journal of marketing, 49(4), 41-50. Pearson, S. D., Schneider, E. C., Kleinman, K. P., Coltin, K. L., & Singer, J. A. 2008. The
impact of pay-for-performance on health care quality in Massachusetts, 2001– 2003. Health Affairs, 27(4), 1167-1176.
Pfeffer, J. 1994. Competitive advantage through people: Unleashing the power of the workforce. Boston, MA: Harvard Business School Press.
Pfeffer, J. 1996. Competitive Advantage through People: Unleashing the Power of the Workforce. Cambridge, MA: Harvard Business School Press.
Pfeffer, J. 1998. The human equation: Building profits by putting people first. Boston: Harvard Business School Press.
Podsakoff, P.M., Mackenzie, S.B. and Podsakoff, N.P. 2012. Sources of Method Bias in Social Science Research and Recommendations on How to Control It. Annual Review of Psychology, 63, 539-569.
Rogers, E. M. 1983. Diffusion of Innovations, The Free Press, New York.
Sacks, G. D., Shannon, E. M., Dawes, A. J., Rollo, J. C., Nguyen, D. K., Russell, M. M., ... & Maggard-Gibbons, M. A. 2015. Teamwork, communication and safety climate: a
systematic review of interventions to improve surgical culture. BMJ Quality & Safety, 24(7), 458-467.
Schindel, J., O'Neal, E., Iammartino, B., Solomon, K., Cherner, D., & Santimauro, J. 2006. Workers who care: A graphical profile of the frontline health and health care workforce. Report by WHS Work Healthcare Solutions, S. Francisco: Robert Wood Johnson Foundation.
Siemsen, E., Roth, A., & Oliveira, P. (2010). Common method bias in regression models with linear, quadratic, and interaction effects. Organizational research methods, 13(3), 456-476.
Standing, H., & Chowdhury, A. M. R. 2008. Producing effective knowledge agents in a pluralistic environment: what future for community health workers?. Social science & medicine, 66(10), 2096-2107.
26 Sullivan, J. 2004. Rethinking Strategic HR-HR’Role in Building a Performance
Culture. Published by CCH.
Weaver, S. J., Lubomksi, L. H., Wilson, R. F., Pfoh, E. R., Martinez, K. A., & Dy, S. M. 2013. Promoting a culture of safety as a patient safety strategy: a systematic
review. Annals of internal medicine, 158(5_Part_2), 369-374.
West, M. A., & Farr, J. L. (Eds.). 1990. Innovation and Creativity at Work: Psycological and Organizational Strategies. John Wiley.
West, M. A., Guthrie, J. P., Dawson, J. F., Borrill, C. S., & Carter, M. 2006. Reducing patient mortality in hospitals: the role of human resource management. Journal of
Organizational Behavior: The International Journal of Industrial, Occupational and Organizational Psychology and Behavior, 27(7), 983-1002.
Young, S., Bartram, T., Stanton, P., & Leggat, S. G. 2010. High performance work systems and employee well‐being. Journal of health organization and management.
Zacharatos, A., Barling, J., & Iverson, R. D. 2005. High-performance work systems and occupational safety. Journal of applied psychology, 90(1), 77-93.
Zhu, J., Li, L., Zhao, H., Han, G., Wu, A. W., & Weingart, S. N. 2014. Development of a patient safety climate survey for Chinese hospitals: cross-national adaptation and psychometric evaluation. BMJ Quality & Safety, 23(10), 847-856.
27 8. Appendix
Appendix 1
Process output for Quality Service Response
Run MATRIX procedure:
***************** PROCESS Procedure for SPSS Version 3.4 ***************** Written by Andrew F. Hayes, Ph.D. www.afhayes.com
Documentation available in Hayes (2018). www.guilford.com/p/hayes3
************************************************************************** Model : 7 Y : SQres X : HPWSgl M : SLCmean W : PSmean Covariates:
Age Educat HospNat HospLev Category Position ProTenur OrgTenur Sample Size: 129 ************************************************************************** OUTCOME VARIABLE: SLCmean Model Summary R R-sq MSE F df1 df2 p ,5602 ,3139 ,3991 4,8654 11,0000 117,0000 ,0000 Model
coeff se t p LLCI ULCI
constant 6,4913 ,7790 8,3332 ,0000 4,9486 8,0340 HPWSgl ,1987 ,0784 2,5336 ,0126 ,0434 ,3539 PSmean ,2219 ,0791 2,8064 ,0059 ,0653 ,3785 Int_1 ,1617 ,0540 2,9966 ,0033 ,0548 ,2686 Age -,1050 ,1323 -,7931 ,4293 -,3670 ,1571 Educat -,1304 ,1049 -1,2433 ,2163 -,3381 ,0773 HospNat ,2120 ,1451 1,4611 ,1467 -,0754 ,4994 HospLev -,1502 ,0968 -1,5524 ,1233 -,3419 ,0414 Category -,0426 ,1282 -,3325 ,7401 -,2965 ,2113 Position -,1653 ,1110 -1,4892 ,1391 -,3850 ,0545 ProTenur ,1982 ,2629 ,7540 ,4524 -,3224 ,7188
28 OrgTenur -,2243 ,2836 -,7908 ,4306 -,7859 ,3374
Product terms key:
Int_1 : HPWSgl x PSmean
Test(s) of highest order unconditional interaction(s): R2-chng F df1 df2 p
X*W ,0527 8,9797 1,0000 117,0000 ,0033 ---
Focal predict: HPWSgl (X) Mod var: PSmean (W)
Conditional effects of the focal predictor at values of the moderator(s): PSmean Effect se t p LLCI ULCI
-,9650 ,0426 ,0997 ,4275 ,6698 -,1548 ,2400 ,0000 ,1987 ,0784 2,5336 ,0126 ,0434 ,3539 ,9650 ,3547 ,0882 4,0206 ,0001 ,1800 ,5294 Moderator value(s) defining Johnson-Neyman significance region(s): Value % below % above
-,2356 37,9845 62,0155
Conditional effect of focal predictor at values of the moderator: PSmean Effect se t p LLCI ULCI -3,5194 -,3704 ,2148 -1,7245 ,0873 -,7958 ,0550 -3,2569 -,3280 ,2017 -1,6264 ,1066 -,7273 ,0714 -2,9944 -,2855 ,1887 -1,5134 ,1329 -,6592 ,0881 -2,7319 -,2431 ,1759 -1,3822 ,1695 -,5914 ,1052 -2,4694 -,2006 ,1633 -1,2288 ,2216 -,5240 ,1227 -2,2069 -,1582 ,1510 -1,0478 ,2969 -,4572 ,1408 -1,9444 -,1157 ,1390 -,8326 ,4068 -,3911 ,1596 -1,6819 -,0733 ,1275 -,5748 ,5665 -,3258 ,1792 -1,4194 -,0309 ,1166 -,2646 ,7918 -,2618 ,2001 -1,1569 ,0116 ,1065 ,1089 ,9135 -,1993 ,2224 -,8944 ,0540 ,0973 ,5552 ,5799 -,1387 ,2468 -,6319 ,0965 ,0895 1,0777 ,2834 -,0808 ,2738 -,3694 ,1389 ,0834 1,6656 ,0985 -,0263 ,3041 -,2356 ,1606 ,0811 1,9805 ,0500 ,0000 ,3211 -,1069 ,1814 ,0794 2,2850 ,0241 ,0242 ,3386 ,1556 ,2238 ,0777 2,8787 ,0047 ,0698 ,3778 ,4181 ,2663 ,0787 3,3841 ,0010 ,1104 ,4221 ,6806 ,3087 ,0821 3,7610 ,0003 ,1461 ,4713 ,9431 ,3512 ,0877 4,0055 ,0001 ,1775 ,5248 1,2056 ,3936 ,0951 4,1409 ,0001 ,2054 ,5818 1,4681 ,4360 ,1039 4,1986 ,0001 ,2304 ,6417 1,7306 ,4785 ,1137 4,2068 ,0001 ,2532 ,7037 Data for visualizing the conditional effect of the focal predictor:
29 DATA LIST FREE/
HPWSgl PSmean SLCmean . BEGIN DATA. -,9539 -,9650 5,5684 ,0000 -,9650 5,6090 ,9539 -,9650 5,6497 -,9539 ,0000 5,6337 ,0000 ,0000 5,8232 ,9539 ,0000 6,0127 -,9539 ,9650 5,6990 ,0000 ,9650 6,0373 ,9539 ,9650 6,3756 END DATA. GRAPH/SCATTERPLOT=
HPWSgl WITH SLCmean BY PSmean .
************************************************************************** OUTCOME VARIABLE: SQres Model Summary R R-sq MSE F df1 df2 p ,7552 ,5703 ,5660 15,6598 10,0000 118,0000 ,0000 Model
coeff se t p LLCI ULCI
constant 1,6538 1,1566 1,4299 ,1554 -,6365 3,9442 HPWSgl ,6880 ,0791 8,6953 ,0000 ,5313 ,8447 SLCmean ,3537 ,1041 3,3964 ,0009 ,1475 ,5599 Age -,1155 ,1578 -,7318 ,4657 -,4280 ,1970 Educat ,0490 ,1251 ,3921 ,6957 -,1986 ,2967 HospNat -,1460 ,1731 -,8435 ,4007 -,4889 ,1968 HospLev ,2172 ,1154 1,8817 ,0623 -,0114 ,4458 Category ,2657 ,1518 1,7500 ,0827 -,0350 ,5663 Position -,2937 ,1329 -2,2099 ,0290 -,5568 -,0305 ProTenur ,3189 ,3132 1,0184 ,3106 -,3013 ,9391 OrgTenur ,1036 ,3384 ,3061 ,7600 -,5666 ,7738 Test(s) of X by M interaction: F df1 df2 p ,7120 1,0000 117,0000 ,4005
****************** DIRECT AND INDIRECT EFFECTS OF X ON Y
***************** Direct effect of X on Y
Effect se t p LLCI ULCI ,6880 ,0791 8,6953 ,0000 ,5313 ,8447
30 Conditional indirect effects of X on Y:
INDIRECT EFFECT:
HPWSgl -> SLCmean -> SQres
PSmean Effect BootSE BootLLCI BootULCI -,9650 ,0151 ,0475 -,0662 ,1265
,0000 ,0703 ,0480 ,0019 ,1850 ,9650 ,1255 ,0646 ,0268 ,2749 Index of moderated mediation:
Index BootSE BootLLCI BootULCI PSmean ,0572 ,0312 ,0060 ,1281 ---
*********************** ANALYSIS NOTES AND ERRORS
************************
Level of confidence for all confidence intervals in output: 95,0000
Number of bootstrap samples for percentile bootstrap confidence intervals: 5000
W values in conditional tables are the mean and +/- SD from the mean. NOTE: The following variables were mean centered prior to analysis: PSmean HPWSgl
NOTE: Due to estimation problems, some bootstrap samples had to be replaced. The number of times this happened was:
10
31 Appendix 2
Process output for Quality Service Reliability
Run MATRIX procedure:
***************** PROCESS Procedure for SPSS Version 3.4 ***************** Written by Andrew F. Hayes, Ph.D. www.afhayes.com
Documentation available in Hayes (2018). www.guilford.com/p/hayes3
************************************************************************** Model : 7 Y : SQreli X : HPWSgl M : SLCmean W : PSmean Covariates:
Age Educat HospNat HospLev Category Position ProTenur OrgTenur Sample Size: 129 ************************************************************************** OUTCOME VARIABLE: SLCmean Model Summary R R-sq MSE F df1 df2 p ,5602 ,3139 ,3991 4,8654 11,0000 117,0000 ,0000 Model
coeff se t p LLCI ULCI
constant 6,4913 ,7790 8,3332 ,0000 4,9486 8,0340 HPWSgl ,1987 ,0784 2,5336 ,0126 ,0434 ,3539 PSmean ,2219 ,0791 2,8064 ,0059 ,0653 ,3785 Int_1 ,1617 ,0540 2,9966 ,0033 ,0548 ,2686 Age -,1050 ,1323 -,7931 ,4293 -,3670 ,1571 Educat -,1304 ,1049 -1,2433 ,2163 -,3381 ,0773 HospNat ,2120 ,1451 1,4611 ,1467 -,0754 ,4994 HospLev -,1502 ,0968 -1,5524 ,1233 -,3419 ,0414 Category -,0426 ,1282 -,3325 ,7401 -,2965 ,2113 Position -,1653 ,1110 -1,4892 ,1391 -,3850 ,0545 ProTenur ,1982 ,2629 ,7540 ,4524 -,3224 ,7188 OrgTenur -,2243 ,2836 -,7908 ,4306 -,7859 ,3374
32 Product terms key:
Int_1 : HPWSgl x PSmean
Test(s) of highest order unconditional interaction(s): R2-chng F df1 df2 p
X*W ,0527 8,9797 1,0000 117,0000 ,0033 ---
Focal predict: HPWSgl (X) Mod var: PSmean (W)
Conditional effects of the focal predictor at values of the moderator(s): PSmean Effect se t p LLCI ULCI
-,9650 ,0426 ,0997 ,4275 ,6698 -,1548 ,2400 ,0000 ,1987 ,0784 2,5336 ,0126 ,0434 ,3539 ,9650 ,3547 ,0882 4,0206 ,0001 ,1800 ,5294 Moderator value(s) defining Johnson-Neyman significance region(s): Value % below % above
-,2356 37,9845 62,0155
Conditional effect of focal predictor at values of the moderator: PSmean Effect se t p LLCI ULCI -3,5194 -,3704 ,2148 -1,7245 ,0873 -,7958 ,0550 -3,2569 -,3280 ,2017 -1,6264 ,1066 -,7273 ,0714 -2,9944 -,2855 ,1887 -1,5134 ,1329 -,6592 ,0881 -2,7319 -,2431 ,1759 -1,3822 ,1695 -,5914 ,1052 -2,4694 -,2006 ,1633 -1,2288 ,2216 -,5240 ,1227 -2,2069 -,1582 ,1510 -1,0478 ,2969 -,4572 ,1408 -1,9444 -,1157 ,1390 -,8326 ,4068 -,3911 ,1596 -1,6819 -,0733 ,1275 -,5748 ,5665 -,3258 ,1792 -1,4194 -,0309 ,1166 -,2646 ,7918 -,2618 ,2001 -1,1569 ,0116 ,1065 ,1089 ,9135 -,1993 ,2224 -,8944 ,0540 ,0973 ,5552 ,5799 -,1387 ,2468 -,6319 ,0965 ,0895 1,0777 ,2834 -,0808 ,2738 -,3694 ,1389 ,0834 1,6656 ,0985 -,0263 ,3041 -,2356 ,1606 ,0811 1,9805 ,0500 ,0000 ,3211 -,1069 ,1814 ,0794 2,2850 ,0241 ,0242 ,3386 ,1556 ,2238 ,0777 2,8787 ,0047 ,0698 ,3778 ,4181 ,2663 ,0787 3,3841 ,0010 ,1104 ,4221 ,6806 ,3087 ,0821 3,7610 ,0003 ,1461 ,4713 ,9431 ,3512 ,0877 4,0055 ,0001 ,1775 ,5248 1,2056 ,3936 ,0951 4,1409 ,0001 ,2054 ,5818 1,4681 ,4360 ,1039 4,1986 ,0001 ,2304 ,6417 1,7306 ,4785 ,1137 4,2068 ,0001 ,2532 ,7037 Data for visualizing the conditional effect of the focal predictor:
Paste text below into a SPSS syntax window and execute to produce plot. DATA LIST FREE/
33 HPWSgl PSmean SLCmean . BEGIN DATA. -,9539 -,9650 5,5684 ,0000 -,9650 5,6090 ,9539 -,9650 5,6497 -,9539 ,0000 5,6337 ,0000 ,0000 5,8232 ,9539 ,0000 6,0127 -,9539 ,9650 5,6990 ,0000 ,9650 6,0373 ,9539 ,9650 6,3756 END DATA. GRAPH/SCATTERPLOT=
HPWSgl WITH SLCmean BY PSmean .
************************************************************************** OUTCOME VARIABLE: SQreli Model Summary R R-sq MSE F df1 df2 p ,6721 ,4518 ,6045 9,7243 10,0000 118,0000 ,0000 Model
coeff se t p LLCI ULCI
constant ,6067 1,1953 ,5076 ,6127 -1,7603 2,9737 HPWSgl ,2755 ,0818 3,3690 ,0010 ,1136 ,4374 SLCmean ,6987 ,1076 6,4916 ,0000 ,4855 ,9118 Age ,0749 ,1631 ,4593 ,6469 -,2480 ,3978 Educat -,1352 ,1292 -1,0460 ,2977 -,3911 ,1207 HospNat -,1882 ,1789 -1,0516 ,2951 -,5425 ,1662 HospLev ,1667 ,1193 1,3976 ,1648 -,0695 ,4030 Category ,1726 ,1569 1,0998 ,2736 -,1381 ,4832 Position -,0544 ,1373 -,3960 ,6928 -,3263 ,2176 ProTenur -,0506 ,3237 -,1564 ,8759 -,6916 ,5903 OrgTenur ,2025 ,3498 ,5789 ,5638 -,4901 ,8951 Test(s) of X by M interaction: F df1 df2 p ,8217 1,0000 117,0000 ,3665
****************** DIRECT AND INDIRECT EFFECTS OF X ON Y
***************** Direct effect of X on Y
Effect se t p LLCI ULCI ,2755 ,0818 3,3690 ,0010 ,1136 ,4374 Conditional indirect effects of X on Y:
34 INDIRECT EFFECT:
HPWSgl -> SLCmean -> SQreli
PSmean Effect BootSE BootLLCI BootULCI -,9650 ,0298 ,0855 -,1570 ,1834
,0000 ,1388 ,0619 ,0096 ,2561 ,9650 ,2478 ,0716 ,1055 ,3863 Index of moderated mediation:
Index BootSE BootLLCI BootULCI PSmean ,1130 ,0506 ,0161 ,2134 ---
*********************** ANALYSIS NOTES AND ERRORS
************************
Level of confidence for all confidence intervals in output: 95,0000
Number of bootstrap samples for percentile bootstrap confidence intervals: 5000
W values in conditional tables are the mean and +/- SD from the mean. NOTE: The following variables were mean centered prior to analysis: PSmean HPWSgl
NOTE: Due to estimation problems, some bootstrap samples had to be replaced. The number of times this happened was:
10