M
ASTER
I
N
F
INANCE
M
ASTER
F
INAL
W
ORK
P
ROJECT
W
ORK
E
QUITY
R
ESEARCH
–
C
ORK
S
UPPLY
P
ORTUGAL
M
IGUEL
C
ARDOSO
F
ERREIRA
R
EIS
M
ASTER
I
N
F
INANCE
M
ASTER
F
INAL
W
ORK
P
ROJECT
W
ORK
E
QUITY
R
ESEARCH
–
C
ORK
S
UPPLY
P
ORTUGAL
M
IGUEL
C
ARDOSO
F
ERREIRA
R
EIS
S
UPERVISION OFM
ASTER’
ST
HESIS:
P
ROFESSORAI
NÊSP
INTOA
BSTRACTThe aim of this project is to determine the intrinsic value of Cork Supply Portugal shares at 31.12.2014, through a detailed analysis of the operational performance of the company, with its external environment and its growth perspectives. The company is a producer and a distributor of numerous TOB products for the wine industry around the world.
The reason why I decided to make this project was the challenge of valuing a Portuguese private company, which has no similar projects done before. The challenge started with the available information about the company when comparing with publicly firms.
The book value, which is the difference between the total assets and the total liabilities is equal to 5.742.330€.
The valuation will be based on some methods, which according to the literature review represents the best method to evaluate Cork Supply Portugal. Some assumptions will be defined during this project in order to make the firm value more realistic. In the final of the project, I was able to reach an equity value of the firm of 37.023.355€.
A
KNOWLEDGMENTSFirst, I would like to thank my supervisor Professora Inês Pinto for the attention, availability, support, critical opinion and continuous care throughout the overall process of realization of this project from the beginning until the final results.
Secondly, I also would like to thank to all CSP’s board members for the opportunity to do this project. Being a private company, without their consent would be very difficult to gather all the necessary information for the realization of this project.
I
NDEX Abstract ... iii Aknowledgments ... iv Index of Figures ... ix List of Abbreviations ... x 1. Introduction ... 1 1.1. Project Structure ... 1 2. Literature Review ... 2 2.1 Introduction ... 22.2 Discounted Cash Flow (DCF) ... 3
2.2.1 Equity Valuation Models... 3
2.2.2. Firm Valuation Models ... 5
2.2.3 APV Method ... 6
2.3 Relative Valuation ... 9
2.4 Contingent Claim Valuation ... 10
3. Company Presentation ... 11
3.1 Business Areas - Products & Services ... 12
3.3 Business Description ... 13
3.3.1 Cork ... 13
3.3.2. Wine... 16
3.4.1. Internationalization ... 17
3.4.2. Porter’s Five Forces ... 18
3.4.3. SWOT Analysis ... 19
3.5. Operational and Financial Performance ... 19
3.6. Macroeconomic Environment and Industry Sector ... 22
3.6.1. Macroeconomic Environment ... 22
3.6.2. Industry Sector ... 23
4. Valuation ... 26
4.1 Methodology ... 26
4.1.1. Sales Volume ... 26
4.1.2. Cost of goods sold (COGS) ... 28
4.1.3. FSE ... 28
4.1.4. personnel Costs ... 29
4.1.5. Working Capital ... 29
4.1.6. Investment in Capital Expenditures and Depreciations and Amortizations29 4.1.6. Weighted Average cost of capital (WACC) ... 30
4.1.7. Cost of Equity ... 30
4.1.8. Risk-Free Rate ... 30
4.1.9. Beta ... 30
4.1.11. Conclusion ... 32
4.1.12. Cost of Debt ... 32
4.1.13. Perpetual Growth Rate ... 32
5. Valuation Results ... 33 6. Relative Valuation ... 34 7. Sensitivity Analysis... 35 8. Conclusion ... 36 References ... 38 Appendixes ... 39
Appendix 1 – Total Sales by Country (2014) ... 39
Appendix 2 – Product’s weights on sales (2014) ... 39
Appendix 3 – Porter’s Five Forces ... 39
Appendix 4 – World Cork Exports 2014 (Source: APCOR) ... 43
Appendix 5 – World Cork Oak Forest (2014) (Source: APCOR) ... 43
Appendix 6 – Cork Production by Country 2014 (Source: APCOR) ... 44
Appendix 7 – World Cork Importers (2014) (Source: APCOR) ... 44
Appendix 8 – Weights of International Sales ... 45
Appendix 9 – Wine Consumption Evolution per country ... 45
Appendix 10 – Wine Production Evolution per country ... 45
Appendix 12 – FSE ... 46
Appendix 13 – Wage and Staff Costs (Sales per employee) ... 46
Appendix 14 – Working Capital ... 46
Appendix 15 – Adjusted Betas of Comparable Firms ... 47
Appendix 16 – Market Capitalization of Comparable Firms ... 47
Appendix 17 – Tax Rate of Comparable Firms ... 47
Appendix 18 – Unlevered Beta of Comparable Firms ... 47
Appendix 19 – D/E of Comparable Firms ... 48
Appendix 20 – Wine Market Breakdown ... 48
Appendix 20 – China Macroeconomic ... 50
Appendix 21 – France Macroeconomic... 50
Appendix 21 – Italy Macroeconomic ... 50
Appendix 28 – USA Macroeconomic ... 50
Appendix 29 – Income Statement (Historical and Forecast) ... 50
I
NDEX OFF
IGURESFigure 1 – Porter Five Forces ... 18
Figure 2 – SWOT Analysis ... 19
Figure 3 – Total Sales (millions €) ... 19
Figure 4 – Net Profit Margin (%) ... 20
Figure 5 – EBITDA Margin (%) ... 20
Figure 6 – Debt to Equity (%) ... 21
Figure 7 – Financial Autonomy (%) ... 21
Figure 8 – Finance Costs/Sales (%) ... 22
Figure 9 – National Market Sales ... 27
Figure 10 – Weighted Average Growth Rate ... 27
Figure 11 – Weighted Average Growth Rate (china) ... 28
Figure 12 – Gross Margin ... 28
Figure 13 – WACC Computations ... 30
Figure 14 – Enterprise Value (with china) ... 33
Figure 15 – Enterprise Value (without china) ... 33
Figure 16 – Relative Valuation ... 35
L
IST OFA
BBREVIATIONS APV – Adjusted Present ValueAPCOR – Associação Portuguesa Cortiça BC – Bankruptcy Costs
CAPM – Capital Asset Pricing Model CSP – Cork Supply Portugal
D – Debt
DCF – Discounted Cash-Flow DDM – Dividend Discount Model E – Equity
EBIT – Earnings Before Interest and Taxes
EBITDA – Earnings Before Interest, Taxes, Depreciations and Amortizations EVA – Economic Value Added
FCFE – Free Cash-Flow to Equity FCFF – Free Cash-Flow to Firm GDP – Gross Domestic Product GM – Gross Margin
IMF – International Monetary Fund R&D – Research and Development
SWOT – Strengths, Weaknesses, Opportunities and Threats T – Tax rate
TOB – Top-of-the-bottle
WACC – Weighted Average Cost of Capital Yoy – Year over year
Miguel Cardoso Ferreira Reis Page | 1
1.
I
NTRODUCTIONThe aim of this project is to value a Portuguese private company, Cork Supply Portugal. This valuation will be made by an independent point of view and the study’s main goal is to achieve the intrinsic value of the company, through a complete analysis of the group operational performance and of its external environment.
I have chosen to value Cork Supply Portugal in order to value a private company that has no similar projects done before. Concerning the industry’s choice, cork it is one of the Portuguese most important natural resources, which motivated me to increase my knowledge about it. Cork Supply Portugal is now facing the step up in the Chinese market and this project will be very interesting to understand what can be the impact of this huge market in CSP’s value.
Based on the literature review, the model which represents the method to assess CSP is the Free Cash Flow to Firm. According to the assumptions defined and the analysis performed, the equity value of Cork Supply Portugal at 31.12.2014 is 34.478.660,26 €.
1.1. PROJECT STRUCTURE
In the next section, we present the literature review, where we explain the valuation methods, taking into account the different opinions of different publications that have already been made about each method and also the advantages and disadvantages of each one in order to understand which method is the most adequate to evaluate Cork Supply Portugal.
In the second section, we do a detailed analysis of the company in the last years, trying to understand which were the business and market segments, its operational and financial performance as well as its strategies.
Miguel Cardoso Ferreira Reis Page | 2 In the third section, we give more attention to the macroeconomic analysis for the major countries where Cork Supply Portugal operates and the industry sector for each business segment of the company.
In the fourth section, we conclude Cork Supply Portugal’s valuation, taking into account the major assumptions and which method will be applied.
In the last three sections, we present the results from the valuation process as well as the relative valuation and the sensitivity analysis.
In the eighty section, we present both results and conclusions of the overall project.
2.
L
ITERATURER
EVIEW2.1 INTRODUCTION
Valuation plays an important role in many areas of finance – in corporate finance, mergers and acquisitions and portfolio management (Damodaran, 2002). In portfolio management, valuation plays a crucial role for an active investor even if the nature and the role of valuation is different for different types of active investment. Valuation also plays a relevant part of corporate finance. According to Damodaran (2002), the corporate finance main goal is the maximization of firm’s value and for that reason we need to take into account the strategy of the firm likewise the other financial decisions since they have impact in the valuation and therefore, in the firm’s value. Concerning Luehrman (1997), valuation it is an important skill that all managers should have. “Today valuation is the financial analytical skill that general managers want to learn and master more than any other.”
We should pay a special attention to the specific case of private firm’s valuation: the valuation should be done exactly in the same way for both publicly and for private firms
Miguel Cardoso Ferreira Reis Page | 3 but there are some estimation problems for private firms since the information offered for the valuation is more limited. (Damodaran, 2002)
2.2 DISCOUNTED CASH FLOW (DCF)
Following Brealey & Meyers (2003), the purpose of DCF is to estimate market value, i.e., to estimate what investors would pay for a stock or business. According to Fernández (2001), the company is viewed as a cash flow generator and the company’s value is obtained by calculating these cash flows’ present value using a suitable discount rate. The discount rate which should be applied to the present value rule must be a function of the riskiness of the estimated cash flows. (Damodaran, 2002) There are several discount cash flow methodologies.
In this section, I will only refer the following models: Equity Valuation Models; Firm Valuation Models and Adjusted Present Value.
2.2.1 EQUITY VALUATION MODELS
According to Matthias Meitner (2006), equity valuation is concluded valuing the part of the company that belongs only to shareholders. This is done through the discounting of the cash flows of these investors, using the cost of equity, i.e., the rate of return required by equity investors in the firm. This approach will lead us to the value of the equity stake in the business.
The main models of this method are: Dividend Discount Model and Free Cash Flow to Equity.
Miguel Cardoso Ferreira Reis Page | 4
2.2.1.1DIVIDEND DISCOUNT MODEL (DDM)
According with Brealey & Meyers (2003), DDM requires a forecast of dividends which has limitations for stocks with potentially infinite lives. If we are expecting to hold the stocks for the whole life, we will spend a lifetime forecasting dividends. To simplify that, we must take some assumptions in order to reduce the number of parameters to estimate.
Berk and DeMarzo (2007) refer that the DDM has some limitations: firstly, an amount of uncertainty is associated with any forecast of a firm’s future dividends. Secondly, it is difficult to know which estimate of the dividend growth rate is more accurate since forecasting dividends requires forecasting the firm’s earnings, dividend payout rate and sometimes this decision are at management’s discretion. In accordance with Damodaran (2002) there are three different versions of the DDM. The first one is Gordon Growth Model. This model relates the value of a stock to its expected dividends in the next time period (DPS1), the cost of equity (Ke) and the expected growth of dividends
(g).
𝑽𝒂𝒍𝒖𝒆 𝒐𝒇 𝑺𝒕𝒐𝒄𝒌 = 𝑫𝑷𝑺𝟏
𝒌𝒆−𝒈 (1)
The main disadvantage of this model it is the extremely sensitive of the inputs for the growth rate. We only present Gordon Growth Model in this section because it is the most usable of the three different versions of the DDM.
2.2.1.2FREE CASH FLOW TO EQUITY (FCFE)
Damodaran (2002) also concludes that FCFE represents a smoothed out measure of what companies can return to their stockholders over time in the form of dividends and stock buybacks. It is computed by subtracting from the FCFF the interest and principal
Miguel Cardoso Ferreira Reis Page | 5 payments (after tax) made in each period to the debt holders and subsequently adding the new debt provided (Fernández , 2007).
𝑭𝑪𝑭𝑬 = 𝑭𝑪𝑭𝑭 − [𝒊𝒏𝒕𝒆𝒓𝒆𝒔𝒕𝒑𝒂𝒚𝒎𝒆𝒏𝒕𝒔 ∗ (𝟏 − 𝒕)] − 𝒑𝒓𝒊𝒏𝒄𝒊𝒑𝒂𝒍𝒓𝒆𝒑𝒂𝒚𝒎𝒆𝒏𝒕𝒔 + 𝒏𝒆𝒘𝒅𝒆𝒃𝒕 (2)
According to Damodaran (2002), the value of the equity is obtained by discounting expected cash flows to equity at the cost of equity.
𝑽𝒂𝒍𝒖𝒆 𝒐𝒇 𝑬𝒒𝒖𝒊𝒕𝒚 = ∑ 𝑪𝑭 𝒕𝒐 𝑬𝒒𝒖𝒊𝒕𝒚𝒕
(𝟏+𝒌𝒆)𝒕 𝒕=𝒏
𝒕=𝟏
2.2.2.FIRM VALUATION MODELS
These valuation models were created in order to value the whole company and not only the equity part. The cumulated cash flows will be discounted by the weighted average cost of capital (WACC) or by adding the marginal impact of debt on value to the unlevered firm value. (Damodaran, 2002).
The main models of this method are: Free Cash Flow to Firm (FCFF) and Economic Value Added (EVA).
2.2.2.1FREE CASH FLOW TO FIRM (FCFF)
To measure the FCFF, we should add up the cash flows to all the claim holders, which would include cash flows to equity, cash flows to lenders (which would include principal payments, interest expenses and new debt issues) and cash flows to preferred stockholders (Damodaran, 2002).
𝑭𝑪𝑭𝑭 = 𝑨𝒇𝒕𝒆𝒓 𝑻𝒂𝒙 𝑶𝒑𝒆𝒓𝒂𝒕𝒊𝒏𝒈 𝑰𝒏𝒄𝒐𝒎𝒆 − (𝑪𝒂𝒑. 𝑬𝒙𝒑𝒆𝒏𝒅𝒊𝒕𝒖𝒓𝒆𝒔 − 𝑫𝒆𝒑𝒓𝒆𝒄𝒊𝒂𝒕𝒊𝒐𝒏) − 𝑪𝒉𝒂𝒏𝒈𝒆 𝒊𝒏 𝒏𝒐𝒏 𝒄𝒂𝒔𝒉 𝑾𝒐𝒓𝒌𝒊𝒏𝒈 𝑪𝒂𝒑𝒊𝒕𝒂𝒍
The discount rate should be the firm’s cost of capital, combining both required return by debt and equity holders.
Miguel Cardoso Ferreira Reis Page | 6
𝑽𝒂𝒍𝒖𝒆 𝒐𝒇 𝑭𝒊𝒓𝒎 = ∑ 𝑭𝑪𝑭𝑭𝒕
(𝟏 + 𝑾𝑨𝑪𝑪)𝒕
𝒕=∞
𝒕=𝟏
According to Fernández (2007) WACC is computed by weighting the cost of debt (Kd) and the cost of equity (Ke) according to the company’s financial structure:
𝑾𝑨𝑪𝑪 =𝑬 ∗ 𝑲𝒆+ 𝑫 ∗ 𝑲𝒅(𝟏 − 𝒕)
𝑬 + 𝑫
This model is more suitable for firms with simplest and static capital structures. The more complicated company’s capital structure, the more likely it is that mistakes will be made.
2.2.2.2.ECONOMIC VALUE ADDED (EVA)
The economic value added is a measure of the surplus value created by an investment or a portfolio of investments.
According to Brealey & Meyers (2003), “EVA may also highlight parts of the business that are not performing up to scratch. If a division is failing to earn a positive EVA, its management is likely to face some pointed questions about whether the division’s assets could be better employed elsewhere.”
2.2.3 APV METHOD
Damodaran (2002) describes APV method in three steps. First, we begin with the value of the firm without debt (all-equity financed) and then we consider the present value of the interest tax savings generated by borrowing a given amount of money. The last step will consist on the evaluation of the effect of borrowing the amount on the probability that the firm will go bankrupt, and the cost of bankruptcy.
To value the firm as if it had no debt, it must be done through discounting the expected FCFF at the unlevered cost of equity.
Miguel Cardoso Ferreira Reis Page | 7
𝑽𝒂𝒍𝒖𝒆 𝒐𝒇 𝑼𝒏𝒍𝒆𝒗𝒆𝒓𝒆𝒅 𝑭𝒊𝒓𝒎 =𝑭𝑪𝑭𝑭𝟎(𝟏 + 𝒈)
𝒌𝒖− 𝒈
Where, ku is the unlevered cost of equity and g is a constant growth rate in perpetuity.
In order to consider the present value of the interest tax shield generated by borrowing a given amount of money, we should take into account that this tax benefit is a function of the corporate tax rate of the firm (Tc) and is discounted at the cost of debt (D) to
reflect the riskiness of the cash flow.
𝑽𝒂𝒍𝒖𝒆 𝒐𝒇 𝑻𝒂𝒙 𝑩𝒆𝒏𝒆𝒇𝒊𝒕𝒔 = 𝒕𝒄∗ 𝑫
The final step is to estimate the influence of a certain level of debt on the default risk of the firm and on expected bankruptcy costs. This requires the estimation of the probability of default (πc) with the additional debt and the direct and indirect cost of bankruptcy.
𝑷𝑽 𝒐𝒇 𝑬𝒙𝒑𝒆𝒄𝒕𝒆𝒅 𝑩𝒂𝒏𝒌𝒓𝒖𝒑𝒕𝒄𝒚 𝑪𝒐𝒔𝒕
= (𝑷𝒓𝒐𝒃𝒂𝒃𝒊𝒍𝒊𝒕𝒚 𝒐𝒇 𝑩𝒂𝒏𝒌𝒓𝒖𝒑𝒕𝒄𝒚) ∗ (𝑷𝒓𝒐𝒃𝒂𝒃𝒊𝒍𝒊𝒕𝒚 𝒐𝒇 𝑩𝒂𝒏𝒌𝒓𝒖𝒑𝒕𝒄𝒚 𝒄𝒐𝒔𝒕)
= 𝝅𝒂𝑩𝑪
In this step we will face a problem since neither the probability of bankruptcy nor the bankruptcy cost can be estimated directly.
Some additional components of DCF:
In the specific case of private firms, the way we estimate the inputs to the discounted cash-flow model is different from the case of publicly firms.
Cost of Equity (Ke):
According to Damodaran (2002), the cost of equity it is equal to the expected return for equity investors that should include a premium for the equity risk in the investment.
Miguel Cardoso Ferreira Reis Page | 8 The most common and known model to estimate the cost of equity is CAPM (Capital Asset Pricing Model). It assumes that the opportunity cost of equity is equal to the return on risk-free securities (Rf) plus the company’s systematic
risk (β) multiplied by the market risk premium [E(Rm)-RF]. 𝑬(𝑹𝒊) = 𝒓𝒇+ 𝜷𝒊[𝑬(𝑹𝒎) − 𝒓𝒇]
Risk-Free Rate (Rf):
According to Copeland, Tom & Koller, Tim; Murrin (2000), the risk-free rate is the return on a security that has no default risk and is completely uncorrelated with returns on anything else in the economy. It can be estimated through the government bond rates with no default risk neither reinvestment risk.
Beta(β):
The beta of an investment is the risk that the investment adds to a market portfolio. The most common way to compute beta is by regressing returns on asset versus a stock index, with the slope of the regression (b) being the beta of the asset (Damodaran, 2002):
𝑹𝒋 = 𝒂 + 𝒃 ∗ 𝑹𝒎
Usually, the beta is estimated using historical stock prices but in the case of private firms this can be a more difficult. The absence of historical price information and the failure on the owners of the private firms to diversify his business can create many problems with estimating and also using betas for these firms (Damodaran, 2002).
Cost of Debt (Kd):
In accordance with Damodaran (2002) the cost of debt is the market rate at which the firm can borrow, adjusted for any tax advantages of borrowing. The
Miguel Cardoso Ferreira Reis Page | 9 cost of debt is dependent of the firm’s default risk. The risk is measured through the yields on bonds issued by the firms or the ratings for these bonds to get default spreads, in the case of publicly firms. But in the case of private firms, they are not rated and do not have bonds outstanding. One possible approach to get the cost of debt is assuming the interest rate on the borrowing, only if the private firm has borrowed money recently.
Risk Premium [E(Rm)-Rf]:
Brealey et al. (2001) states that the risk premium is the “expected return in excess of risk-free return as compensation for risk.” This premium is equal to the risk that investors have for investing in risky assets in the market as a substitute of investing in a riskless asset.
2.3 RELATIVE VALUATION
The objective in relative valuation is to value assets based upon how similar assets are currently priced in the market. In order to make in practice this valuation method, first we need to find a group of comparable firms. A comparable firm is the one with cash flows, growth potential and similar risk to the firm that is being valued but it is not easy to find similar firms because there are no two identical firms and sometimes two firms even in the same business can differ on risk, growth potential and also in cash flows (Damodaran, 2002). According to Koller et al. (2005), “Finding the right companies for the comparable set is challenging.”
Secondly, values should be standardized. In order to compare the values of comparable firms in the market, values can be standardized relative to the earnings firms generate, to the book value or replacement value of the firms themselves. (Damodaran, 2002). In
Miguel Cardoso Ferreira Reis Page | 10 accordance with Fernández (2001), we can divide the most common used multiples in three different groups:
Multiples based on the company’s value (Equity and Debt value)
Multiples based on the company’s capitalization (Equity value)
Growth-referenced multiples
1. Enterprise Value to EBITDA (EV/EBITDA)
2. Enterprise Value to Sales (EV/Sales)
1. Price Earnings Ratio 2. Price to Book Value 3. Price to Sales
1. Price Earnings to Growth 2. Enterprise Value to EBITDA
growth
Lie & Lie (2002) had reached a conclusion: “There is no consensus as to which multiple performs best.”
2.4 CONTINGENT CLAIM VALUATION
The principle behind this assessment is that the value of the company may eventually exceed the value designated by DCF models. This valuation method proposes to estimate the company's value using option pricing models, such as the Black Scholes model and Binomial model. In particular, using these models in an evaluation process helps to determine in advance the value of a set of opportunities that the company is likely to develop in a future like an expansion of a business unit or creating new products, abandonment of a project, and use of patents, among others (Luehrman, 1997)(Damodaran, 2002).
Copeland (2000) argue that this method is a more complete version of the DCF as it enables managers have flexibility to alter their strategies; however Luehrman (1997) states that the dependence of this method to a large number of variables makes is formally impractical.
Miguel Cardoso Ferreira Reis Page | 11
3.
C
OMPANYP
RESENTATIONCork Supply was founded in 1981 by Jochen Michalski in Northern California. The main purpose of the company is to supply the best wine producers with high quality stoppers. Currently, Cork Supply Portugal operates in many countries, such as Argentina, Australia, Canada, France, Ireland, Italy, South Africa, Spain and the United States. More than three decades since the foundation of the company, Cork Supply Portugal is now part of a highly competitive market (with Portugal being the largest cork producer in the world), where product quality is a critical success factor. Initially, the company started its business as a distributor of natural cork TOB (top-of-bottle) products. At that time, the company imported ready-made cork TOB products from Portugal and then distributed them to the USA market. However, in 1995 the company started to produce the TOB product by itself, in Portugal, by buying “fardos” that had already received some treatment so then they only had to produce the final product.
In 2000, CSP started the “vertical integration” process1, where they built their own line
of production. Through this process, CSP was able to control the quality and development of the overall process of production, guaranteeing customer’s maximum product quality. Now the company is actually a producer and a distributor of numerous TOB products for the wine industry around the world.
The group’s headquarters are located in Luxembourg. The factories of cork’ preparation is located in Portugal, as well as the factories of manufacturing and finishes of cork stoppers (for Europe). All the other factories are independent of the Portuguese factory.
Miguel Cardoso Ferreira Reis Page | 12 Some factories are located in USA, Australia, South Africa and Argentina in order to finish the cork stoppers.
The company has a vast client base of approximately 2000 clients spread all over the world. CSP’s clients are located in USA, Spain, France, Italy, Germany, Argentina, Australia and South Africa. Some of these countries are final consumers but others, like USA, South Africa, Australia, and Argentina are retailers. CSP’s has a high dependence on the USA’s market since it represents 40% of the sales in 2014. Sales breakdown by country in 2014 is presented in Appendix 1.
3.1 BUSINESS AREAS - PRODUCTS & SERVICES
The company’s core activity is focused on the production of cork stoppers for the wine industry. This is the only business unit of CSP. To satisfy all the different client requirements, the company offers this set of products: natural corks, technical corks, sparkling wine closures and natural cork bar tops2. The product’s weights on total sales
volumes can be presented in Appendix 2. However, client requirements vary a lot, depending on: type of wine (sparkling or natural), time of duration, budget, quality of closure, brand positioning, technical performance, etc. Over time, some substitute, yet competitive products have been launched in this market in order to compete with the traditional cork products.3 CSP only produces cork related products; all other products
being sold in partnership with the most recognized brands in the world. In these partnerships, CSP acts like an intermediary since they buy the product from its partners and then sell on with a margin. Through these partnerships, CSP is able to expand the
2 Source: www.corksupply.com/products
Miguel Cardoso Ferreira Reis Page | 13 range of products and sell some substitute products (screw caps, synthetic closures, wine capsules) to cork stoppers, without incurring in the producing costs.
3.3 BUSINESS DESCRIPTION
In this topic, we will analyze two different markets that are very important for the success of this business.
3.3.1CORK
Cork is a product native to Portugal, for which it is known world-wide. Portugal has always been associated to this activity and has, in recent decades, become the world's largest producer and exporter of cork. Cork is also a natural, renewable and sustainable product4. The unique physical and chemical characteristics of natural cork make it an
ideal stopper. The permeability of cork makes an effective barrier against liquids and gases, while being ideal for the oxygenation essential for the maturing of wine. It also acts as protection against external unwanted flavors in the wine. As stated previously the success of a business like the one under study depends on one critical factor: the quality of the cork. This latter depends on terrain conditions, such as soil permeability and humidity and, most importantly of all, the weather. The Portuguese Montado (cork-oak plantation) is generally owned by Portuguese families that, after cork extraction, sell it to cork producing companies. As part as its business strategy, CSP buys around 50% of its cork as a semi-produced TOB in order to reduce stock costs.
The company tries to have strong and trusting relationships with its suppliers given that the company does not have total control of the growth of the raw material in its natural state, yet it must ensure the quality of the product before it is entered into the
Miguel Cardoso Ferreira Reis Page | 14 company’s final inventory. In the wine industry, there is an increasing interest in the quality of the cork products5. For both producers and consumers of wine, the main
problem is how to remove the unwanted sensory aspects that cork stoppers transfer to the wine. Knowing that, the company is investing in its product’s quality. In this business, there are some risks that are associated with the core business of the company. As we know, CSP business is related with the cork stoppers and is constantly threatened by the quality product, being the TCA one of the major risks. It is expected that the company that will solve this problem by creating technology that stop this undesirable characteristic is the one that will rapidly increase his market share. The other risk that cork stopper’s companies are facing is the loss of cork’s quality due to some reasons being the biggest one the climate change. This can result in an exponential increase of cork’s price.
3.3.1.1. VERTICAL INTEGRATION
The process of vertical integration is an essential part of the overall process management for many reasons. For the business to truly become a standard to aim for as regards the cork transformation process a new strategy was needed and so vertical integration of the whole cork processing was implemented. The company has the overall control through its affiliates in all the cork-oak plantations of the processing of its products, from cork extraction, to the treatment it should undergo before starting manufacture and to the final TOB product. In this way, the company assures its customers the quality of its products, being able to stop the process whenever they want and at any stage of development for whatever reason. This is also done to avoid any
5 Source:
Miguel Cardoso Ferreira Reis Page | 15 flaws in their products that could affect the quality of the final product and, consequently, sales or the reputation of the company.
To sum up, while the company could not possibly have absolute control over production, it does have and input at every stage of the process. This process affects the financial/net profit aspects of the business quite strongly, since it implies more costs. It is difficult to see if this process has had a positive impact on sales because it is not possible have access to the company’s results prior to 2010.
3.3.1.2.ASSET CONVERSION CYCLE
During this project I was in contact with some members of the company and they drew my attention to the following fact: the company has a very long cash-cycle. From the company extracting the cork until it receiving its customers’ payments takes up to 16 months.
In CSP’s case, the total economic cycle (in other words, the time from which the company purchases the material (cork), until it is ready to be produced) is 150 days, or 5 months. During this period, there are some risks concerning its stocks’ quality, which can decrease its overall value, if not accurately managed. It is important to note that 5 days after the cork is prepared to be produced, it can be sold at any moment. Thus, the cash cycle is measured in terms of the time the company takes to pay its suppliers (120 days), and the time it takes for its own clients to pay the company (90 days). It is important to note that the company pays its suppliers before the beginning of the production process, which means the two cycles, cash and economic, are interpolated. Overall, the two cycles together form the operational cycle, which is 245 days.
Miguel Cardoso Ferreira Reis Page | 16 3.3.2.WINE
The cork stopper is a product that relies directly on wine production, depending on fluctuation of world production of bottled wine.6 Portugal has been improving in the
production and management of its winery houses. However this market only represents about 5% of CSP’s sales. Historically, the most important driving forces behind wine consumption have been GDP evolution and consumer purchasing power. A recent study done by OIV (Organização Internacional do Vinho)7 showed that world wine production
decreased by 6% in 2014. Last year, Portugal’s wine production decreased by 10%, with the European Union’s average production also decreasing (for example, Italy's production decreased by 15% and Spain's by 18%). Despite the decrease in production, wine exports have doubled over the past twenty years.8 World wine consumption has
been slowing down over recent years with a negative growth rate of 3%9 between 2008
and 2012, having reached its lowest level in the last 40 years.10 However, this reduction
in consumption can be explained by the financial crisis the world is facing, which has had negative consequences on basically every industry because of the consumer purchasing power effect. On the other hand, “new” world countries are increasing their wine consumption, with the USA being the world’s biggest wine consumer11, with an average
of 12 liters per person12 per year. The wine industry forecasts a positive growth rate of
5% between 2013 and 2017. “New” wine countries, like China, explain these statistics, i.e., countries other than the traditional wine consumers. In 2014, 39% of the world wine
6 Source: http://apcor.pt/artigo/consumo-de-vinho-potencia-a-cortica.htm 7 Source: http://www.bkwine.com/features/more/state-world-wine-production-grape-growing-2014-france-back/ 8 Source: http://finance.yahoo.com/news/united-states-overtakes-france-worlds-141343608.html?soc_src=mail&soc_trk=ma 9 Source: http://blogs.reuters.com/counterparties/files/2013/10/Global-Wine-Shortage.pdf
10 Source: Morgan Stanley Wine Research:
http://blogs.reuters.com/counterparties/files/2013/10/Global-Wine-Shortage.pdf
11 Source: http://www.cnbc.com/id/101339366
Miguel Cardoso Ferreira Reis Page | 17 consumption comes from outside Europe (31% in 2000). However, more than 60% of all produced wine is still being consumed in Europe. The global trade regarding wine exportation is worth more than 25 billion euros, a rise of more than 100% since 2000.
For further detailed information about the wine production/consumption evolution in the countries where CSP operates see Appendix 20.
3.4. STRATEGY
In the last few years, there has been a group of substitute products (synthetic, screw tops, plastic) that have been growing in terms of the market share and they are now “fighting” for a bigger share with TOB products. The CSP top executives therefore implemented a new strategy that allowed the company to have a diversification process: now they can offer more products to their current customer base (they can buy more types of TOB products since they have different types of wines – Cross Selling) and can also attract new ones.
CSP goals for the next years are13: 1. Investment in R&D in order to get the “perfect
TOB”, trying to solve the TCA problem; 2. Implementation of the Lean Production Philosophy, based on the principles of increase the production as well as decreasing inventory; 3. Implementation of the Sales Inventory and Operations Planning (SIOP), trying to reduce the stock keeping units and also the slow movers.
3.4.1.INTERNATIONALIZATION
CSP is already operating in more than 10 different countries and this allows the company to have sustainable growth as well as allowing the company to diversify and to mitigate some of the risks associated with regional macroeconomic conditions.
Miguel Cardoso Ferreira Reis Page | 18 Now the company has to step up its internationalization process towards markets that have strong growth potential and they have identified China as the biggest potential market in the world. This year, 2015, the company will step into the Chinese market, which if successful, will boost CSP’s sales. Despite being the country with the lowest wine consumption per capita in the world, this trend is about to change. This huge country is getting closer to Western tendencies, due to its rapid economic advancement and a growing educated, urban population.
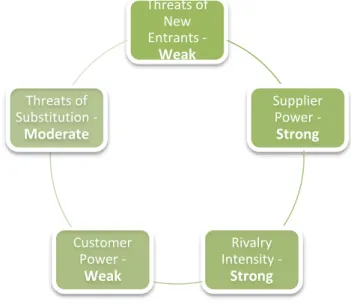
3.4.2.PORTER’S FIVE FORCES
In this section the external environment of Cork Supply Portugal will be analyzed. We will discuss the characteristics of the market they operate in, the competitors, their strategic moves and the main driving forces of the industry. According to Michael Porter (2008), this model is very important, since "the structure of the sector, manifested in their competitive strengths, defines the profitability of the sector for the medium and long term."
For further information about the Porter’s Five Forces, see Appendix 3
FIGURE 1 – PORTER FIVE FORCES
Threats of New Entrants -Weak Supplier Power -Strong Rivalry Intensity -Strong Customer Power -Weak Threats of Substitution -Moderate
Miguel Cardoso Ferreira Reis Page | 19 3.4.3.SWOTANALYSIS
Strengths
Innocork (unique in the world) – R&D Partnerships with famous brands Geographically varied business Accurate distribution Network Expert work-force
Durable customer relationships
Weaknesses
Dependence on cork tree producers Huge exportations dependence High operational costs
High raw material costs Small activities and business portfolio
Exchange rates fluctuation
Opportunities
Chinese Market
“New world” wine markets New product’s development New strategic partnership’s agreements
Foreign direct investment’s attraction
Threats
TCA related problems Substitute products Cork’s volatile price External business risks Global economy risk
Wine’s consumption decrease Financial capacity
FIGURE 2 – SWOT ANALYSIS
3.5. OPERATIONAL AND FINANCIAL PERFORMANCE
Historical CSP’s sales (Fig.1) have been rising during the last few years. In 2010 the company's total sales together with services provision was worth approximately 27 million euros, while in 2014, this has increased to 40 million euros, an average annual growth of 9%, over the last five years. Last year, the company registered a global sales increase of 15%, the driving force behind this being sales in Europe, with a 28% increase
€-€10.000.000 €20.000.000 €30.000.000 €40.000.000 €50.000.000 2010 2011 2012 2013 2014
Total Sales (millions €)
Portugal International FIGURE 3 – TOTAL SALES (MILLIONS €)
Miguel Cardoso Ferreira Reis Page | 20 in sales. In the European market, it is important to highlight the German, Portuguese, Italian and Spanish markets as being largely responsible for this increase.
The cost of raw materials and products sold is huge in this industry. The best way to evaluate any company’s ability to transform each dollar earned into profits is called Net Profit Margin. CSP’s net profit margin was 1.78% in 2014, which means that only 1.78% of its revenue (41.727.806 million euros) were actually converted into profits (741.326€). (Fig.2)
EBITDA margin has been increasing in the last years, from 5.79% in 2012, to 6.56% in 2014. The company had, in 2014, a total CMVMC of 65% of its total sales value, which contributes to the EBITDA margin of 6.56%. The company adopted the Lean Management philosophy in 2014, which aims to increase CSP’s operational efficiency. It
4,95% 5,85% 5,79% 6,20% 6,56% 0,00% 2,00% 4,00% 6,00% 2010 2011 2012 2013 2014
EBITDA Margin (%)
0,25% 0,78% 0,43% 1,58% 1,78% 0,00% 0,50% 1,00% 1,50% 2,00% 2010 2011 2012 2013 2014Net Profit Margin (%)
FIGURE 4 – NET PROFIT MARGIN (%)
Miguel Cardoso Ferreira Reis Page | 21 is, together with CSP’s sales increase, the explanation for the 21.35% increase in its EBITDA. (Fig. 3)
Other relevant costs to highlight are the cost of the external services provided (19% of sales in 2014), as well as the one related to its staff (10% of sales in 2014). As far as its financing sources are concerned, the company decides to finance its assets mainly through external sources (84%); the most relevant ones being suppliers (41%), and financial loans (52%). Its Debt to Equity ratio is 520%. In 2015, the predictions are optimistic, based on orders that have already been made, as well as orders under negotiation. The company expects to grow, especially in the European market, where the company has the majority of its business. (Spain, Italy, France) (Fig. 4)
512,10% 468,44% 465,98% 465,40% 520,20% 300,00% 350,00% 400,00% 450,00% 500,00% 550,00% 2010 2011 2012 2013 2014
Debt to Equity (%)
16,34% 17,61% 17,67% 17,73% 16,13% 15,00% 16,00% 17,00% 18,00% 2010 2011 2012 2013 2014Financial Autonomy (%)
FIGURE 6 – DEBT TO EQUITY (%)
Miguel Cardoso Ferreira Reis Page | 22 The financial autonomy results from a ratio between the Equity divided by the Assets. By the graph we can see that in 2010 this value was 16.34%. However, mainly due to the financial crisis, in the following years this value increased to values around 17.65%. In 2014, the ratio value decreased to 16.13%. (Fig. 5)
By analyzing the figure, we can see an increase in the financing costs supported by the company. This is mostly due to the financial crisis that we lived, mainly in Euro Zone. The strong pressure made by the central banks forced the banks to increase the risk assessment and consequently the spreads of the financings, increasing financing costs of the companies. Nevertheless, in 2014 financing costs supported by CSP are lower than the value of 2013. (Fig. 6)
3.6. MACROECONOMIC ENVIRONMENT AND INDUSTRY SECTOR
3.6.1.MACROECONOMIC ENVIRONMENT
This section will look at the 2015 macroeconomic scenario, and its outlook for the next 5 years, not only in Portugal, but also in Cork Supply Portugal’s main markets. The indicators analyzed are the most important national indicators such as: Gross Domestic Product (GDP), inflation rate (price evolution trends), Trade Balance (imports vs. exports) and the implied purchasing power.
3,63% 3,16% 2,64% 0,00% 1,00% 2,00% 3,00% 4,00% 2012 2013 2014
Finance Costs/Sales (%)
Miguel Cardoso Ferreira Reis Page | 23 These are, in their majority, taken from the International Monetary Fund’s statistical data sources.
3.6.2.INDUSTRY SECTOR
3.6.2.1. CORK
Portugal produces 49.6% of the all cork in the world, as well as being the world's largest exporter with a market share of 64.7%. (Appendix 4) Portugal has the largest cork-oak forest area in the world (33, 78%), followed by Spain (27,10%), Morocco (18,08%) and Algeria (10,85%). (Appendix 5) Based on an INE (Instituto Nacional de Estatística) study in 2013, the business is getting closer to its pre-crisis values, generating about 834 million Euros per year in Portugal, a 1,5% increase when compared to 2012. Portugal only uses about 10% of the cork it produces, with the remaining 90% all being used for foreign consumption. In Portugal, more than 40 million cork stoppers are produced
France •1,64% average GDP growth rate •1,07% average inflation growth rate •3,98% average import's growth rate •0,812 average points of purchasing power Italy •0,97% average GDP growth rate •0,92% average inflation growth rate •3% average import’s growth rate •0,74 average points of purchasing power Spain •1,92% average GDP growth rate •0,79% average inflation growth rate •4,84% average import’s growth rate •0,653 average points of purchasing power Portugal •1,35% average GDP growth rate •1,41% average inflation growth rate •4,42% average import’s growth rate •0,61033 average points of purchasing power China •6,29% average GDP growth rate •2,2% average
inflation growth rate •6,47% average
import’s growth rate •3,5927 average points of purchasing power USA •2,55% average GDP growth rate •1,86% average
inflation growth rate •5,18% average
Miguel Cardoso Ferreira Reis Page | 24 every day and there are 10,000 people employed by the industry. Portugal is also one of the biggest importers (raw materials) in the world with a figure of 10%. Cork exportations represent 2% of total Portuguese exportations. Portugal is also the country that sells and exports more, representing 64% of the world's cork trade (Appendix 6). However, the quantity exported decreased by 9,5%, which represents a total of 19.3 thousand tons in absolute terms. When compared with other cork-producing countries, Portugal is also one of the biggest importers in the quantity of raw cork. (Appendix 7) It imported 136 million euros' worth in 2013. In 2014, the cork trade balance was positive by a total of 718.3 million euros, which clearly shows that cork exportations more than cover its imports (662%).14
3.6.2.2. TOP-OF-THE-BOTTLE
Within the cork business, stoppers (top-of-the-bottle) represent 70% (592.5 million €) of the market value. The market for this product, as explained earlier, is CSP’s core business, which is, in fact, directly related to the two markets analyzed previously in this study: cork and wine. Cork Supply Portugal only produces cork related products, through its facility in Espinho, in the north of Portugal. Over the last ten years, the global market share of natural cork producers has decreased from 95% to almost 70%. Ten years ago, the future of cork stoppers was threatened by substitute (plastic and aluminum) products that appeared in the TOB market. There was, at that time (2007) a huge concern about the survival of this business sector. However, this threat appears to have receded, with a recovery of almost 5% of the market share over the 2007-2012 period15.
14 Source: http://www.portugalglobal.pt/PT/PortugalNews/RevistaImprensaNacional/Comercio/Documents/Apcor_DE170315 .pdf 15 Source: http://www.corklink.com/index.php/cork-stoppers-continue-to-take-market-share-from-synthetic-alternatives/
Miguel Cardoso Ferreira Reis Page | 25 This recovery is largely due to two important factors: The first one is the evolution regarding the mechanical and chemical aspects of the cork stoppers, which were achieved due to the company’s huge investments in R&D, mostly to do with the TCA aspect. Secondly, there were the hugely successful marketing campaigns that associated in people's minds cork with high quality wine; a powerful brand image of high standards. Another very important aspect is related to environmental concerns. Cork stoppers are easily the most environmentally-friend product in the market of stoppers, especially when compared to its alternatives, and it is also the best contributor to the quality of a wine. Characteristics such as impermeability, flexibility, sealing capacity, and resilience make it the perfect TOB product. There have been several studies conducted in several countries, which confirm that globally, cork stoppers are the first choice within the TOB market16. According to a study carried out by A. C. Nielsen, 61% of the 100 top premium
wine brands use cork stoppers. Between 2010 and 2012, there was a 26% increase in sales in wines sealed with cork. On the other hand, wines sealed with non-cork stoppers had a 12% decrease in their total sales revenue.
CSP’s most important markets (USA, France, Italy and Spain) keep on faithful to cork stoppers, which secures this company’s growth and evolution in the next years.
Miguel Cardoso Ferreira Reis Page | 26
4.
V
ALUATION4.1 METHODOLOGY
The value of the CSP’s business will be determined by the FCFF method. This methodology besides being the most widely used by investors and managers in the process of companies’ valuation, is also the most appropriate to assess the CSP, since its financial structure is practically unchanged. The FCFF will be estimated for a time horizon of five years (2015-2020). Finally the adjusted FCFF will be discounted at the WACC rate, such as the financial structure will be constant within the timeframe and in perpetuity.
4.1.1.SALES VOLUME
We assumed that the company sells 4 different products. Based on CSP’s board members information, it was possible to calculate each product’s weights on the total volume of sales. The annual report breakdown sales by national and international. Based on that information provided, I was able to reach the assumption for the Portuguese market (5% of total sales) and also for the International market (95% of total sales). Also the price’s information was given by the CSP’s board members. Doing this, I was also able to reach product’s quantities sold. The company practices different prices for national and for international market, being the price for international market 10% more expensive.
To forecast the quantity’s growth rate, we assumed:
National Market: I took into account three main factors. The first one was the evolution of CSP’ sales in Portugal over the last three years. The second factor was the Portuguese wine production since 2011 until 2015. The third one is related with the Portuguese wine consumption over the same period of time. In order to estimate CSP’s quantity growth
Miguel Cardoso Ferreira Reis Page | 27 rate, I have to weight of each of these metric, accordingly to its importance, and calculate the weighted average.
International Market: I used the same factors as used previously but in a more complex way since we know that each country has a different weight over the CSP’s international sale’s volume (see Appendix 8). The total quantity growth rates (fig. 7) was the weighted average of the sales evolution of CSP’s in the countries where the company operates, the wine consumption (see Appendix 9) and production (see Appendix 10) in each country over the period between 2011 and 2015 and have into account the weights of each country in the CSP’s international sale’s volume. For example, Spain market represents 15% of the overall CSP’s international sale’s volume in 2014.
China: The company will start its business operations in June of 2015 in China, and that is the reason why we made all the computations aside the International market. We assumed 1 billion of people in China and a penetration rate of 3%, facing a 2% growth yoy. The quantity’s growth rate China was estimated through the wine production and consumption over the last 10 years. I did not take into account the sales evolution in the
FIGURE 9 – NATIONAL MARKET SALES
Miguel Cardoso Ferreira Reis Page | 28 last years since China is a new market and CSP has no historical sales in this market. For further information about the CSP’s sales evolution, see Appendix 11.
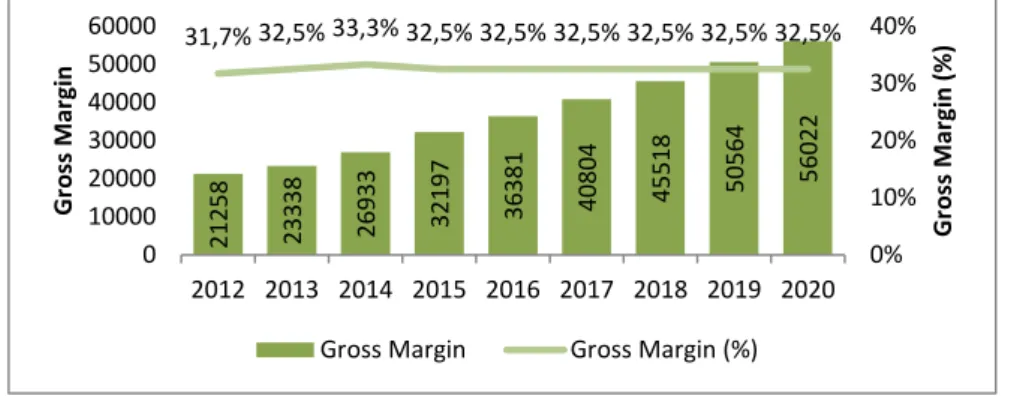
4.1.2.COST OF GOODS SOLD (COGS)
The COGS was reached by calculating a gross margin for each historical year. The projected margin was made taking into account CSP’s 2014 GM (32.46%), based on time accuracy and management information. The reason to make this calculation based on CSP’s sales is basically because the costs are, by definition, variable, growing according to the company’s sales evolution.
4.1.3.FSE
CSP’s FSE were divided into fixed and variable costs. The variable costs were projected based on its percentage of CSP’s total sales value. The weight of these costs was assumed to be equal to the last historical five years (see Appendix 12). The fixed costs were projected based only on the FMI forecasts about the Portuguese inflation rate over the next five years.
21258 23338 26933 32197 36381 40804 45518 50564 56022 31,7% 32,5% 33,3% 32,5% 32,5% 32,5% 32,5% 32,5% 32,5% 0% 10% 20% 30% 40% 0 10000 20000 30000 40000 50000 60000 2012 2013 2014 2015 2016 2017 2018 2019 2020 Gr o ss M ar gi n ( % ) Gr o ss M ar gi n
Gross Margin Gross Margin (%)
FIGURE 11 – WEIGHTED AVERAGE GROWTH RATE (CHINA)
Miguel Cardoso Ferreira Reis Page | 29 4.1.4. PERSONNEL COSTS
The historical number of employees is known. In order to estimate personnel future needs, I calculated the historical ratio (Total Sales/Total number of employees). This ratio was assumed to keep constant in the future years. Knowing the expected sales and also this ratio, I was able to calculate the number of employees needed to perform the expected sales. This metric was chosen because the company will obviously have to employ more people if its sales increase as predicted. (See Appendix 13)
4.1.5.WORKING CAPITAL
The working capital is the operating liquidity that the company can release to face its short-term obligations. It is divided in two groups: working capital necessities and working capital sources. For the historical years, it was calculated through the discrimination provided by the annual report and also by some information’s provided by the CSP’s board members. To estimate the WC for the following years, what we considered the average receivable/payable period and projects it in the same way as the company has been done until here. (Appendix 14)
4.1.6.INVESTMENT IN CAPITAL EXPENDITURES AND DEPRECIATIONS AND
AMORTIZATIONS
CSP’s annual report states the gross fixed assets and their gross amortizations. Knowing this, we estimate yearly depreciations, achieving each fixed asset’s implicit amortization rate per year. Each historical fixed asset’s investment amount per year was also estimated to be sure that projections were following the same rate. The first two projected years were reached based on CSP’s board’s member statement and the other following years were projected based on an average of last year’s percentage of each fixed asset’s investment over the total sales.
Miguel Cardoso Ferreira Reis Page | 30 4.1.6.WEIGHTED AVERAGE COST OF CAPITAL (WACC)
The WACC rate was estimated for the whole company since the company has only one business segment.
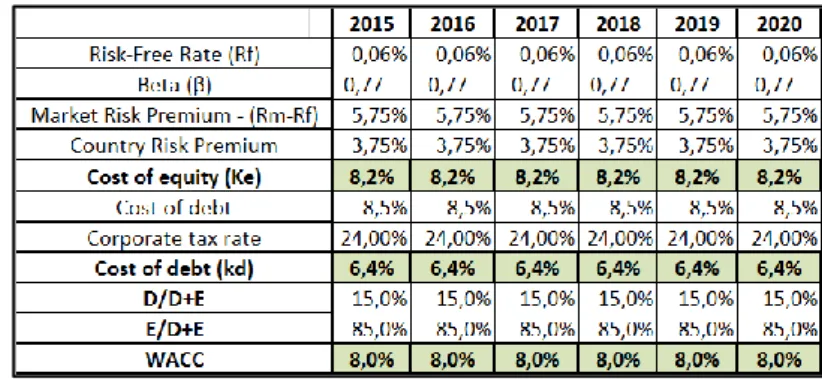
4.1.7.COST OF EQUITY
The cost of equity was computed through CAPM formula and using also the Country Risk Premium. (fig.10)
4.1.8.RISK-FREE RATE
The risk-free rate used to determine the cost of equity was the 5-years German Government Treasury Bond (0.06%17).
4.1.9.BETA
In order to estimate the Beta of the firm, I used the Comparable Method. With this method, I first need to collect a group of publicly firms, if possible in the same line of business but more in general, affected by the same economic drivers. The two comparable firms were achieved through Bloomberg. They are: Corticeira Amorim (COR PL) and Oeneo (SBT FP). First, the two adjusted betas were considered on 60 observations for each company, concerning these two companies’ last 5 years performance (monthly basis). (Appendix 15)
17 Source: Bloomberg (22/05/2015)
Miguel Cardoso Ferreira Reis Page | 31 The next step was to estimate the average value (2013, 2014 and current market value) of net debt and market capitalization of these two comparable firms. (Appendix 16) The equity amount was estimated by performing the same logic as net debt and market capitalization calculation. The three last year’s equity values were extracted from Bloomberg, as we can see in Appendix 21. The enterprise value was calculated by summing up market capitalization calculation, net debt and minority interest. To estimate the beta, I had to get the effective tax rate values for each one of the companies (Appendix 17).
β unlevered = β levered
(1 + (1 − 𝑡𝑎𝑥 𝑟𝑎𝑡𝑒) ∗ (𝐷𝐸))
The industry’s unlevered beta is the average of the unlevered betas of these two companies. (Appendix 18) Then, the optimal capital structure was calculated by estimating the average capital structure of these two comparable firms. (Appendix 19)
We assumed a Portuguese tax rate (IRC) of 21% to estimate the comparable firm’s levered Beta.
β 𝑝𝑟𝑖𝑣𝑎𝑡𝑒 𝑓𝑖𝑟𝑚 =
β 𝑢𝑛𝑙𝑒𝑣𝑒𝑟𝑒𝑑(1+(1−𝑡𝑎𝑥 𝑟𝑎𝑡𝑒 (𝐼𝑅𝐶))(𝑐𝑜𝑚𝑝𝑎𝑟𝑎𝑏𝑙𝑒 𝑓𝑖𝑟𝑚′𝑠 𝑎𝑣𝑒𝑟𝑎𝑔𝑒𝐷
𝐸))
Miguel Cardoso Ferreira Reis Page | 32 4.1.10.MARKET RISK PREMIUM
Concerning to market risk premium, it was taken from Damodaran’s website (5.75%). Since I considered the German Government Treasury Bond in order to be more accurate, I had to consider the Portuguese market’s risk premium of 3.75%, reaching an accurate 9.5% market risk premium.
4.1.11.CONCLUSION
Based on these inputs, CSP’s cost of equity (8.2%) was calculated and assumed for each of the forecasted periods. (Fig. 10)
4.1.12.COST OF DEBT
The cost of debt was achieved by considering last two year’s financial costs over total current and long term borrowings, reaching an average rate of 8.5%. Yet considering a Portuguese tax rate of 21%, accomplishment the 6.4% post-tax cost of debt
The considered CSP’s WACC is 8% for every forecasted year. (fig.10)
4.1.13.PERPETUAL GROWTH RATE
According to Steiger (2008), the choice of the growth rate in perpetuity is one of the most important and complex tasks in a DCF analysis process because slight changes in this rate will have a big impact on the final firm's value. The rate should be between 0% and 5%. Knowing this, and having into account the GDP18 perspectives for the next 5
years, it was assumed a perpetual growth rate of 1.351%.
Miguel Cardoso Ferreira Reis Page | 33
5.
V
ALUATIONR
ESULTSIn order to obtain the Cork Supply Portugal firm value, and as I told previously, I used the FCFF method. Doing this, with China included, I was able to reach an Equity Value of 37.023.355€.
FIGURE 14 – ENTERPRISE VALUE (WITH CHINA)
The Equity Value without China Market is equal to 24.466.047€.
FIGURE 15 – ENTERPRISE VALUE (WITHOUT CHINA)
FCFF WACC PV of FCFF 2015 6.144.687 € 8,0% 5.688.769 € 2016 535.850 € 8,0% 459.282 € 2017 1.065.453 € 8,0% 845.454 € 2018 1.176.932 € 8,0% 864.620 € 2019 1.256.699 € 8,0% 854.720 € 2020 1.277.236 € 8,0% 804.234 € Terminal Value 1.309.167 € Enterprise Value 24.466.047 € Enterprise Value
Miguel Cardoso Ferreira Reis Page | 34
6.
R
ELATIVEV
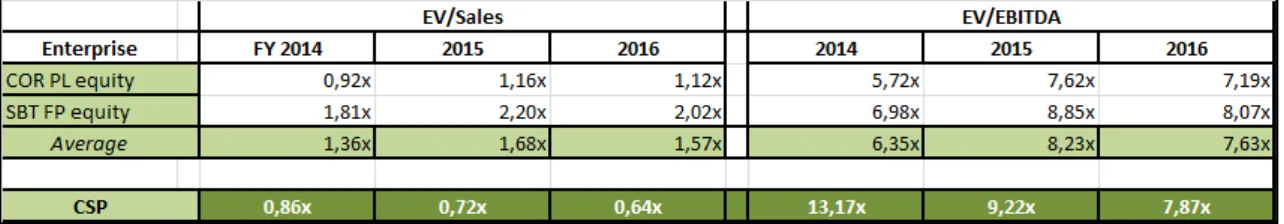
ALUATIONTo make in practice the relative valuation method, first we need to choose which multiples to use in the analysis. The multiples EV/Sales and EV/EBITDA are the models that were chosen mainly because these are the ones that allow the comparison with other companies operating in the same industry/sector. Secondly, we have to find companies with similar characteristics. This implies firms with similar growth potential and similar risk, and, in preference, operating in the same business. As comparable firms I choose Corticeira Amorim and Oeneo, through Bloomberg. The future information of the comparable companies is not known, and, knowing this, we choose to forecast it through the average of the three last historical years (2012, 2013, and 2014). The task of choosing the comparable companies was a complex challenge because there are no quoted companies acting in the same sector as CSP. Corticeira Amorim has much more business units than cork stoppers for wine producers like floor and wall coverings, composite and insulation cork. Oeneo is a company that is exposed not only to the wine market but also to the market of spirit drinks. Here, I can conclude that, despite of being three companies related with cork producing, they have completely different business dimensions and they also do not have the same business units. The implied risks associated with each one of these companies are much different. The level of uniqueness of each one of the companies can be seen in EBITDA margins. Even between the two comparable companies, EBITDA margins are very different. Despite of being aware of the limitations of this model, I wanted to perform and present the results for the multiple s EV/Sales and EV/EBITDA.
Miguel Cardoso Ferreira Reis Page | 35
FIGURE 16 – RELATIVE VALUATION
After performed the relative valuation, I can conclude that this will do not have impact on the valuation process because the results are not conclusive due to the facts presented above.
7.
S
ENSITIVITYA
NALYSISCSP’s value was estimated based on several assumptions which were define through some strategies for the company's future, many of them in an interview with the CFO of the company and others based on publicly available information. Once these variables impact CSP’s value, it is necessary to assess the impact of the main variables on CSP’s value. This assessment was made through sensitivity analysis performed to some of the most important variable in valuation exercise. The variables subject to sensitivity are: perpetuity growth rate; WACC rate; weight of variable FSE on the total sales; gross margin and penetration rate in China. The graph below shows the impact of a variation of: (i) -0.5p.p. and +0.5p.p. in perpetuity growth rate; (ii) -0.5p.p. and +0.5p.p. in WACC rate; (iii) -0.1p.p and +0.1p.p. in weight of variable FSE on the total sales; (iv) -1p.p. and +1p.p. in gross margin; (v) penetration rate in China of 1%, 3% or 5%. The variable that has more impact on CSP’s value is the Gross Margin since it can result in firm’s total value between 29M€ and 40M€.
Miguel Cardoso Ferreira Reis Page | 36
FIGURE 17 – SENSITIVITY ANALYSIS
8.
C
ONCLUSIONDuring the realization of this project, I understood that there is not an ideal valuation model to determine the value of a company. There is a group of models that can be chosen and, depending on the one that we choose, several assumptions have to be made along that assessment. I choose the FCFF model by thinking that this model is the most appropriate in this specific case. The relative valuation is also a complementary and useful element in the evaluation of companies and ensures greater reliability to the chosen model. CSP is a company that depends heavily on the export market, especially the market of the United States. About 95% of its total sales are international sales. One of the great opportunities that the company is now facing is to take advantage of the Chinese market. With this new market, it is expected that sales rise strongly because, in China, wine is now a drink that is fashionable and is also associated with certain status. The dimension of the Chinese market is known, representing a big opportunity for CSP. Its operating performance is mainly explained by the increase of the weight of its international activity, a constant search for markets which have more favorable conditions than Portugal and that support CSP growth.
30 29 30 32 32 39 40 39 38 37 20 25 30 35 40 45
Penetration Rate in China Gross Margin Weights of Variable FSE on total Sales WACC Growth Rate in Perpetuity
Miguel Cardoso Ferreira Reis Page | 37 Continuing to follow these internationalization and diversification strategies offering a customer a good quality / price ratio, it is expected that this company will continue to grow. Despite the company is having several opportunities for growth, the group also has important challenges ahead.
A major challenge the company faces is the resolution of the TCA problem. This is a threat that the major wine producers in the world are not willing to tolerate because the higher quality wines are associated with cork stoppers. Neither consumers nor producers of wine are willing to buy bottles of wine with TCA. The company that will are able to solve this problem, is the one that will mostly increase his market share. Nowadays, CSP is also facing a major threat in relation to substitute products. For example, screw cap has no problems with the TCA and also has some positive aspects such as the opening and closing the wine bottle the number of times that a person wants. It is expected that the company keep looking for new opportunity markets in order to face losses that are occurring in some markets due to the substitute products.
The results obtained during this valuation process of CSP and after performed the sensitivity analysis, we conclude that the Equity Value at 31.12.2014 is 37.023,355€. Considering the scenario without the China business, this value is 30% lower, presented a value of 24.466.047€.
Miguel Cardoso Ferreira Reis Page | 38
REFERENCES
Brealey, R. a, Myers, S. C., & Marcus, A. J. (2001). Fundamentals of Corporate Finance.
New York.
Brealey, R., & Meyers. (2003). Principles of Corporate Finance. Charron, F., & Tessier-lavigne, M. (2007). Hapter 9.
Copeland, Tom; Koller, Tim; Murrin, J. (2000). Valuation - Measuring and managing the
value of companies.
Damodaran. (2002). Investment Valuation : Second Edition.
Fernández, P. (2001). Company Valuation Methods. The Most Common Errors in Valuations. SSRN Electronic Journal, 3(449), 1–20. doi:10.2139/ssrn.274973 Fernández, P., & Fernández, P. (2007). A More Realistic Valuation: Adjusted Present
Value and WACC with Constant Book Leverage Ratio. Journal of Applied Finance,
3(715), 13–21.
Koller, T., Goedhart, M., & Wessels, D. (2005). The right Role for Multiples in Valuation.
McKinsey on Finance, 15, 7–11. Retrieved from
http://papers.ssrn.com/sol3/papers.cfm?abstract_id=805166
Luehrman, T. a. (1997). What ’ s It Worth ? A General Manager ’ s Guide to Valuation.
Harvard Business Review, 132–142.