DETERMINATION OF ORTHO- AND RETRONASAL
DETECTION AND RECOGNITION THRESHOLDS FOR
OFF-FLAVOURS IN WINE
Ana Sofia Martins Domingos
Dissertation to obtain the Master’s Degree in
Viticulture and Oenology Engineering
Advisor: Manuel José de Carvalho Pimenta Malfeito Ferreira
Jury:
President: Jorge Manuel Rodrigues Ricardo da Silva (Phd), Full Professor at Instituto Superior de Agronomia, Universidade de Lisboa.
Members: Manuel José de Carvalho Pimenta Malfeito Ferreira (Phd), Assistant Professor, with aggregation at Instituto Superior de Agronomia, Universidade de Lisboa, supervisor;
Sofia Cristina Gomes Catarino (Phd), Invited Assistant Professor at Instituto Superior de Agronomia, Universidade de Lisboa.
I
Acknowledgments
Firstly, I would like to express my sincere gratitude to my advisor Professor Manuel Malfeito Ferreira of Instituto Superior de Agronomia, for the continuous support on my master thesis, for his patience, motivation, and immense knowledge. His guidance helped me in all the time of research and writing of this thesis. I could not have imagined having a better advisor.
I must express my very profound gratitude to my mother, my father, my sister, my love and to my friends for providing me with unfailing support and continuous encouragement throughout my years of study and through the process of researching and writing this thesis. This accomplishment would not have been possible without them. Thank you.
My sincere thanks also goes to Ms. Helena, Ms. Manuela and Mr. António, for their precious support, help and patience during the wine tastings and to the students from the first year of the Master of Viticulture and Enology (ISA) for their enthusiastic and precious participation.
Besides my advisor, I would like to thank to Professora Mariana Mota, for her insightful comments and encouragement. I also take this opportunity to express gratefulness to all my professors of Instituto Superior de Agronomia, for their knowledge, help and support.
Finally, I am grateful to the God for the good health and wellbeing that were necessary to complete this work.
II
Abstract
The research performed in this thesis had as overall objective to fill the gap in the current literature about flavour thresholds and sensitivity to suprathreshold concentrations. Two groups of tasters were used, one comprised by 15 novices (student panel) and the other by 16 wine experts (professional panel). Detection (DT) and recognition (RT) thresholds were established in wine for six common off-flavour compounds when present in high concentration: acetaldehyde, acetic acid, ethyl acetate, hexanol, hydrogen sulfide and volatile phenols. Thresholds were evaluated orthonasally (ON) and retronasally (RN) by each participant, using the standardized procedures based on the ascending forced-choice (3-AFC) triangular tests. The suprathreshold intensity was obtained ON and RN after testing three measures of individual responsiveness: geometric mean (GM), area-under-curve (AUC) and slope of the response regression line.
DT and RT thresholds yielded overall results within the range reported in literature. Interestingly, in both threshold and suprathreshold tests, contrary to predictions based on reports of an association between expertise and improvement of the olfactory and gustatory sensitivity, the thresholds for the same molecules were similar between tasting panels, indicating that sensitivities were practically not affected by expertise. The relationship between threshold and suprathreshold intensities was also studied. In most cases there was not a relationship, implying that a low threshold does not necessarily lead to greater sensations elicited by suprathreshold concentrations. On the other hand, the results suggested that some subjects perceived the molecules differently on both orthonasal and retronasal pathways, presenting higher variability on the orthonasal evaluation comparing with the retronasal one.
Overall, results highlighted the high variability of individual olfactory responses and the importance of the retronasal pathway on the assessment of off-flavours in wines.
III
Resumo
O presente trabalho teve como objectivo preencher as lacunas existentes na literatura relativas aos valores de limiares e supra-limiares dos compostos voláteis constituintes do vinho. Neste contexto, foram determinados os limiares de detecção e de reconhecimento para seis dos compostos de defeitos mais comuns em vinho quando presentes em altas concentrações: acetaldeído, ácido acético, acetato de etilo, hexanol, sulfureto de hidrogénio (H2S) e fenóis voláteis, numa amostra de 15 provadores não treinados e de 16 provadores treinados. Os limiares foram avaliados por cada provador através de duas vias: ortonasal e retronasal, com base na metodologia padrão de comparação direcional de três amostras (3-AFC). As intensidades supra-limiares foram obtidas também pelas vias ortonasal e retronasal, sendo a sensibilidade individual avaliada através de três medidas: média geométrica, área-sob-curva e declive.
Os limiares de detecção e reconhecimento obtidos no presente estudo estão inseridos dentro da gama de resultados publicados na literatura. Curiosamente, nos testes de limiares e supra-limiares, contraditoriamente às conclusões publicadas em alguns artigos relativas à relação entre o conhecimento e a melhoria das sensibilidades olfactiva e gustativa, os valores de limiares para as mesmas moléculas de defeitos foram idênticos entre ambos os painéis de prova, indicando que a sensibilidade não é praticamente afectada pelo conhecimento do provador. A relação entre os limiares e supra-limiares também foi estudada. Em maior parte dos casos não houve relação, implicando que baixos limiares não conduzem necessariamente a grandes sensações relativamente a concentrações de supra-limiares. Por outro lado, os resultados sugeriram que alguns dos provadores apresentam diferenças de intensidade na percepção das moléculas quando comparada a via ortonasal com a retronasal, sendo que a avaliação ortonasal apresentou maior variabilidade. Esta observação indica que a resposta retronasal não deve ser descartada na avaliação de defeitos nos vinhos.
IV
Resumo alargado
A investigação desenvolvida ao longo da presente tese está inserida num projecto global que tem principal foco estudar e compreender o comportamento do consumidor relativamente a vinhos com características sensoriais incomuns, tendo como referência os defeitos. Nestes vinhos estão incluídos vinhos direccionados para nicho de consumidores que os aceitam mesmo apresentando características sensoriais diferentes dos vinhos ditos comerciais.
Como objectivo inicial, o trabalho desenvolvido focou-se em preencher as lacunas existentes na literatura relativas aos valores de limiares dos compostos voláteis constituintes do vinho. Neste contexto, foram determinados os limiares de detecção (DT) e de reconhecimento (RT) para seis dos defeitos mais comuns em vinho: acetaldeído, ácido acético, acetato de etilo, hexanol, sulfureto de hidrogénio (H2S) e fenóis voláteis, num painel de 15 provadores não treinados (6 provadores do sexo feminino e 9 do sexo masculino, com idades compreendidas entre os 23 e 36 anos; média 28 ± 4) e de 16 provadores treinados (8 provadores do sexo feminino e 8 do sexo masculino, com idades compreendidas entre os 30 e 65 anos; média 47±13). Os limiares foram avaliados por cada provador através de duas vias de percepção: ortonasal (ON) e retronasal (RN), com base na metodologia padrão de comparação direcional de três amostras (3-AFC), onde as amostras são apresentadas em ordem crescente de concentração e o provador é forçado a escolher uma das três amostras, em cada concentração (uma amostra contém o defeito e as outras duas apenas vinho).
Os resultados dos limiares de detecção e reconhecimento para o painel não treinado foram os seguintes: (i) acetaldeído em vinho branco (mg/L): DT no ON e RN: 12 e 14; RT no ON e RN: 46 e 70; (ii) ácido acético em vinho tinto (mg/L): DT no ON e RN: 302 e 481; RT no ON e RN: 658 e 1035; (iii) acetato de etilo em vinho branco (mg/L): DT no ON e RN: 14 e 17; RT no ON e RN: 27 e 29; (iv) hexanol em vinho branco (μg/L): DT no ON e RN: 72 e 107; RT no ON e RN: 402 e 370; (v) sulfeto de hidrogénio em vinho tinto (μg/L): DT no ON e RN: 83 e 73; RT no ON e RN: 286; e (vi) fenóis voláteis em vinho tinto (4-EF; 4-EG) (μg/L): DT no ON e RN: 29 e 31; RT no ON e RN: 35 e 31.
Os resultados dos limiares de detecção e reconhecimento para o painel treinado foram os seguintes: (i) acetaldeído em vinho branco – 1ª prova (mg/L): DT no ON e RN: 50 e 47; RT no ON e RN: 77 e 61; (ii) acetaldeído em vinho branco – 2ª prova (mg/L): DT no ON e RN: 15 e 14; RT no ON e RN: 27 e 21; (iii) acetaldeído em vinho branco – 3ª prova
V (mg/L): DT no ON e RN: 9 e 7; RT no ON e RN: 21 e 16; (iii) acetaldeído em vinho tinto (mg/L): DT no ON e RN: 24 e 18; RT no ON e RN: 26 e 39; (iv) acetato de etilo em vinho branco – 1ª prova (mg/L): DT no ON e RN: 54 e 50; RT no ON e RN: 87 e 65; (v) acetato de etilo em vinho branco – 2ª prova (mg/L): DT no ON e RN: 26 e 32; RT no ON e RN: 26 e 49; (vi) fenóis voláteis em vinho tinto – 1ª prova (4-EF; 4-EG) (μg/L): DT no ON e RN: 41 e 33; RT no ON e RN: 68 e 42; e (vii) fenóis voláteis em vinho tinto – 2ª prova (μg/L): DT no ON e RN: 31 e 33; RT no ON e RN: 49 e 40.
Quanto ao objectivo de caracterizar e entender a sensibilidade individual e a reposta sensorial dos provadores à presença dos defeitos no vinho, três medidas foram avaliadas – média geométrica, área-sob-curva e declive – com base em intensidades supra-limiares. No que diz respeito à analise sensorial com base nas concentrações supra-limiares, a metodologia consistiu na disposição alternada de cinco amostras com concentrações diferentes, em que a avaliação ortonasal foi com o auxílio de uma régua para medir a distância entre o copo da amostra e o nariz do provador, aquando o mesmo sentisse o odor do defeito e a avaliação retronasal foi com base na escala de Likert, que quantifica a intensidade da resposta sensorial numa escala.
Considerando os resultados das correlações entre cada par de medidas, os melhores resultados foram obtidos entre a média geométrica e a área-sob-curva, sendo que as correlações obtidas no que dizem respeito ao declive foram fracas, devido em grande parte à insensibilidade demonstrada pelo painel de provadores no decorrer da análise sensorial. Tendo também em conta todas as limitações relativas às suas determinações, a opção foi a de seleccionar a média geométrica como medida da sensibilidade individual. Individualizando as respectivas respostas sensoriais do painel não treinado com base na média geométrica, foi possível categorizar a sensibilidade dos provadores, contudo foi verificado uma grande variabilidade nas respostas e na percepção ortonasal e retronasal dos defeitos do vinho por parte dos provadores.
Para este estudo, também foi analisada a relação entre os limiares e supra-limiares. Os casos onde se verificaram a respectiva relação foram limitados. Curiosamente, nos testes de limiares e supra-limiares, contraditoriamente às conclusões publicadas em alguns artigos relativas à relação entre o treino e a melhoria das sensibilidades olfactiva e gustativa, os valores de limiares para as mesmas moléculas de defeitos foram idênticos entre ambos os painéis de prova, indicando que a sensibilidade não é praticamente afectada pelo treino do provador. Por outro lado, os resultados também sugeriram que alguns dos provadores apresentam diferenças de intensidade na
VI percepção das moléculas quando comparada a via ortonasal com a retronasal, sendo que a avaliação ortonasal apresentou maior variabilidade (maiores valores de desvio padrão). Esta observação indica que a resposta retronasal não deve ser descartada na avaliação de defeitos nos vinhos.
VII
Table of Contents
1. Introduction ... 1
1.1 Chemical basis of wine aroma ... 1
1.2 Off-flavours in wine ... 4
1.2.1 Acetaldehyde ... 7
1.2.2 Volatile acidity and ethyl acetate ... 7
1.2.3 Hexanol ... 8
1.2.4 Sulfur compounds ... 8
1.2.5 Volatile phenols... 8
1.3 Orthonasal and retronasal aroma perception ... 9
1.4 Suprathreshold and threshold sensory measures ... 11
1.5 Objectives ... 13
2. Materials and Methods... 14
2.1 Panel selection ... 14
2.2 Sensory sessions ... 14
2.3 Sample preparation ... 15
2.4 Sensory methodology for ortho- and retronasal perceptions ... 16
2.4.1 Suprathreshold flavour intensity test ... 16
2.4.2 Detection and recognition thresholds test ... 17
3. Results and Discussion... 19
3.1 Ortho- and retronasal detection and recognition thresholds ... 19
3.2 Comparison of individual flavour thresholds ... 21
3.3 Evaluation of the sensitivity to suprathreshold concentrations... 22
3.4 Individual and group suprathreshold intensity evaluation ... 26
3.5 Comparison between ortho- and retronasal intensity evaluation ... 30
3.6 Comparison between suprathreshold and threshold sensitivities ... 38
4. Conclusions and future perspectives ... 39
5. References ... 40
VIII
List of Tables
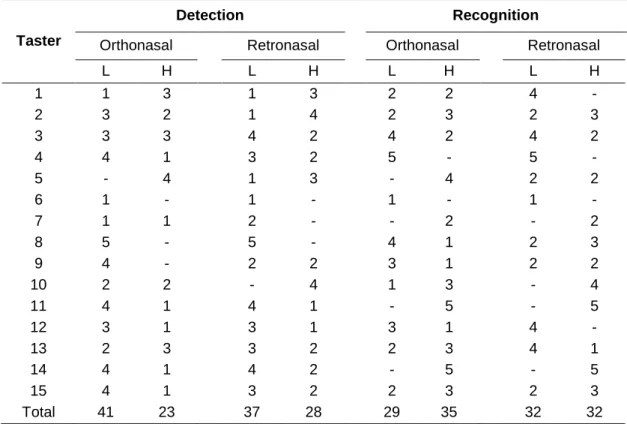
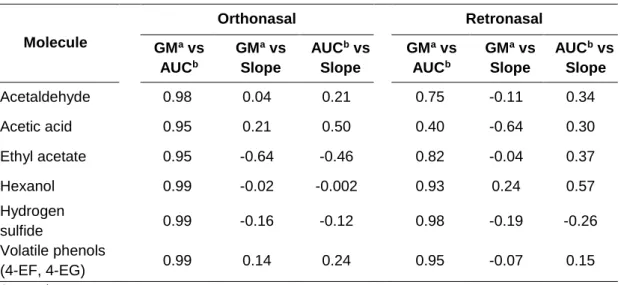
Table 1.1. Effects caused by the omission in the wine mixture (the aroma buffer) of one of the wine constituents (adapted from Ferreira et al., 2002).………4 Table 1.2. Effects caused by the addition of some selected aroma compounds to the wine mixture (adapted from Escudero et al., 2004)..………...4 Table 1.3. Most common off-flavours in wine (Ferreira et al., 2007)…..……….…………6 Table 2.1. Composition of the base wines used in the threshold and suprathreshold sensory tests………..…15 Table 2.2. Quantification of the volatile compounds in the base wines - acetaldehyde, ethyl acetate, hexanol and volatile phenols, and respective correspondence to the suprathreshold added concentration……..………15 Table 2.3. Added concentrations of the off-flavour molecules used in the threshold and suprathreshold sensory tests..……….………16 Table 3.1. Detection and recognition BET thresholds values for orthonasal and retronasal (professional panel).……….……….…………...19 Table 3.2. Significance of the difference (p-values) between (a) the first and third sensory sessions for acetaldehyde (in white wine) and between (b) threshold determination of acetaldehyde in white and in red wine (professional panel)……….20 Table 3.3. Detection and recognition BET thresholds for orthonasal and retronasal (student panel)..……….….……….. 20 Table 3.4. Number of threshold determination where the tasters were of high (H) or low (L) sensitivity for the orthonasal and retronasal pathways (student panel).……..……….22 Table 3.5. Correlation values (r2 values) for orthonasal and retronasal intensity measure for each molecule (student panel).……….……….24 Table 3.6. Slope, area-under-curve and geometric mean average values for orthonasal and retronasal intensity measure of the student tasting panel.………28 Table 3.7. Significance of the difference between the first and last concentration for orthonasal and retronasal intensity measure (student panel)...………..28 Table 3.8. Number of suprathreshold determination where the tasters were of high (H) or low (L) sensitivity for the orthonasal and retronasal pathways (student panel)….……29 Table 3.9. Mean and standard deviation values (cm) for each molecule, on orthonasal and retronasal, for all type of sensitivity tasters (student panel)..………36 Table 3.10. Coefficient of variation values for each molecule and all type of sensitivity tasters, on orthonasal and retronasal pathways (student panel).………36 Table 3.11. Mean and standard deviation values (cm) for each molecule, on orthonasal and retronasal, for all type of sensitivity tasters (professional panel)……….………37
IX Table 3.12. Coefficient of variation values for each molecule and all type of sensitivity tasters, on orthonasal and retronasal (professional panel)………..………37 Table 3.13. p-values of the difference between the intensity scores of the student and professional tasters.………..38
X
List of Figures
Figure 2.1. Suprathreshold intensity sample presentation scheme………17 Figure 2.2. Threshold sample preparation scheme………..18 Figure 3.1. Orthonasal and retronasal flavour intensity responses of three classes of subjects (A and B; C and D; E and F)for ethyl acetate (student panel)…..………23 Figure 3.2. Correlation values for ethyl acetate, between each pair of measure, for orthonasal and retronasal intensity (GM, geometric mean; AUC, area under the curve; Slope, slope of the regression line of the intensity scores) (student panel)………25
Figure 3.3. Intensity responses of the panel across all suprathreshold concentrations of acetaldehyde (A), acetic acid (B), ethyl acetate (C), hexanol (D), hydrogen sulfide (E) and volatile phenols (F) in wine solution, for orthonasal and retronasal pathways (student panel)………..27 Figure 3.4. Intensity scores for each suprathreshold concentration of acetaldehyde on orthonasal (A) and correspondent distribution on retronasal (B) and on retronasal (C) and correspondent distribution on orthonasal (D), for the same low and high sensitivity subjects………...30 Figure 3.5. Intensity scores for each suprathreshold concentration of acetic acid on orthonasal (A) and correspondent distribution on retronasal (B) and on retronasal (C) and correspondent distribution on orthonasal (D), for the same low and high sensitivity subjects..……….31 Figure 3.6. Intensity scores for each suprathreshold concentration of ethyl acetate on orthonasal (A) and correspondent distribution on retronasal (B) and on retronasal (C) and correspondent distribution on orthonasal (D), for the same low and high sensitivity subjects..……….32 Figure 3.7. Intensity scores for each suprathreshold concentration hexanol on orthonasal (A) and correspondent distribution on retronasal (B) and on retronasal (C) and correspondent distribution on orthonasal (D), for the same low and high sensitivity subjects..……….33 Figure 3.8. Intensity scores for each suprathreshold concentration of hydrogen sulfide on orthonasal (A) and correspondent distribution on retronasal (B) and on retronasal (C) and correspondent distribution on orthonasal (D), for the same low and high sensitivity subjects..……….34 Figure 3.9. Intensity scores for each suprathreshold concentration of volatile phenols on orthonasal (A) and correspondent distribution on retronasal (B) and on retronasal (C) and correspondent distribution on orthonasal (D), for the same low and high sensitivity subjects..……….35
XI
List of Annexes
Annex 1. Tasting sheet for suprathreshold intensity test………..48 Annex 2. Tasting sheet for threshold test………50 Annex 3. Individual and group best estimated thresholds for acetaldehyde, on orthonasal and retronasal pathways, over several sensory sessions performed by professional panel.……….. 52 Annex 4. Individual and group best estimated thresholds for ethyl acetate, on orthonasal and retronasal pathways, over several sensory sessions performed by professional panel..………. 55 Annex 5. Individual and group best estimated thresholds for volatile phenols (4-ethylphenol; 4-ethylguaiacol), on orthonasal and retronasal pathways, over several sensory sessions performed by professional panel.……….57 Annex 6. Individual and group best estimated thresholds for acetaldehyde, on orthonasal and retronasal pathways, performed by student panel.………59 Annex 7. Individual and group best estimated thresholds for ethyl acetate, on orthonasal and retronasal pathways, performed by student panel……….60 Annex 8. Individual and group best estimated thresholds for hexanol, on orthonasal and retronasal pathways, performed by student panel………61 Annex 9. Individual and group best estimated thresholds for acetic acid, on orthonasal and retronasal pathways, performed by student panel……….62 Annex 10. Individual and group best estimated thresholds for hydrogen sulfide, on orthonasal and retronasal pathways, performed by student panel……….63 Annex 11. Individual and group best estimated thresholds for volatile phenols (4-ethylphenol; 4-ethylguaiacol), on orthonasal and retronasal pathways, performed by student panel………..64 Annex 12. Taster characterization according sensitivity classes (H-high; L-low) for each molecule on orthonasal and retronasal pathways, regarding detection and recognition threshold results (student panel)……….65 Annex 13. Taster characterization according sensitivity classes (H-high; L-low) for each molecule on orthonasal and retronasal pathways, regarding suprathreshold intensity concentration (student panel)………..66
1
1. I
NTRODUCTION
In accordance to the movement of society, wines are also following the tendency to meet the essence and purity of the practices, from the vineyard to the winery (Lalas, 2018). As regards viticulture and oenology, biodynamic, organic and natural wines have received increasing attention over the last few years. These styles of wine have become increasingly popular as the customers demand for wines that are made in a minimum-intervention style (Wilson, 2016). However, according to Guzzon et al. (2016), many doubts remain among winemakers in relation to its applicability on a large scale for the production of wines and its quality acceptance by consumers.
Generally, the perception of wine quality is easier to recognize than it is to define and it is more related to the intrinsic aspects of wine (Villamor, 2012). Indeed, for example, while the colour, brand or reputation of wine is important to consumers, it is the aroma and taste of wine that have the greatest impact for wine enjoyment. This sensory experience is usually pleasurable. In agreement with Puckette (2014), the first flavours that consumers learn to identify in wine are fruit flavours, perhaps because these are the most gratifying. However, it can at times be a less-than-pleasant surprise with off-flavours, many of which are weird and require an acquired taste (Bartowsky & Pretorius, 2009). Maybe that is one of the reasons why, according to Asimov (2018), wines affected by off-flavours are quickly judged by consumers. Actually, according to Lalas (2018), some “imperfections” or “off-flavours” may rather be associated with some of these wines. However, it is important to take in consideration that the perception of off-flavours depends on the consumer and its capacity to understand them, because the aroma and flavour perceptions are highly individual.
1.1 Chemical basis of wine aroma
Wine aroma is very complex. In agreement with Francis and Newton (2005) and Ferreira et al. (2007), at the core of the quality (or the lack of it) of a wine there is a large amount of odour active compounds. One of the long-standing goals of wine aroma research has been to identify those volatile and non-volatiles compounds that are central to particular olfactory attributes of wines, whether perceived ortho- or retronasally, and understand their role in the final perception of the wine.
By the late eighties of last century, chemists had identified more than 800 compounds in the volatile fractions of wines (Schreier, 1979; Maarse & Vischer, 1989). This was a sort of bitter success since so much of that information was apparently mostly useless.
2 In line with Ferreira et al. (2007), the first reason for that apparent failure was because researchers at that time tried to identify all the molecules present in the volatile fraction of wine instead of concentrating on those that really have the power to impact the pituitary tissues. The second one is linked to the complexity of wine flavour: only in a limited number of cases can a single odour molecule be explicitly recognised in the aroma or flavour of the wine. It is not surprising, therefore, that the major successes had come in the identification of off-flavours. The third reason is that at that time it was very difficult to get accurate quantitative data on some of the molecules present at low concentrations. All those limitations have been slowly and progressively solved in the last 10 or 15 years due to the progress made in the quantitative determination of some important odorants and due to the systematic development of gas chromatography-olfactometric (GC-O) methods that have made it possible to screen from all the volatile compounds of wine, those that really have the ability to be flavour active (Ferreira et
al., 1998; Lopez et al., 2003; Cullere et al., 2004; Escudero et al., 2004).
The chemical basis of wine aroma according to Ferreira et al. (2007), may be explained by the role played by the following compounds:
(i) Impact or highly active compounds.
These are the compounds which can effectively transmit their specific (impact) or primary (highly active) aroma nuance to a given wine without the need of the support of more aroma chemicals. The best example is given by the molecule of linalool.
(ii) Impact groups of compounds.
These are constituted by families of compounds usually having similar chemical structures, with close odour properties and that can impart to the aroma of a wine the specific notes of the family. An example is the group of γ-lactones.
(iii) Subtle compounds.
These are the compounds which fail to transmit their specific aroma nuances to the wine but contribute decisively to the development in wine of some secondary-generic aroma nuance (for instance fruity, sweet).
(iv) Compounds forming the base of wine aroma.
These are the compounds present in all wines at concentrations above their corresponding odour thresholds which, however, are no longer perceived as single entities because their aromas are fully integrated to form the complex concept of wine aroma.
3 (v) Off-flavour compounds.
These are the compounds whose presence brings a decrease in the overall aroma quality of wine.
The mixture of all the major fermentation compounds at the concentrations at which they are usually found in wine has the typical odour of alcoholic beverages that often is define as vinous (Ferreira et al., 2007). The key point is that this mixture forms what they call an aroma buffer. Both effects of aroma buffer were described by Ferreira et
al. (2002) and Escudero et al. (2004), concluding that the omission or addition of some
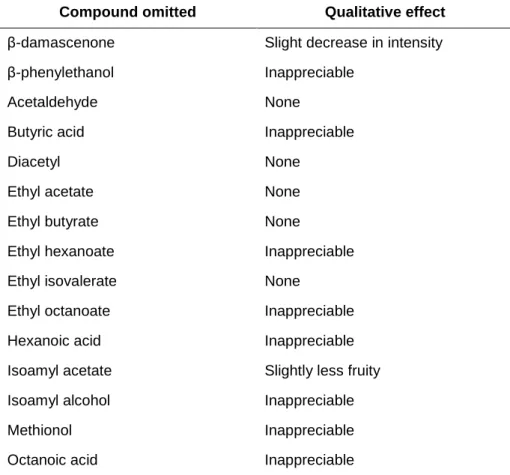
compounds does not bring about important changes in wine aroma. Therefore, it could be said that wine forms some kind of aromatic buffer towards a wide range of aromas. Table 1.1. shows the effects of omission from the mixture of wine major compounds of one of the odorants, that, in most cases, had no effect, or a just apparent effect that the judges were not able to define. Only in the cases of isoamyl acetate and β-damascenone there were slight effects on the fruitiness of the mixture. Table 1.2. shows the effect of the addition of different aroma compounds to the mixture of wine major compounds. The addition of high amounts of some odorants has nearly no effect, or in some cases the effect is not the perception in the mixture of the added odorant but a decrease on some of the basic attributes of the mixture (except for isoamyl acetate).
According to Escudero et al. (2004) and Ferreira et al. (2007), the aroma buffer would be caused by the presence in wine of relatively high concentrations of ethanol and other volatiles formed by fermentation such as ethyl esters, fusel alcohols, volatile phenols, β-damascenone, and fatty acids. Fortunately, the aroma of many wines is very rich in aroma nuances that are quite different to the basic ‘vinous’ aroma of the aroma buffer. This clearly means that some aroma molecules succeed in some wines in breaking the buffer and produce a different sensory perception, transmitting a different aroma nuance. In line with Ferreira et al. (2007), the first way to break the buffer is by a single odorant molecule at the concentration at which it can be naturally found in some wines. There are only few aroma chemicals that can act as impact compounds: linalool, c-rose oxide, 4-mercapto-4-methylpentan-2-one, 3-mercaptohexan-1-ol, sotolon, furfurylthiol, 3-mercaptohexyl acetate, benzylmercaptan, dimethyl sulphide, methional, diacetyl, isoamyl acetate and rotundone. A second way to break the buffer is by the concerted action of a group of molecules sharing chemical and odour properties. The third way to break the buffer is by the concerted action of many chemicals sharing some similarity in any of their generic aroma descriptors. Of course, the buffer can be broken, but in a negative way, by many chemicals playing the role of off-flavours.
4
Table 1.1. Effects caused by the omission in the wine mixture (the aroma buffer) of one of the wine constituents (adapted from Ferreira et al., 2002).
Table 1.2. Effects caused by the addition of some selected aroma compounds to the wine mixture (adapted from Escudero et al., 2004).
Compound added (level and relative increment) Effect Observations
2,6-dimethoxyphenol (2 ppm; 4000x) Slight - flowery; - candy β-damascenone (4.5 ppb; 1x) None
Ethyl octanoate (6.0 ppm; 8.6x) None Furaneol (800 ppb; 27x) None
Guaiacol (15 ppb; 71x) Slight - candy; - flowery Isoamyl acetate (5.5 ppm; 2.2x) Slight + banana
Sotolon (140 ppb; 28x) Slight - fruity; - candy
1.2 Off-flavours in wine
One important prerequisite related with marketing and commercial implications for wine and similar products of high quality is to be free of aroma imperfection. As explained by Rapp (1990), these “imperfections” in wine are of a complex nature because the undesirable aromas can be varietal specific flavours (e.g. black pepper) or can be formed during the production and bottling of wine (e.g. corkiness, mousiness). The
Compound omitted Qualitative effect
β-damascenone Slight decrease in intensity β-phenylethanol Inappreciable
Acetaldehyde None
Butyric acid Inappreciable Diacetyl None
Ethyl acetate None Ethyl butyrate None
Ethyl hexanoate Inappreciable Ethyl isovalerate None
Ethyl octanoate Inappreciable Hexanoic acid Inappreciable Isoamyl acetate Slightly less fruity Isoamyl alcohol Inappreciable Methionol Inappreciable Octanoic acid Inappreciable
5 effect depends on the style of the wine, the concentration of the aroma compound, the sensitivity of the consumers and, as it affects the wine enjoyment, it is extremely difficult for the consumers to make an accurate judgement of the wine.
The first thing that should be said is that the concept of off-flavour is relative, because it is, at least in part, related to the previous experiences and expectations of the consumer. As mentioned by Ferreira et al. (2007) there are many examples of this. Many local producers and ‘traditional’ consumers of Spanish wines from Rioja became so familiar with the presence of small amounts of ethyl phenols in their wines, that for them the phenolic-note produced by those compounds is something essential in the wines. The same is also observed among producers of Beaujolais. Similarly, some producers of wines from Sauvignon Blanc are quite happy with the earthy and black-pepper notes introduced by methoxypyrazines. In some other cases, however, there is a large world-wide consensus about the negative role of some molecules, such as TCA (trichloroanisole; cork taint). It also necessary to point out that some apparently ‘bad’ molecules can sometimes play an interesting role on wine aroma, such as dimethyl sulfide that enhance the fruitiness in some red wines (Escudero et al., 2007).
The second point that should be remarked is that, in general, the negative role of many aroma molecules is noted at concentrations well below the level at which those molecules are clearly perceived in wine. Before reaching such recognition threshold, the effect of these molecules is to decrease some positive sensory characteristics of the wine, and sometimes even to unbalance the wine aroma.
The final comment is that sometimes the off-flavours can be produced by relatively large amounts of fermentation by-products (isoacids, acetoin, vinylphenols, some alcohols) acting in a concerted way, so the individual compounds do not need to be present at the concentrations at which they usually are considered a risk to quality. This phenomenon was described by Escudero et al. (2007) and apparently could be one of the most important causes of low quality observed in many wines.
Therefore, according to Capone et al. (2010), off-flavours are unacceptable odours or tastes that result from product components formed by chemical or biological processes (e.g. microbiological spoilage) within the product, attributed to poor winemaking practices and/or inadequate storage conditions. Compounds causing off-flavours in wine are often present at higher concentrations that can lead to undesirable sensory characteristics. Table 1.3. summarises the different wine compounds that have been
6 documented as potential wine off-flavours that generally strongly influence the wine quality. The compounds off-flavours described in the next sections are the focus of the present overall study where this research is included.
Table 1.3. Most common off-flavours in wine (Ferreira et al., 2007).
Off-flavour/Compound Descriptors Possible causes Sensory thresholds
Acetaldehyde/Oxidation Green apple, stuck ferment aroma
-Bacterial spoilage (genus
Acetobacter,Gluconobacter);
-Oxidation.
500 μg/L (in water/ethanol) (Guth, 1997)
Acetic Acid Vinegar odour -Bacterial spoilage (genus
Acetobacter, Gluconobacter); - Yeast spoilage; -Oxidation. 0.2 g/L (in water/ethanol) (Guth, 1997) Cork taint (2,4,6-trichloranisole: TCA) Musty, earthy, moldy odours
-Presence of fungi on cork stopper.
2.1 ng/L (detection threshold in red wine)
(Prescott et al., 2005)
Ethylacetate Nail polish remover odour
-Yeast spoilage (apiculate yeasts);
- Bacterial spoilage.
6.4 mg/L; 13.3 mg/L (detection and recognition thresholds in air, respectively) (Hellman & Small, 1973)
Geosmin
(earthy-type taint)
Earthy, musty odours
-Metabolite of Botrytis cinerea, soil bacteria and algae.
25 ng/L (in red wine) (AWRI, 2018)
Geranium Crushed geranium leaves odour
-Metabolism of sorbic acid by lactic acid bacteria.
100 ng/L (AWRI, 2018)
Hexanol Herbaceous odour
-Grape maturation. 8 mg/L (in water/ethanol) (Guth, 1997) Mousy taint (2-acetyltetrahydro-pyridine ACTPY), 2-ethyltetrahydropyridine (ETPY), 2-acetylpyrroline (ACPY) Caged mice, cracker biscuit odours
-Bacterial spoilage (genus
Lactobacillus and Oenococcus oeni);
-Yeast spoilage (Brettanomyces); -Oxidation (unknown
mechanism).
ACTPY: 4.8-106 μg/L; ETPY: 2.7–18.7 μg/L; ACPY: 7.8 μg/L (in wine) (AWRI, 2018) Sulfur compounds (H2S, ethyl mercaptan, dimethysulfide) Rotten egg, garlic, onion, cooked vegetable
-Produced in excess by yeasts during fermentation;
-Reduction.
H2S: 5.7 – 7.9 µg/L (detection threshold in air)
(Young & Adams, 1966)
Volatile phenols (4-ethylphenol (4-EP), 4-ethylguaiacol (4-EG)) Barnyard, horse, wet leather odours
-Yeast spoilage during wine storage tank, barrique or bottle (genus Brettanomyces,
Dekkera).
4-EP + 4-EG: 114.3 μg/L (in wine)
(Csikor, Pusztai & Barátossy, 2018)
7 1.2.1 Acetaldehyde
Acetaldehyde, also known as ethanal, is the most important aldehyde occurring in wine. It is primarily a product of yeast metabolism of sugars during the first stages of alcoholic fermentation (Jackson, 2008). It is the last precursor in yeast fermentation before ethanol is formed, and is produced when pyruvate is converted by the enzyme alcohol dehydrogenase (ADH) to acetaldehyde. Conversely, a secondary source of acetaldehyde production, which usually occurs after wine ageing, is oxidation of ethanol, once again facilitated by the enzyme ADH (Jackowetz et al., 2010). It is sporadically associated with spoilage by acetic acid bacteria. As an intermediate in the bacterial formation of acetic acid and under low-O2 conditions and/or alcohol levels greater than 10% v/v, tends to accumulate instead of being oxidised to acetic acid (Theron, 2017).
1.2.2 Volatile acidity and ethyl acetate
Volatile acidity (VA) is one of the most important characteristics of wines, contributing directly and indirectly to their quality. It is not possible to produce wine without VA, since acetic acid, the major acid compound (90%), can be primarily produced in low concentrations during the alcoholic fermentation step by yeasts and also formed by bacterial metabolism, such as acetic acid bacteria (AAB) and lactic acid bacteria (Miranda et al., 2017). The AAB oxidize the ethanol to acetic acid and based on the findings of Bartowsky and Henschke (2008), there are two membrane-bound enzymes catalysing the reactions: alcohol dehydrogenase (ethanol to acetaldehyde) and acetaldehyde dehydrogenase (acetaldehyde to acetic acid). The recognition of VA in wines, namely the “acetic nose”, is not exclusively the result of the acetic acid levels, but severally depends on the acetic acid and ethyl acetate ratio (Zoecklein, 2012).
Ethyl acetate is the most common ester present in wine and results from the combination between the acetic acid formed with the alcohol remaining in the wine. According to Nogueira and Nascimento (1999), the concentration of both compounds in wine depends severally on the yeast strain, since that, as acetic acid, ethyl acetate can also be formed by the action of apiculate yeasts during fermentation and depends on the action of AAB during ageing. As explained by Cliff and Pickering (2006), the presence of both compounds below perceptible levels can enhance the fruitiness flavour and add complexity to wine, while above it can be considered undesirable and may evidence microbiological problems. Although the incidence of excess ethyl acetate is statistically lower than that of the acetic acid, the first one is considered a more serious problem because of its greater organoleptic impact, given its ability to completely degrade the typicalty of a wine.
8 1.2.3 Hexanol
Hexanols are the major C6-alcohols compounds (higher alcohols) and donate a
herbaceous odour to certain wines due to problems in grape ripening. However, they may be present in healthy grapes but rarely occur in significant amounts (Jackson, 2008). Part of the compounds present in wines has six carbon atoms deriving from grape polyunsaturated fatty acids (primarily originated from membrane lipids), namely linoleic and α-linolenic acids (Oliveira et al., 2006).
1.2.4 Sulfur compounds
As a consequence of yeast metabolism, heat treatment, light exposure, or other nonenzymatic reactions, a wide diversity of volatile sulfur-containing compounds may be produced during fermentation, ageing, and post-bottling. Although generally occurring in trace amounts, their high volatility and low sensory thresholds, can impart a great significance (Jackson, 2008). The principal offending compounds are reductive aromas developed by disulphides, mercaptans and hydrogen sulfide (H2S). The last one is the most common volatile sulfur compound in wine and it may be formed during fermentation, as yeasts reduce residual elemental sulfur (Schütz & Kunkee, 1977), or metabolize sulfur-containing amino acids, notably cysteine and methionine (Henschke & Jiranek, 1991).
1.2.5 Volatile phenols
Of the spoilage yeasts, Brettanomyces spp. (imperfect state of Dekkera) are probably the most notorious (Larue et al., 1991). As explained by Kheir et al. (2013), in some cases, depending the conditions and the available precursors (hydroxycinnamic acids, also called phenolic acids such as ferulic and p-coumaric acids), these yeasts can produce undesirable metabolites (volatile phenols) when growing and/or ageing in wine. In agremeent with Loureiro and Malfeito-Ferreira (2006), the recognition of the role played by the species in red wine spoilage due to the production of “horse sweat” taint has presented a new challenge to winemakers in the last decade. Surprising to those who detect the malodorous by-products of Brettanomyces metabolism, some winemakers appear to appreciate its effects on their wines (Steele, 2004). As identified by Suarez et al. (2007), their origin involve the sequential action of two enzymes on a hydroxycinnamic acid substrate. Hydroxycinnamate decarboxylase first turns these acids into vinylphenols (4-vinylphenol and 4-vinylguaiacol), possibly followed by reduction to ethylphenols (4-ethylphenol and 4-ethylguaiacol) by vinylphenol reductase (Chatonnet et al., 1992). Although several bacteria and yeasts are capable of
9 metabolizing hydroxycinnamates to vinylphenols, only a few yeasts, notably those belonging to the genus Brettanomyces spp., can convert substantial amounts to ethylphenols (Chatonnet et al., 1992).
1.3 Orthonasal and retronasal aroma perception
Although closely related, flavour, aroma, smell and taste are not exactly interchangeable (Puckette, 2014). Flavour is the result of the simultaneous stimulation of three principal sensory systems: taste, olfaction (aroma) and the trigeminal system. The latter comprises chemical, thermal and tactile sensations (Cerf-Ducastel & Murphy, 2001). Taste refers to the senses inside our mouth including the tongue (Puckette, 2014). Every human tongue has two kinds of receptors: one type is for taste, known as ‘taste buds’, which can be found all over the tongue. While the other receptor is for tactile sensations that refers to the free nerve endings sensed all over the inside of the mouth and tongue. In simple language, taste buds focus primarily on sweet, salt, bitter and sour, while the mouthfeel, as a sensory propriety, focuses on viscosity (i.e. body), tannins, and the overall texture of the wine (Puckette, 2014). Aroma and bouquet are just pleasant words used to describe the odours (Puckette, 2014). Odours are volatilized compounds sensed in our brain by the limbic system which deals with emotion, behaviour, motivation and long-term memory. An odour molecule may reach the olfactory epithelium via the nose (orthonasal olfaction), referred to the external world, or via the mouth (retronasal olfaction), referred to the oral cavity (Rozin, 1982). The illusion that retronasally perceived odours are localized to the mouth is so powerful that people routinely mistake retronasal olfaction for “taste” (Rozin, 1982). As an example, we may say that we like the “taste” of a wine because of its fruity or spicy notes. However, taste refers only to the sensations of sweet, sour, salty and bitter, and thus the pleasant “taste” to which we refer is actually a pleasant odour sensed retronasally.
The perception of volatiles and non-volatiles aroma compounds by orthonasal and retronasal pathways has been of particular interest in flavour research and strong evidence has shown that odours are perceived differently when presented in ortho- versus retronasal modes (Rozin, 1982; Halpern, 2004; Heilmann & Hummel, 2004; Small et al. 2004; Small et al. 2005; Sun & Halpern, 2005; Hummel & Heilmann, 2008; Welge-Lussen et al., 2009). In 1982, Rozin was the first one that observed that “olfaction is the only dual sensory modality, in that it senses both objects in the external world and objects in the mouth” and thus proposed that “the same olfactory stimulation may be perceived and evaluated in two qualitatively different ways depending on
10 whether it is referred”, which suggested that orthonasal and retronasal olfactory perceptions are two different systems. However, several studies testing Rozin’s hypothesis have yielded mixed results, with several authors concluding that orthonasal and retronasal olfaction differ only in the efficiency with which odours are delivered to the olfactory epithelium (Burdach et al., 1984; Voirol & Daget, 1986; Pierce & Halpern, 1996; Bojanowski & Hummel, 2012). So for a while no support was found for the 'olfactory duality' hypothesized by Rozin (1982). Most studies comparing orthonasal versus retronasal have focused upon qualities of the experience that provide information about the quantity or identity of the sensory stimulus, whereas the key distinction Rozin had made was that route of delivery influenced not what the stimulus was but rather where the stimulus was perceived. Generally, in these studies were found greater intensity for orthonasal than for retronasal stimulation. Specially, Voirol and Daget (1986) have shown that perception intensity depends on the absolute quantity of odorant reaching the olfactory epithelium, which corresponds to the difference in the air flow between sniffing and exhalating, inducing higher intensity judgement for the orthonasal mode. Given the proposed importance of retronasal in the oral perception of wines, usually the retronasal identification accuracy is inferior to orthonasal under normal breathing conditions which may seem counterintuitive. Nonetheless, this was observed repeatedly in Pierce and Halpern (1996): the vapour phase has been reported to be less efficiently sensed by the retronasal than by the orthonasal.
Although several studies have examined brain responses to retronasal olfactory stimulation (de Araujo et al., 2003; Small et al., 2004), none have directly compared orthonasal and retronasal in the same subjects or considered the possibility that the effects of route of stimulation depend on the way that odours are typically sensed. The findings of Small et al. (2005) clearly support all these notions by demonstrating that the neural response evoked by an odour may be influenced by its route of administration. First, imaging techniques like functional magnetic resonance imaging (fMRI) allowed to identify that activation due to retronasal stimulation was found at the base of the central sulcus, corresponding to the primary representation of the oral cavity, possibly reflecting that retronasal odours are referred to the mouth. In second, the stimulus studied “chocolate” was perceived as similarly intense and pleasant across both orthonasal and retronasal administration, thus the only perceptual difference was related to where the stimulus was referred (nose vs mouth). In Small et al. (2004) and Small et al. (2005) studies, they identified the preferential activation in different brain areas in response to ortho- and retronasally presented stimulus. It was observed
11 deactivation in the orbitofrontal cortex, insula and anterior cingulate cortex for taste-orthonasal stimulus, and supra-additive responses at the same regions for the combination of taste-retronasal stimulus. The results clearly indicate that the neural processing of an odour is influenced by its route of administration.
1.4 Suprathreshold and threshold sensory measures
Individual perception of aroma and taste are challenging to measure and there is no single method to assess it. Indeed, five distinct methods have been used by researchers to understand individual’s sensitivity to tastes: detection threshold (DT) and recognition threshold (RT), suprathreshold intensity measure, 6-n-propylthiouracil (PROP) taster status and fungiform papillae (FP) number (Webb et al., 2015). In the present study, the methods used were the detection and recognition thresholds and suprathreshold intensity regarding flavour active molecules. An individual sensing an odour is directly aware of only two sensory properties of the odour: intensity (how strong it smells) and character (what it smells like). These sensations are interpreted based on prior experience and expectations. Most studies about flavour perception (Prescott
et al., 2005; Pickering et al., 2007; Ross et al., 2014; Chrysanthou et al., 2016) do not
reflect the prime importance of odour intensity. Instead, they emphasize odour threshold: a measure of dilution needed to reduce the perceived odour intensity to some defined probability of detection level. It resulted from an earlier assumption that threshold multiples are measures of odour intensity. In line with Dravnieks and Jarke (1980), it is now known not to be true. The perceived odour intensities, as on a typical scale of none/very faint/faint/easily noticeable/strong/very strong, relate to the threshold multiples differently for different odorants. Because of the lack of direct relation between odour thresholds and intensities, there is a growing interest in measuring the perceived odour intensities directly (Dravnieks & Jarke, 1980).
Detection threshold (DT) and recognition threshold (RT) provide estimates of the lowest chemical concentration that can be perceived by an individual. For example, a solution may contain a substance at a concentration undetectable to the general population, but as the concentration is increased, a DT is attained such that the solution can be discriminated from pure solvent in a forced choice task. As the concentration is further increased, a RT is attained, and this is the point where the substance is both perceived and identifiable (Keast & Roper, 2007). It is widely accepted that individuals with lower detection and recognition thresholds are more sensitive to a chemical than those with a higher detection and recognition thresholds. Thresholds are determined using a classic psychophysical protocol - ASTM E 679 - described by the American Society for
12 Testing and Materials (ASTM, 2004), defined as the method of limits with an ascending concentration series using 3-alternative forced-choice (3-AFC) at each concentration. In a forced-choice method, the judgment is made after smelling several stimulus, including blanks. This offers an advantage over methods in which one stimulus is judged at a time and progressively stronger odorous sample concentrations can be systematically evaluated. The forced-choice method also reduces the problems stemming from odour adaptation.
Suprathreshold intensity refers to the perceived intensity (magnitude) of a substance at concentration above threshold. As the stimulus concentration increases, it is expected that the perceived intensity will also increase, eventually reaching to a terminal threshold for the stimulus: it occurs at concentration between the recognition threshold and the terminal threshold (suprathreshold) (Webb et al., 2015). Odour intensities are expressed by scales based on descriptive categories or on estimates of magnitude. In all cases, the measurement is a sensory evaluation (Turk et al., 1980). However, intensity is an individual difference characteristic defined in terms of the typical strength of an individual's responsiveness (Larsen & Diener, 1987) and relatively to the individual sensitivity measurement there are few studies. In Webb et al. (2015), suprathreshold taste intensity concentrations were presented based on geometric mean, however they did not relate with the individual sensitivity. Geometric mean (GM) is often used to evaluate data covering several orders of magnitude, and sometimes for evaluating ratios and percentage changes. The geometric mean, unlike the arithmetic mean, tends to dampen the effect of very high or low values, which might bias the mean if a straight average (arithmetic mean) was calculated (Costa, 2018). In Peng et al. (2016) the area-under-curve (AUC) measure was used to serve as a quantifier of people’s sensitivity for detecting stimulus. With AUC the sensitivity can be computed across all the possible suprathreshold and threshold intensities and the correspondent plot curve and area under the curve, as an effective measure of sensitivity, have been considered with meaningful interpretations. This curve plays a central role in diagnostic test evaluation, finding the optimal cut off values, and comparing two alternative diagnostic tasks when each task is performed on the same subject (adapting, for example, for comparisons between orthonasal and retronasal flavour perceptions) (Hajian-Tilaki, 2013). Besides these two sensitivity measures, in this study the slope of the intensity plot will be evaluated also as an individual sensitivity measure. Although no study refers the slope as a measure of individual sensitivity, Turk
13
1.5 Objectives
The research performed in this thesis was the initial step of a global project aimed at understanding the consumer behaviour regarding wines with unusual sensory features like off-flavours or off-tastes. These wines include those directed to niche consumers that are willing to accept wines with sensory characteristics distinct from the flawless international commercial ones. The first overall objective was to fill the gap in the current literature about thresholds and its real representativity in wines matrixes by both smell pathways (orthonasal and retronasal), since most of the published values are measured in water/ethanol solutions and only by the orthonasal route. Another overall research objective was to characterize and understand the sensitivity and sensory response to the presence of off-flavours related with the above mentioned niche wines. In particular, the specific objectives of this study were:
(i) To evaluate sensory thresholds (detection and recognition) of different off-flavours, for both orthonasal and retronasal pathways in wine;
(ii) To evaluate different measures of individual sensitivity to flavours in wine;
(iii) To understand the relation between suprathreshold flavour sensitivity and sensory thresholds.
14
2. M
ATERIALS AND
M
ETHODS
2.1 Panel selection
The tasting sessions involved a total of 15 students selected from the first year of the Master of Viticulture and Enology held at the Instituto Superior de Agronomia in 2017/2018 (ISA, University of Lisbon). The tasting panel comprised 6 females and 9 males ranging in age from 23 to 36 years old (28 ± 4). None of the students had previously been trained in experiments on odour and taste sensitivity, however they reported that were aware of the fundamental concepts related to wine tasting. In parallel, another panel was used comprising 16 wine professionals between 30 and 65 years old (8 females and 8 males, 47±13), with more than five years of experience in wine tasting. The untrained panel will be mentioned as the student panel and the trained panel as the professional one. In both cases the number of tasters was higher than 9, which is regarded as the minimum necessary to obtain a sufficient number of data points for sample comparisons if each panelist evaluates only once, according to Dravnieks and Jarke (1980).
2.2 Sensory sessions
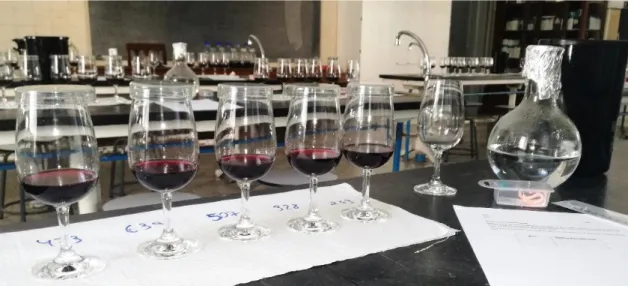
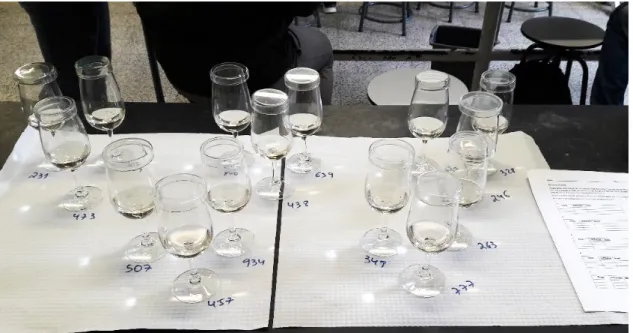
All the sessions were conducted in the Laboratory of Microbiology (ISA) and lasted 1 h each weekly session from March to May 2018. Each session took place in the morning and was divided in three phases, corresponding each phase to a different test that involved both orthonasal and retronasal evaluations. The first one corresponded to the intensity test, where the subjects evaluated different suprathreshold concentrations of off-flavours. The second and third phases corresponded to the detection and recognition threshold tests, respectively. Tasters were provided each weekly session with a different off-flavour to evaluate.
For all tastings, the samples were presented to the panel coded with three-digit random numbers and without further information. Sample volume was 25 mL of wine served at room temperature (23 ± 2 ºC) in tasting glasses according the requirements of ISO 3591:1997 standard and covered with a petri dish for 1 h before tasting. Tasters were given unsalted crackers, a spitter and demineralized water to cleanse the palate before the tests and between the samples. A break was enforced between each odorant concentration and between each test to minimise sensory saturation. Adapting some of the minimum requirements from ISO 8589:2010 standard, the samples were prepared in a near room separated from the tasting area and were evaluated on the benches of a well-ventilated classroom.
15
2.3 Sample preparation
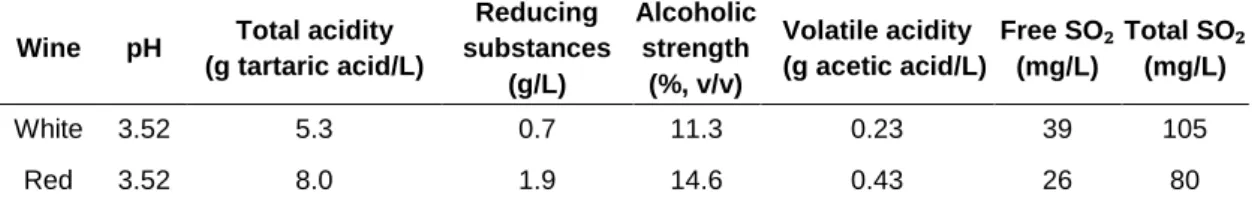
The wines were produced in the ISA experimental winery following conventional winemaking techniques. White wine produced in the year 2016 was made from Macabeu variety while a blend of Cabernet Sauvignon and Syrah from the year 2017 was used in the red wine. The physical-chemical analysis of both wines is shown in Table 2.1. and was performed by Laboratory Ferreira Lapa, in Instituto Superior de Agronomia. Previous sensorial tasting by the laboratory trained staff did not reveal the presence of off-flavours in the base wines. However, analysing the results in Table 2.2. from ETSIAAB in Universidad Politécnica de Madrid, in the wines there were effectively the presence of the molecules acetaldehyde, ethyl acetate and volatile phenols.
Table 2.1. Composition of the base wines used in the threshold and suprathreshold tests.
Wine pH Total acidity
(g tartaric acid/L) Reducing substances (g/L) Alcoholic strength (%, v/v) Volatile acidity (g acetic acid/L) Free SO₂ (mg/L) Total SO₂ (mg/L) White 3.52 5.3 0.7 11.3 0.23 39 105 Red 3.52 8.0 1.9 14.6 0.43 26 80
Table 2.2. Quantification of the volatile compounds in the base wines - acetaldehyde, ethyl acetate, hexanol and volatile phenols, and respective correspondence to the suprathreshold
added concentration.
Molecule Added concentration (mg/L)
0 125 250 500 1000
Acetaldehyde
(in white wine) 37 28 127 109 202 Ethyl acetate
(in white wine) 19 165 216 523 855
Added concentration (μg/L)
125 250 500 1000 2000
Hexanol (in white wine) 142 266 451 976 1679 Volatile phenols (4-EF)
(in red wine) 624 842 1036 1760 3326
A total of six off-flavour compounds were tested (acetaldehyde, acetic acid, ethyl acetate, hexanol, hydrogen sulfide, volatile phenols (4-ethylphenol and 4-ethylguaiacol in 10:1) by spiking the basic white and red wines as described in Table 2.3. Five concentration steps were made with a constant 2-fold dilution factor throughout the range. The concentration series for each odorant was initially established with reference to the detection threshold range reported in the literature. All solutions were prepared approximately 24 hours before the sensory session and tested by three members of the laboratory staff to check the presence of the odour.
16
Table 2.3. Added concentrations of the off-flavour molecules used in the threshold and suprathreshold sensory tests.
Molecule Solution´s information Test Concentration level 1st 2nd 3rd 4th 5th Acetaldehyde in white wine (mg/L)
Fluka product CAS Number: 75-07-0 Suprathreshold 0 125 250 500 1000 Threshold 15.625 31.25 62.5 125 250 Acetic acid in red wine (mg/L)
Acetic acid glacial; PanReac product code: 131008 Suprathreshold 250 500 1000 2000 4000 Threshold 125 250 500 1000 2000 Ethyl acetate in white wine (mg/L) BDH chemicals product code: 28311 Suprathreshold 0 125 250 500 1000 Threshold 15.625 31.25 62.5 125 250 Hexanol in white wine (μg/L) 1-hexanol; Sigma-aldrich product CAS Number: 111-27-3 Suprathreshold 0 500 1000 2000 4000 Threshold 62.5 125 250 500 1000 Hydrogen sulfide in red wine (μg/L) Sigma-aldrich product code: 742546 Suprathreshold 125 250 500 1000 2000 Threshold 62.5 125 250 500 1000 4-ethylphenol (EF); 4-ethylguaiacol (4-EG)(10:1) in red wine (μg/L)
4-EF and 4-EG; Sigma-aldrich products CAS Number: 123-07-9 and 2785-89-9, respectively
Suprathreshold 125 250 500 1000 2000
Threshold 31.25 62.5 125 250 500
2.4 Sensory methodology for ortho- and retronasal perceptions
2.4.1 Suprathreshold flavour intensity test
The determination of flavour suprathreshold intensities was performed using 5 glasses with different concentrations in random order across tasters, as illustrated in Figure 2.1. The orthonasal intensity was measured by placing the glass with a 45º angle without swirling and gently approaching the glass to the nose. When the odour started to be felt, the distance (cm) was measured with a ruler from the top of the glass to the nose. The further away from their nose the glass was, the greater the aromatic intensity of the wine. For the retronasal test, the tasters used a nose clip (Decathlon; made in Malaysia), put the wine in the mouth and chewed for 3 times and then spitted. The intensity value was drawn by a vertical mark in the Likert scale (Likert, 1932), used to scaling intensity responses, between “barely detectable” and “strongest imaginable” on the retronasal intensity sheet (Annex 1.).
In order to measure the individual sensitivity, the geometric mean (GM), the area-under-curve (AUC) and the regression slope were used. The first measure of individual sensitivity was obtained by calculating the geometric mean of the intensity scores
17 across all suprathreshold concentrations of the compounds (Webb et al., 2015). The individual sensitivity was also expressed by calculating the area under the curve, derived from plotting the measured intensity values as a function of suprathreshold concentrations of the compounds. This plot also allowed to determine the slope of the regression line obtained by fitting with method of minimum squares. The AUC and slope results were obtained with Software R and the GM mean was calculated with Microsoft Excel.
Figure 2.1. Suprathreshold intensity sample presentation scheme.
2.4.2 Detection and recognition thresholds test
The protocol ASTM E-679 (ASTM, 2004) used for determination of thresholds consists of an ascending forced-choice (3-AFC) triangular tests. Each triad contains one target sample (with the off-flavour) and two blank samples (with clean wine), as illustrated in Figure 2.2. For each concentration, tasters were asked first to identify the spiked sample by smelling the triad (orthonasal evaluation) and in second, by retronasal evaluation, to recognise the sample with the odd smell and give it a name or equivalent descriptor, completing the threshold sheet (Annex 2.). The test was run from the lowest concentration to the higher concentration, avoiding come back.
Individual best estimated thresholds (BETs) were calculated according the method ASTM E-679 (2004) and were determined as the geometric mean of the last incorrect response and the following detected and/or recognised concentration, when this was followed by at least 2 further correct responses (Chrysanthou et al., 2016). Each series of five responses were tabulated and a (-) symbol was used for an incorrect response, (+) for a correct one and (+) painted of grey for a correct recognition of the off-flavour compound. Group BETs were calculated as the geometric mean of the average of
18 individual BETs. Calculation of individual and group thresholds were carried out using the Microsoft Excel program and statistical analyses were evaluated by ANOVA at p<0.05 significance level.
19
3. R
ESULTS AND
D
ISCUSSION
3.1 Ortho- and retronasal detection and recognition thresholds
Professional panel
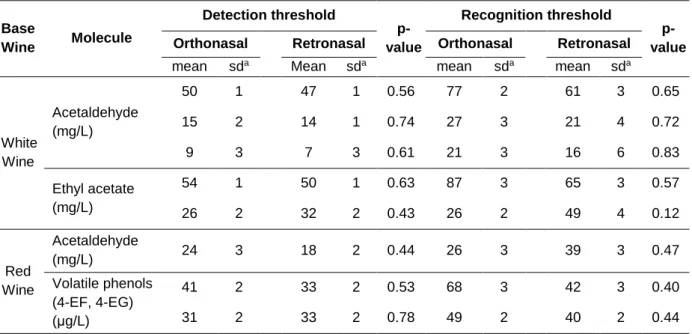
The results of the several trials to obtain detection and recognition thresholds for the professional panel are shown in Table 3.1. The first tests were done with acetaldehyde in white wine and were repeated 3 times in order to assess the increase in odour sensitivity with training. The lower thresholds were observed in the third experiment which was due not only to the increased taster sensitivity but also to the reduction in the lower range of tested concentrations. In fact, several tasters were able to detect the molecule in the lower concentrations of the first trials and by lowering further the concentration range it was possible to better ascertain their sensitivity (see Annex 3.). The same behaviour was also observed with ethyl acetate in white wines and volatile phenols in red wines (see Annex 4. and Annex 5., respectively). Interestingly, the retronasal route yielded lower nominal results but with no significant difference from the orthonasal pathways. Taking in consideration individual BET’s, some tasters showed increased sensitivity and ability to identify the flavour by the retronasal pathway (see Annex 3., Annex 4. and Annex 5.). The acetaldehyde thresholds were higher in red than in white wine after training but, as illustrated in Table 3.2, significant differences regarding the training (p<0.05) were only observed on detection threshold values. Regarding the matrix effect, no evident differences were observed between the thresholds evaluated in white and in red wine (p<0.05).
Table 3.1. Detection and recognition BET thresholds values for orthonasal and retronasal (professional panel). Base Wine Molecule Detection threshold p-value Recognition threshold p-value Orthonasal Retronasal Orthonasal Retronasal
mean sda Mean sda mean sda mean sda
White Wine Acetaldehyde (mg/L) 50 1 47 1 0.56 77 2 61 3 0.65 15 2 14 1 0.74 27 3 21 4 0.72 9 3 7 3 0.61 21 3 16 6 0.83 Ethyl acetate (mg/L) 54 1 50 1 0.63 87 3 65 3 0.57 26 2 32 2 0.43 26 2 49 4 0.12 Red Wine Acetaldehyde (mg/L) 24 3 18 2 0.44 26 3 39 3 0.47 Volatile phenols (4-EF, 4-EG) (μg/L) 41 2 33 2 0.53 68 3 42 3 0.40 31 2 33 2 0.78 49 2 40 2 0.44
a Standard deviation of log 10 BET.
20 The standard deviation of log BET may be interpreted as a measure of the variability between tasters (Table 3.1). Values were higher for the recognition than for the detection thresholds indicating that some individuals would require more training to correctly identify certain off-flavours.
Table 3.2. Significance of the difference (p-values) between (a) the first and third sensory sessions for acetaldehyde (in white wine) and between (b) threshold determination of
acetaldehyde in white and in red wine (professional panel).
Molecule Detection Recognition
Orthonasal Retronasal Orthonasal Retronasal Acetaldehyde (a) 0.0002 0.0001 0.054 0.12
(b) 0.09 0.1 0.9 0.5
Student panel
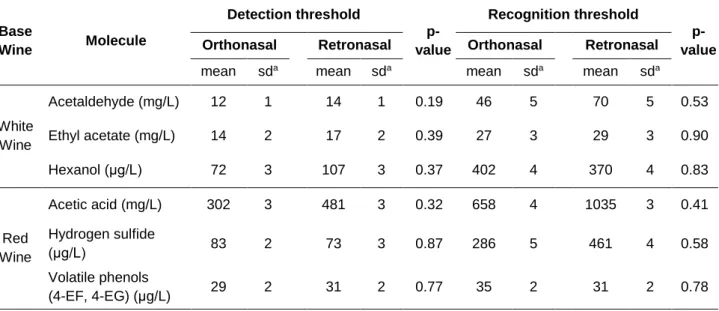
The threshold results of the student panel were obtained in only one session per molecule to assess the sensitivity without previous training (Table 3.3, and more detailed in Annex 6. to Annex 11.). The threshold values were equal by both routes (p>0.05) and nominal values were mostly higher for the retronasal route, contrarily to the professional panel. Interestingly, thresholds for the same molecules were similar between tasting panels, indicating that sensitivities were practically not affected by training.
Table 3.3. Detection and recognition BET thresholds for orthonasal and retronasal (student panel). Base Wine Molecule Detection threshold p-value Recognition threshold p-value Orthonasal Retronasal Orthonasal Retronasal
mean sda mean sda mean sda mean sda
White Wine Acetaldehyde (mg/L) 12 1 14 1 0.19 46 5 70 5 0.53 Ethyl acetate (mg/L) 14 2 17 2 0.39 27 3 29 3 0.90 Hexanol (μg/L) 72 3 107 3 0.37 402 4 370 4 0.83 Red Wine Acetic acid (mg/L) 302 3 481 3 0.32 658 4 1035 3 0.41 Hydrogen sulfide (μg/L) 83 2 73 3 0.87 286 5 461 4 0.58 Volatile phenols (4-EF, 4-EG) (μg/L) 29 2 31 2 0.77 35 2 31 2 0.78
a Standard deviation of log 10 BET.