Food Sci. Technol, Campinas, 38(2): 271-279, Apr.-June 2018 271/279 271 Food Science and Technology
DO:
D https://doi.org/10.1590/1678-457X.04717
OSSN 0101-2061 (Print) OSSN 1678-457X (Dnline)
1 Introduction
Aroma is the most important attribute influencing wine quality. Aroma can induce flavor sensations and can be used to identify compounds that might aid in the development of higher quality wines (Coetzee et al., 2015; Welke et al., 2012).
For consumers, the ability to recognize aroma in wine can be influenced by several factors, the most important of which are emotional state, training and physiology (Castilhos et al., 2012). On a competitive consumer market, the concept of quality is entirely based on satisfying consumer expectations, and opposing expectations compromise product success in the consumer market (Castilhos et al., 2012).
The production and consumption of wine made from American cultivars, especially Vitis labrusca and/or hybrid cultivars, known as “table wines” or “common wines,” is higher than those of wine made with Vitis vinifera. For example, in 2016, the Brazilian production of table wine was 247,457,542.0 million liters, 85.0% of which were table wines made from American cultivars (Biasoto et al., 2014; Castilhos et al., 2012; Mello, 2015). These wines are produced in high quantities because in several regions of Brazil, the weather conditions are unfavorable for V. vinifera grape cultivation, whereas American or hybrid
cultivars are highly adaptable to adverse weather conditions and show greater resistance to diseases (Rombaldi et al., 2004; Brasil, 2014).
The wine produced with American cultivars, especially using the Osabella and Oves are identified as having a grape aroma and a raspberry flavor (Rizzon et al., 2000; Rombaldi et al., 2004). Despite its aromatic characteristics, Osabella and Oves wines are one of the most popular in the country because of the habits of consumers and the health benefits of tannins and pigments (Rizzon et al., 2000; Rombaldi et al., 2004).
A review in the scientific literature found a few studies that investigated the profile of volatile and sensory compounds in red wine produced with Osabella and Oves cultivars. Biasoto et al. (2010, 2014) explored aspects related to the sensory quality and consumer preference of wine made from V. labrusca and its hybrids, including the Osabella and Oves cultivar; however, data on sensory quality and its relation to volatiles are lacking. Dur group has carried out studies on the physicochemical composition (Arcanjo et al., 2017) and the extraction process of the volatile compounds by HS-SPME-GC/MS technique (Arcanjo et al., 2015) of red wine produced with V. labrusca
Red wine produced from the Isabella and Ives cultivar (Vitis Labrusca): profile of
volatiles and aroma descriptors
Narciza Maria de Dliveira ARCANJD1*, Maria Erica da Silva DLOVEORA1, Íris Braz da Silva ARAÚJD1,
Flávio Luís Honorato da SOLVA1, Marta Suely MADRUGA1
a
Received 01 Feb., 2017 Accepted 28 Nov., 2017
1 Graduate Program in Food Science and Technology, Center of Technology, Universidade Federal da Paraíba – UFPB, João Pessoa, PB, Brazil
*Corresponding author: [email protected].
Abstract
Considering the potential consumption and economic the importance that Osabella and Oves wines represent in the Brazilian consumer market as well as the scarcity of scientific data examining their quality, the objective of this study was to investigate the sensory quality and the volatiles profile of these wines. The volatile compounds were extracted by headspace solid-phase microextraction (HS-SPME) and a total of 54 compounds were detected in red wine samples including esters (23), terpenes (12), alcohols (10), aldehydes and ketones (5) and amines (1) as well as 3 compounds belonging to other classes. Osabella and Oves red wines were sensorially characterized by 14 descriptors, through quantitative descriptive analysis (QDA). The PCAs fruity descriptors were the primary contributors to the aroma profile of the analyzed wines due to the presence of ethyl acetate and esters, especially in the wine coded as QM, which exhibited the highest variety of compounds. The differences observed in the principal components analysis, might have been influenced by the grape composition of each wine. Although the wines were from the same region, each came from a different winery and was subject to unique production processes.
Keywords: aroma enology; extraction; fermented drink; mass spectrometry.
Food Sci. Technol, Campinas, 38(2): 271-279, Apr.-June 2018 272 272/279
Volatiles and aromatic compouds of red winde
cultivars. Thus, considering the potential consumption and economic importance that Osabella and Oves wines represent in the Brazilian consumer market as well as the scarcity of scientific data examining its quality, the objective of this study was to investigate the sensory quality and the volatiles profile of wine produced from Osabella and Oves cultivars, the most prolific V. labrusca cultivar in traditional wineries from the South Region of Brazil.
2 Materials and methods
2.1 Wine samples
The aromatic quality of three dry red Osabella and Oves cultivars wines produced in traditional wineries in Southern Brazil was evaluated (Table 1). The data were obtained from five different bottles of wines from the same lot and the experiments were performed in triplicate. The wines were stored at 10 °C prior to analysis.
2.2 Aroma descriptors analysis of Isabella and Ives red wine
The aroma profiles were generated by a trained panel of 8 judges, aged between 20 and 40 years who were undergraduate, graduate students and employees of the Federal University of Paraíba (Universidade Federal da Paraíba), Brazil, and had experience in wine consumption using quantitative descriptive analysis (Meilgaard et al., 1999; Stone et al., 1974; Stone and Sidel, 2004). The judges were initially tested based on: (i) the ability to express proportionality using the scales test, (ii) the sensitivity to recognize and perceive differences in aroma between the samples, and (iii) the ability to identify 32 odors present in the Wine Aroma Wheel (Noble et al., 1987).
Descriptive terminology development and team training
The judges determined the descriptive terminology for the red wines using the Repertory Grid Keily’s Method described by Moskowitz (1983). Red wine samples were grouped into pairs, and the judges were asked to evaluate the similarities and differences regarding the aroma attributes. The analysis was performed individually first, then with the help of a leader, and the terms were discussed using descriptive synonyms and antonyms. Subsequently, the terms were grouped and/or eliminated by consensus, and those that best described the similarities and differences between the wines were selected. This process generated 14 aroma descriptors. The final descriptive team was selected as the flavors who exhibited good discriminative power (pFsample≤0.05), good reproducibility in judgment (pFreplicates≥0.05)
and consensus with the team for at least 80% of the descriptors on the sheet generated by team consensus (Damásio, 1991).
Final evaluation of Isabella and Ives red wine
The dry red wines (30 mL) were presented in tulip glasses covered with a watch glass and assigned random three-digit numbers. The wines were kept at 20 ± 2 °C and were evaluated in individual cabins with white light. Data were collected using the descriptive sheet generated by panel consensus, which contained 9-cm non-structured scales with terms expressing intensity, from “none” at one end of the scale to “intense” at the other end. Each judge evaluated each wine in two sessions, with three triplicates per session, totaling six replicates.
2.3 Extraction and chromatographic analyses to identify volatile compounds
The volatile compounds were extracted by headspace solid-phase microextraction (HS-SPME) (Arcanjo et al., 2015). The fiber used was polydimethylsiloxane–carboxen–divinylbenzene (PDMS/CAR/DVB) (Supelco, Bellefonte, PA, USA). For this purpose, 30 mL of red wine were added to a 100-mL screw cap glass flask with a septum. The volatile compounds were extracted by placing the flask in a 30 °C water bath with internal magnetic stirring. The sample reached equilibrium in 15 minutes and was then exposed to the fiber for 35 minutes.
Volatile compounds of red wine were separated, a Varian Saturn 2000R 3800 gas chromatograph (GC) coupled to a Varian Saturn 2000R 2000 mass detector and a VF-5MS column (60 m × 0.25 mm × 0.25 μm) was used. The carrier gas was helium at a 1.0 mL minute-1 flow rate. The samples were injected by placing the SPME fiber at the entrance of the GC at 250 °C and the injection mode were split (1:10) with a desorption time of 10 minutes. The initial oven temperature was 35 °C, which was maintained for 5 minutes, increased to 240 °C at 3 °C per minute, and then maintained at 240 °C for 5 minutes. The mass spectrometer was operated in the electron impact mode with a source temperature of 200 °C, an ionization energy of 70 V and scan variation of m/z 29 to m/z 400 at 3.33 scans/s.
The mass spectra of unknown volatile compounds were also compared with standard compounds using the GC/MS library spectra bank, the NOST/EPA/NOH Mass Spectral Database (Version 1.7) and existing databases in the literature. The identification was aided by comparing the linear retention indices (LRO) obtained with a standard homologous n-alkane solution of the 0,04 mg.mL-1 (C7-C30) injected to obtain the linear retention times of each compound.
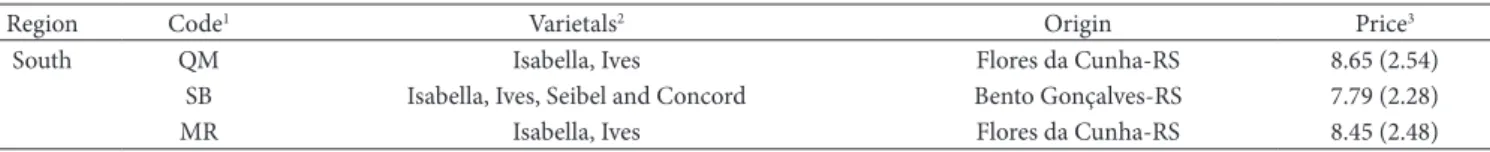
Table 1. Characterization of the dry wine samples produced in 2012, the origin of production and the price per bottle.
Region Code1 Varietals2 Drigin Price3
South QM Osabella, Oves Flores da Cunha-RS 8.65 (2.54)
SB Osabella, Oves, Seibel and Concord Bento Gonçalves-RS 7.79 (2.28)
MR Osabella, Oves Flores da Cunha-RS 8.45 (2.48)
Arcanjo et al.
Food Sci. Technol, Campinas, 38(2): 271-279, Apr.-June 2018 273/279 273
2.4 Quantification of higher alcohols, acetaldehyde and ethyl acetate by GC
The volatile compounds acetaldehyde, ethyl acetate, methanol, 1-propanol, 2-methyl-1-propanol, 2-methyl-1-butanol and 3-methyl-1-butanol (Sigma-Aldrich, Brazil, 2014) were the secondary compounds of alcoholic fermentation and quantified by gas chromatography according to methodology proposed by the Brazilian Ministry of Agriculture, Livestock and Food Supply (Ministério da Agricultura, Pecuária e Abastecimento – MAPA) (Brasil, 2005; Rizzon, 2010). A gas chromatograph (VAROAN 430-GC, California, USA) coupled to a flame ionization detector (FOD) with a fused silica capillary column (CP WAX 52 CB, VAROAN, California, USA) measuring 60 m x 0.25 mm x 0.25 µm was used. Helium was used as the carrier gas (flow rate of 1 mL minute-1). The initial oven temperature was 50 °C for 5 minutes and was programmed to reach 170 °C by increasing 6 °C/min, then increased to 240 °C at a rate of 30 °C/min and remained at this temperature for 2 minutes. The samples (1 µL) were injected after adding 10% by volume of an internal standard solution (4-methyl-2-pentanol at 1 g L-1) at a split of 1:100. The chromatograms were recorded in the Galaxie Chromatography Data System software.
The concentration of each substance in the wines was obtained using Equation 1:
( ) ( )
* * / *
C=c h I H i (1)
in which C is the concentration of the substance in the wine in mg L-1, c is the concentration of the substance in the standard solution, h is the peak height of the substance in the wine, H is the peak height of the substance in the standard solution, O is the peak height of the internal standard in the standard solution and i is the peak height of the internal standard of the substance in the wine.
2.5 Statistical Analysis
The results were analyzed using analysis of variance (ANDVA) and Tukey’s mean test at 5% significance using Statistica 5.0 (StatSoft Onc., 2001). Data from the sensory analysis and volatiles profile were also evaluated by principal component analysis (PCA) using XLSTAT version 5.03 (Addinsoft, ESPAÑA, 2014), and a Pearson’s linear correlation analysis was performed with data from the sensory analysis using SPSS (OBM SPSS Statistics, version 24.0)
3 Results and discussion 3.1 Sensory analysis
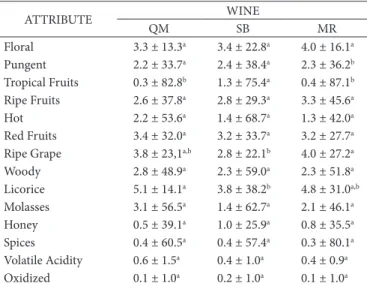
The wines produced with Osabella and Oves cultivars were characterized and described according to fourteen sensory attributes (Table 2): floral, tropical fruits, ripe fruits, hot, red fruits, ripe grape, woody, licorice, honey, spices, molasses are considered positive attributes and pungent, volatile acidity and oxidized are negatives attributes.
The wines produced with Osabella and Oves cultivars had a very similar aroma sensory profile as perceived by the judging team. Significant differences between the wines (p<0.05) were detected only in four aroma descriptors: pungent, tropical fruits, ripe grape
and licorice. According Jofré et al. (2006), Verzera et al. (2008) and Baiano et al. (2017) the wine aroma is influenced by many factors: the vineyard ecosystem (soil, microclimate and macroclimate, canopy) and its management are important in definition of grapes and, consequently, of wines characteristics. Thus, even without knowing the production process of the wines analyzed, these differences were perceived between the SB, QM and MR wines, which might be a result of each wine’s varietal composition and other factors associated with the wine production process.
The fruity aromas received higher intensity scores in the sensory evaluation of Osabella and Oves red wines, which was also observed by Biasoto et al. (2014), in which all of the analyzed wines containing the V. labrusca grape and its hybrids, especially wines containing the Oves and Osabella and Oves cultivars, exhibited greater (p≤0.05) scores for descriptors such as “grape juice,” “grape” and “sweet.” Another study has also reported that
V. labrusca varietals such as Oves, Concord, Osabella and Niagara, among others, as containing methyl anthranilate, an ester of phenol derivatives that confers a fruity and/or artificial grape aroma to wine (Reynolds et al., 2005).
3.2 Determination of volatile compounds
Determination of volatile compounds using the HS-SPME-GC/MS technique
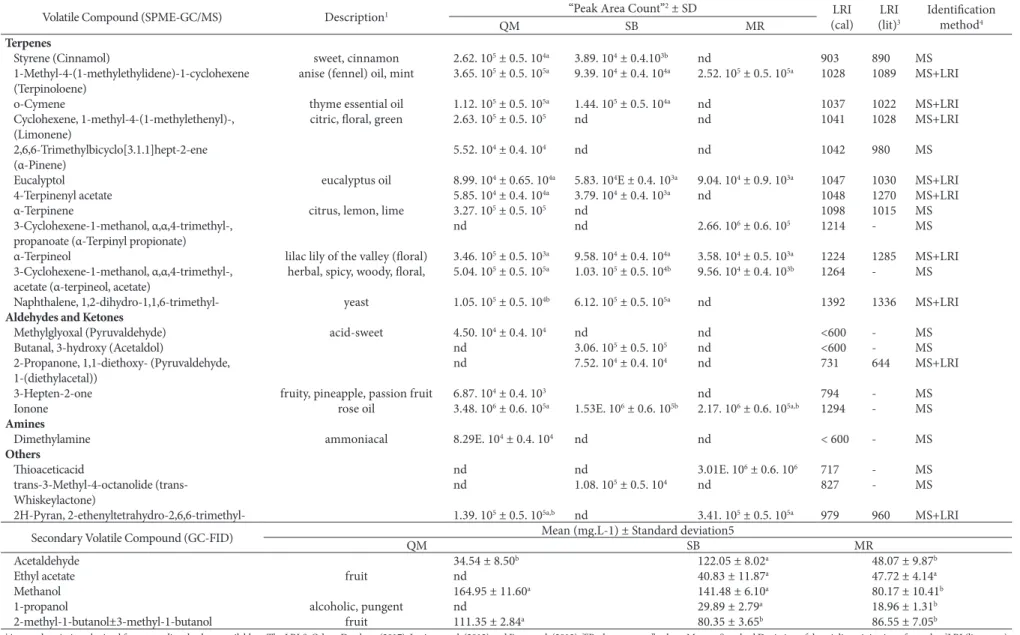
The volatile compounds in Osabella and Oves cultivars wines identified by SPME-CG-MS are shown in Table 3. A total of 54 volatile compounds were identified, including esters (23), which were the most numerous, followed by terpenes, (12), alcohols (10), aldehydes and ketones (5), amines (1), and three (3) volatile compounds that were identified as belonging to other classes. Some volatiles that were detected with larger peak values in red Osabella and Oves cultivars wines include 1-propanol, phenylethyl alcohol, butyric acid, 2-methylbutyl ester, ethyl hexanoate, diethyl succinate, ethyl decanoate, α-terpineol and ionone.
Table 2. Mean scores provided by the sensory team for the aroma
attributes characterizing Osabella and Oves grape wines.
ATTROBUTE WONE
QM SB MR
Floral 3.3 ± 13.3a 3.4 ± 22.8a 4.0 ± 16.1a
Pungent 2.2 ± 33.7a 2.4 ± 38.4a 2.3 ± 36.2b
Tropical Fruits 0.3 ± 82.8b 1.3 ± 75.4a 0.4 ± 87.1b
Ripe Fruits 2.6 ± 37.8a 2.8 ± 29.3a 3.3 ± 45.6a
Hot 2.2 ± 53.6a 1.4 ± 68.7a 1.3 ± 42.0a
Red Fruits 3.4 ± 32.0a 3.2 ± 33.7a 3.2 ± 27.7a
Ripe Grape 3.8 ± 23,1a,b 2.8 ± 22.1b 4.0 ± 27.2a
Woody 2.8 ± 48.9a 2.3 ± 59.0a 2.3 ± 51.8a
Licorice 5.1 ± 14.1a 3.8 ± 38.2b 4.8 ± 31.0a,b
Molasses 3.1 ± 56.5a 1.4 ± 62.7a 2.1 ± 46.1a
Honey 0.5 ± 39.1a 1.0 ± 25.9a 0.8 ± 35.5a
Spices 0.4 ± 60.5a 0.4 ± 57.4a 0.3 ± 80.1a
Volatile Acidity 0.6 ± 1.5a 0.4 ± 1.0a 0.4 ± 0.9a
Dxidized 0.1 ± 1.0a 0.2 ± 1.0a 0.1 ± 1.0a
Fo
o
d S
ci
. T
ec
hn
ol, C
am
p
in
as, 38(2): 271-279, A
p
r.-J
un
e 2018
274
274/279
V
ol
at
iles a
n
d a
ro
m
at
ic co
m
p
oud
s o
f r
ed w
in
de
Table 3. Volatile compounds identified by GC/MS and secondary volatile compounds quantified (mg L-1) in red wine produced from the Osabella and Oves cultivar.
Volatile Compound (SPME-GC/MS) Description1 “Peak Area Count”
2 ± SD LRO
(cal) LRO (lit)3
Odentification method4
QM SB MR
Alcohol
1-propanol alcoholic, pungent 8.89. 106 ± 0.6.106a 2.47. 106 ± 0.6. 106b 3.94. 106 ± 0.6. 105b <600 548 MS
7-Dcten-2-ol, 2,6-dimethyl- 6.69.106 ± 0.4.106 nd nd <600 - MS
1-Butanol, 2-methyl 3.60. 106 ± 0.6. 106 nd nd 751 728 MS+LRO
1-Butanol (Butyl alcohol) alcoholic 4.96. 105 ± 0.5. 105 nd nd 778 665 MS+LRO
2,3-Butanediol (Dimethylethylene glycol) chemical 7.03. 104 ± 0.4. 104 nd nd 817 743 MS+LRO
1-hexanol fragrant, floral nd 4.49. 104 ± 0.4. 104 nd 881 861 MS
3-Nonen-2-ol 6.18. 104 ± 0.4. 104 nd nd 929 - MS
1,6-Dctadien-3-ol, 3,7-dimethyl- (Linalool) citric, floral, floral citrus fragrant 1.39. 105 ± 0.5. 103b nd 8.67. 105 ± 0.5. 105a 1110 1091 MS+LRO
Phenylethyl Alcohol woody (woody-rose-honey), floral 3.63. 106 ± 0.6. 106a 2.31. 106 ± 0.6. 105a 4.22. 106 ± 0.6. 105a 1137 1098 MS+LRO
1-Nonanol citronella oil, citrus 7.73. 105 ± 0.5. 105a nd 5.31. 105 ± 0.5. 104a 1186 1163 MS+LRO
Esters
Propanoic acid, ethyl ester (Ethyl propanoate) sweet, fruity 2.84. 103 ± 0.4. 103b 3.59. 104 ± 0.4. 103b 9.65. 105 ± 0.5. 105a 718 688 MR+LRO
Butanoic acid, 2-methylbutyl ester fruity 7.81. 106 ± 0.6. 106a nd nd 749 1044 MS
Propanoic acid, 2-methyl-, ethyl ester (Osobutyric acid, ethyl ester)
fruity, apple, banana, pineapple 3.89. 105 ± 0.5. 105a 1.78. 105 ± 0.5. 103a 1.81. 105 ± 0.5. 104a 764 745 MS+LRO
1-Pentanol, 2-methyl-, acetate nd 4.34. 105 ± 8.50 nd 779 984 MS
Butanoic acid, ethyl ester (Ethyl butyrate) banana, pineapple 3.06. 105 ± 0.5. 105a 1.04. 105 ± 0.5. 104a 2.16. 105 ± 0.5. 104a 801 787 MS+LRO
2-Butenoic acid, ethyl ester, 6.22. 104 ± 0.4. 104b 3.88. 104 ± 04. 104b 1.89. 105 ± 0.5. 104a 854 827 MS+LRO
Butanoic acid, 2-methyl-, ethyl ester fruity, sweet, apple, banana, grape 2.68. 104 ± 0.4. 104b 7.65. 104 ± 0.4. 103a 6.11. 104 ± 0.4. 103a,b 855 839 MS+LRO
Butanoic acid, 3-methyl-, ethyl ester (Ethyl isovalerate)
herbaceous, pineapple, grape, fruity, sweet
5.39. 105 ± 0.5. 105a 1.71. 105 ± 0.5. 104b 1.08. 105 ± 0.5. 104b 859 840 MS+LRO
1-Butanol, 3-methyl-, acetate (Osoamyl acetate) banana 6.57. 105 ± 0.5. 105a 3.54. 105 ± 0.5. 104b 2.60. 105 ± 0.5. 104b 883 861 MS+LRO
1-Butanol, 2-methyl-, acetate 1.34. 105 ± 0.5. 104a 7.14. 104 ± 0.4. 102a,b nd 885 868 MS+LRO
Hexanoic acid, ethyl ester (Ethyl hexanoate) fruity 4.81. 106 ± 0.6. 106a 2.35. 106 ± 0.6. 105a 2.52. 106 ± 0.6. 106a 1005 985 MS+LRO
Hex-4-enoic acid, ethyl ester 3.34. 105 ± 0.5. 105 nd nd 1008 - MS
2-Hexenoic acid, ethyl ester 1.46. 105 ± 0.5. 104a 7.47. 104 ± 0.4. 103b nd 1055 1040 MS
Geranylvinyl ether herbaceous, floral, sweet anise nd 8.41. 104 ± 0.4. 103 nd 1070 1082 MS+LRO
Propanoic acid, 2-hydroxy-, 3-methylbutyl ester (Osoamyl lactate)
lactic, raspberry nd 6.54. 104 ± 0.4. 104 nd 1082 1084 MS+LRO
Heptanoic acid, ethyl ester grape, fruity 3.39. 105 ± 0.5. 105a 6.66. 104 ± 0.4. 104a 1.24. 105 ± 0.5. 104a 1105 1111 MS+LRO
Butanedioic acid, diethyl ester (Succinic acid, diethyl ester)
fruity, apple, strawberry 4.37. 106 ± 0.6. 106a 1.54. 106 ± 0.6. 105a 3.56. 106 ± 0.6. 105a 1170 1149 MS+LRO
Dctanoic acid, ethyl ester (Ethyl caprylate) apple, vinous 1.38. 105 ± 0.8. 104a 1.44. 105 ± 0.5. 104a nd 1180 1224 MS+LRO
Benzeneacetic acid, ethyl ester nd 6.60. 104 ± 0.4. 104 nd 1270 - MS
Decanoic acid, methyl ester 1.45. 105 ± 0.5. 104 nd nd 1333 1382 MS+LRO
Decanoic acid, ethyl ester (Ethyl decanoate) fruit, oily, floral 7.46. 106 ± 0.6. 106a 1.69. 106 ± 0.6. 106b 3.09. 106 ± 0.6. 106b 1398 1583 MS+LRO
Dodecanoic acid, ethyl ester (Ethyl dodecanoate) fruit, oily, floral 1.36. 105 ± 0.5. 104a nd 1.40. 105 ± 0.5. 104a 1590 1591 MS
Hexadecanoic acid, ethyl ester (Ethyl hexadecanoate)
nd nd 5.77. 104 ± 0.4. 104b 1861 1990 MS
1Aroma description obtained from an online database available at The LRO & Ddour Database (2017), Jewison et al. (2012) and Jiang et al. (2013); 2“Peak area count” values, Mean ± Standard Deviation of the triplicate injection of samples; 3LRO (literature)
from Jiang et al. (2013) and Weldegeris et al. (2011); 4MS ± LRO, mass spectrum and LRO according to a compound run in the VF-5 MS column, and the MS mass spectrum according to the reference spectrum in the NOST/EPA/NOH database and LRO that
agreed with the literature. nd: Compound not identified; 5Mean ± Standard Deviation of secondary volatile compounds quantified using the straight-line equation obtained from the injection of a standard curve of compounds into a gas chromatographer
A
rc
an
jo
et
al.
Fo
o
d S
ci
. T
ec
hn
ol, C
am
p
in
as, 38(2): 271-279, A
p
r.-J
un
e 2018
275/279
275
Volatile Compound (SPME-GC/MS) Description1 “Peak Area Count”
2 ± SD LRO
(cal) LRO (lit)3
Odentification method4
QM SB MR
Terpenes
Styrene (Cinnamol) sweet, cinnamon 2.62. 105 ± 0.5. 104a 3.89. 104 ± 0.4.103b nd 903 890 MS
1-Methyl-4-(1-methylethylidene)-1-cyclohexene (Terpinoloene)
anise (fennel) oil, mint 3.65. 105 ± 0.5. 105a 9.39. 104 ± 0.4. 104a 2.52. 105 ± 0.5. 105a 1028 1089 MS+LRO
o-Cymene thyme essential oil 1.12. 105 ± 0.5. 105a 1.44. 105 ± 0.5. 104a nd 1037 1022 MS+LRO
Cyclohexene, 1-methyl-4-(1-methylethenyl)-, (Limonene)
citric, floral, green 2.63. 105 ± 0.5. 105 nd nd 1041 1028 MS+LRO
2,6,6-Trimethylbicyclo[3.1.1]hept-2-ene (α-Pinene)
5.52. 104 ± 0.4. 104 nd nd 1042 980 MS
Eucalyptol eucalyptus oil 8.99. 104 ± 0.65. 104a 5.83. 104E ± 0.4. 103a 9.04. 104 ± 0.9. 103a 1047 1030 MS+LRO
4-Terpinenyl acetate 5.85. 104 ± 0.4. 104a 3.79. 104 ± 0.4. 103a nd 1048 1270 MS+LRO
α-Terpinene citrus, lemon, lime 3.27. 105 ± 0.5. 105 nd 1098 1015 MS
3-Cyclohexene-1-methanol, α,α,4-trimethyl-, propanoate (α-Terpinyl propionate)
nd nd 2.66. 106 ± 0.6. 105 1214 - MS
α-Terpineol lilac lily of the valley (floral) 3.46. 105 ± 0.5. 103a 9.58. 104 ± 0.4. 104a 3.58. 104 ± 0.5. 103a 1224 1285 MS+LRO
3-Cyclohexene-1-methanol, α,α,4-trimethyl-, acetate (α-terpineol, acetate)
herbal, spicy, woody, floral, 5.04. 105 ± 0.5. 105a 1.03. 105 ± 0.5. 104b 9.56. 104 ± 0.4. 103b 1264 - MS
Naphthalene, 1,2-dihydro-1,1,6-trimethyl- yeast 1.05. 105 ± 0.5. 104b 6.12. 105 ± 0.5. 105a nd 1392 1336 MS+LRO
Aldehydes and Ketones
Methylglyoxal (Pyruvaldehyde) acid-sweet 4.50. 104 ± 0.4. 104 nd nd <600 - MS
Butanal, 3-hydroxy (Acetaldol) nd 3.06. 105 ± 0.5. 105 nd <600 - MS
2-Propanone, 1,1-diethoxy- (Pyruvaldehyde, 1-(diethylacetal))
nd 7.52. 104 ± 0.4. 104 nd 731 644 MS+LRO
3-Hepten-2-one fruity, pineapple, passion fruit 6.87. 104 ± 0.4. 103 nd 794 - MS
Oonone rose oil 3.48. 106 ± 0.6. 105a 1.53E. 106 ± 0.6. 105b 2.17. 106 ± 0.6. 105a,b 1294 - MS
Amines
Dimethylamine ammoniacal 8.29E. 104 ± 0.4. 104 nd nd < 600 - MS
Others
Thioaceticacid nd nd 3.01E. 106 ± 0.6. 106 717 - MS
trans-3-Methyl-4-octanolide (trans-Whiskeylactone)
nd 1.08. 105 ± 0.5. 104 nd 827 - MS
2H-Pyran, 2-ethenyltetrahydro-2,6,6-trimethyl- 1.39. 105 ± 0.5. 105a,b nd 3.41. 105 ± 0.5. 105a 979 960 MS+LRO
Secondary Volatile Compound (GC-FOD) QM Mean (mg.L-1) ± Standard deviation5SB MR
Acetaldehyde 34.54 ± 8.50b 122.05 ± 8.02a 48.07 ± 9.87b
Ethyl acetate fruit nd 40.83 ± 11.87a 47.72 ± 4.14a
Methanol 164.95 ± 11.60a 141.48 ± 6.10a 80.17 ± 10.41b
1-propanol alcoholic, pungent nd 29.89 ± 2.79a 18.96 ± 1.31b
2-methyl-1-butanol±3-methyl-1-butanol fruit 111.35 ± 2.84a 80.35 ± 3.65b 86.55 ± 7.05b
1Aroma description obtained from an online database available at The LRO & Ddour Database (2017), Jewison et al. (2012) and Jiang et al. (2013); 2“Peak area count” values, Mean ± Standard Deviation of the triplicate injection of samples; 3LRO (literature)
from Jiang et al. (2013) and Weldegeris et al. (2011); 4MS ± LRO, mass spectrum and LRO according to a compound run in the VF-5 MS column, and the MS mass spectrum according to the reference spectrum in the NOST/EPA/NOH database and LRO that
agreed with the literature. nd: Compound not identified; 5Mean ± Standard Deviation of secondary volatile compounds quantified using the straight-line equation obtained from the injection of a standard curve of compounds into a gas chromatographer
with flame ionization detector. a-b Different letters in the column denote statistically difference between means from attributes (p < 0.05). QM (Osabella and Oves), SB (Osabella, Oves, Seibel and Concord wine), MR (Osabella and Oves wine).
Food Sci. Technol, Campinas, 38(2): 271-279, Apr.-June 2018 276 276/279
Volatiles and aromatic compouds of red winde
Esters. The esters propanoic acid, dimethyl ester, ethyl butyrate, ethyl hexanoate, diethyl succinate and ethyl octanoate were identified in all of the wines at high “peak area count” values. Butyric acid (2-methylbutyl ester) was only detected in the QM wine. These compounds contribute to a wine’s fruity aroma and result from the reaction of acetyl coenzyme A (acetyl-CoA) with higher alcohols generated from amino acid or carbohydrate degradation (Welke et al., 2012). Esters are associated with fruity descriptors: butyric acid, 2-methylbutyl ester and ethyl hexanoate with apple aroma, propanoic acid, dimethyl ester and ethyl butyrate with pineapple aroma, and ethyl succinate with apple and strawberry aromas (Jiang et al., 2013). Tao et al. (2008) detected isoamyl acetate, isoamyl lactate and octanoate acetate in red wine made from vinifera cultivars and found aroma notes related to banana, raspberry and fruity aroma, respectively, and these compounds had a positive contribution to wine quality. This study detected isoamyl acetate in all of the wines and isoamyl lactate in only the SB wine.
Terpenes. Terpene compounds can be found in their free or conjugated form in cultivars and are released by endogenous enzyme activity present in grape skin during the crushing process, hence their presence in grape must. Terpenes are the secondary plant constituents that are biologically synthesized by the cytosolic mevalonic acid pathway from three acetyl-CoA molecules or by the pyruvate and glyceraldehyde 3-phosphate pathway (Robinson et al., 2014). Eucalyptol, α-terpineol and α-terpineol, acetate were found in all three wines and contribute to the eucalyptus essential oil and floral aromas, respectively. The highest number of terpene compounds was observed in the QM wine, and α-terpinene, which is associated with the citrus, lemon-lime aroma, was only found in this wine. Weldegeris et al. (2011) reported that the terpene composition of wine varies according to production region, grape composition and variations in fermentation conditions. These authors also detected terpinolene, limonene, 4-terpineol acetate, o-cymene, eucalyptol, α-terpinene and α-terpineol.
Alcohols. Among the ten alcohols identified, the QM wine exhibited the greatest variability in compounds. Alcohols are compounds that are synthesized from the secondary products of yeast metabolism via two mechanisms. They can be made in yeast through the anaerobic pathway from glucose or the catabolic pathway from the corresponding amino acid (valine, leucine, phenylalanine and isoleucine), or they can be synthesized in cultivars during pre-fermentative processes including crushing, pressing and skin contact (Fariña et al., 2014). Dnly 1-propanol and phenylethyl alcohols were observed to have high “peak area counts” in the three wines. These two alcohols are associated with the alcoholic and the floral aroma, respectively. Another alcohol, 1-hexanol, was only detected in the SB wine and is associated with a wine’s herbal aroma (Rocha et al., 2004). On the QM and MR wines, linalool was detected, which contributes to the floral aroma (Jiang et al., 2013). Ot is of note that this volatile varied significantly among the analyzed samples, suggesting that although the wines were produced with the same cultivars, other production factors, such as the time of grape harvesting and the technological processes used, might influence the aroma of the final product.
Aldehydes and ketones. According to Weldegeris et al. (2011), aldehydes and ketones are highly volatile components in alcoholic beverages and result from the direct oxidation of the corresponding alcohols and fatty acids, respectively. On this study, only 5 compounds from these classes were identified, and they varied among the studied wines. The compound 3-heptene-2-one was only found in the QM wine and confers a fruity aroma. Oonone was detected in all of the analyzed wines and confers a rose oil, violet aroma.
Amines. Dnly one amine compound was detected in the QM wine – dimethylamine, which contributes to the ammoniacal aroma of wines. Manetta et al. (2016) detected an amine compound in wines and suggested it might have been influenced by the winemaking process. At high concentrations, amines may be responsible for undesirable toxicological effects as headache, respiratory distress, heart palpitation, hypotension, hypertension and nausea.
Other compounds. The presence of thioacetic acid was detected in the MR wine (Perestrelo et al., 2006). On addition, a lactone was observed in the SB wine, and a pyran compound was found in the QM and MR wines.
Previous studies have determined the importance of furaneol to Osabella wines, as it has been described as a strawberry-like aroma. Dther volatiles compounds such as: beta-damascenone, methyl anthranilate and 2-aminoacetophenone have been reported as important contribute to aroma in red wine; however, these compounds were not identified in our red wines (Nelson et al., 1977; Pinho and Bertrand, 1995).
Higher alcohols, acetaldehyde and ethyl acetate concentrations
Significant differences were observed in the acetaldehyde, methanol and higher alcohol concentrations between the red wines (Table 3). Analysis revealed that the acetaldehyde content, which can negatively affect the aroma quality of wines because of its association with microbial ethanol oxidation under aerobic conditions, was greater in the SB wine (122.05 mg L-1) compared to the other two wines. Aldehydes affect the sensory characteristics of beverages and might be an indicator of deterioration (Azevêdo et al., 2007).
Arcanjo et al.
Food Sci. Technol, Campinas, 38(2): 271-279, Apr.-June 2018 277/279 277
can significantly influence the sensory properties of the wine, especially regarding the aroma and fruity descriptions correlation. The concentration of higher alcohols is related to fermentation conditions such as temperature, oxygenation, and nitrogen and SD2 content. Similar results regarding methanol, acetaldehyde and higher alcohols were reported by Rizzon et al. (2000), who evaluated the agronomic and enological characteristics of the Osabella and Oves grape for producing common red wine.
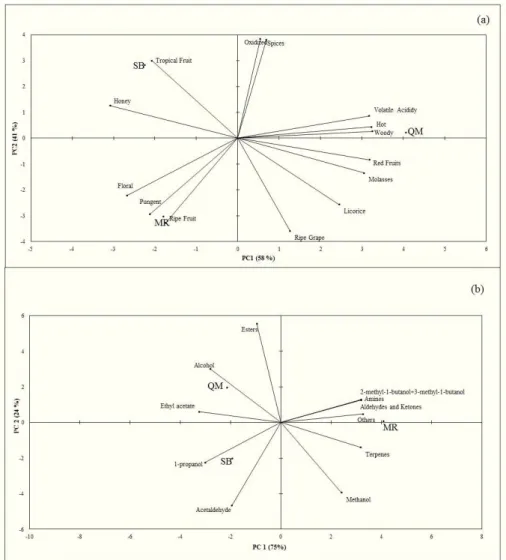
3.3 Relationship between volatile compounds identified by SPME-CG-MS and aromatic compounds
To determine whether sensory differences resulting from grape composition and production methods are related to specific chemical compounds or groups of compounds, principal component analysis (PCA) was performed. To analyze the volatile compounds profile, the sum of the chemical classes was expressed as “peak area count” values. Dverall, the PCA results suggested that the aroma descriptors and volatile compounds discriminated between the analyzed wines (Figure 1).
On the quantitative descriptive analysis of the PCA graph (Figure 1a), the aroma descriptors are indicated by vectors, and the wines are represented by squares. On this type of analysis, the higher the decomposition of the vector along the component axes, the greater its importance in evaluating the differences and similarities among the wines. Ot was observed that the Principal Component (PC1) accounted for 58% of the variability among wines, and some variability was explained by the Second Component (41%).
PCA showed that the wines exhibited different characteristics. The SB wine was mainly characterized by the descriptors tropical fruits and honey. The MR wine exhibited a greater floral, ripe fruit and pungent aroma intensity, and the QM wine, located on the right side of Figure 1a, was characterized by the majority of descriptors: spices, hot, volatile acidity, licorice, ripe grape and red fruits.
On Figure 1b, the chemical compound classes and higher alcohols, acetaldehyde, methanol and ethyl acetate are represented by vectors that characterize the wines close to them, and the
Figure 1. (a) Projection of aroma descriptors and samples of red wine produced with Osabella and Oves cultivars on the first two principal
Food Sci. Technol, Campinas, 38(2): 271-279, Apr.-June 2018 278 278/279
Volatiles and aromatic compouds of red winde
Arcanjo, N. M. D., Neri-Numa, O. A., Bezerra, T. K. A., Silva, F. L. H., Pastore, G. M., & Madruga, M. S. (2017). Quality evaluation of red wines produced from the Osabella and Oves cultivar (Vitis labrusca): physicochemical parameters, phenolic composition and antioxidant activity. Food Science and Technology (Campinas), 37(2), 184-192. http://dx.doi.org/10.1590/1678-457x.16516.
Azevêdo, L. C., Reis, M. M., Silva, L. A., & Andrade, J. B. (2007). Efeito da presença e concentração de compostos carbonílicos na qualidade de vinhos. Quimica Nova, 30(8), 1968-1975. http://dx.doi.org/10.1590/ S0100-40422007000800032.
Baiano, A., Mentana, A., Quinto, M., Centoze, D., Previtali, M. S., Varva, G., Del Nobile, M. A., & Palma, L. (2017). Volatile composition and sensory profile of wines obtained from partially defoliated vines: the case of Nero di Troia wine. European Food Research and Technology, 243(2), 247-261. http://dx.doi.org/10.1007/s00217-016-2740-y. Biasoto, A. C. T., Catharino, R. R., Sanvido, G. B., Eberlin, M. N., & Silva,
M. A. A. P. (2010). Flavour characterization of red wines by descriptive analysis and ESO mass spectrometry. Food Quality and Preference, 21(7), 755-762. http://dx.doi.org/10.1016/j.foodqual.2010.07.005. Biasoto, A. C. T., Maria, F. No., Marques, E. J. N., & Silva, M. A. A. P.
(2014). Acceptability and preference drivers of red wines produced from Vitis labrusca and hybrid cultivars. Food Research International, 62, 56-466. http://dx.doi.org/10.1016/j.foodres.2014.03.052. Brasil. Ministério da Agricultura Onstrução. (2005). Normativa Nº 24
de 28 de setembro de 2005. Dispõe sobre os métodos analíticos de bebidas e vinagre. Diário Oficial [da] República Federativa do Brasil, Brasília.
Brasil. Ministério da Agricultura, Pecuária e Abastecimento. (2014). Decreto nº 8198 de 20 de fevereiro de 2014. Regulamenta a Lei no 7678 de 8 de novembro de 1988 que dispõe sobre a produção circulação e comercialização do vinho e derivados da uva e do vinho. Diário Oficial [da] República Federativa do Brasil, Brasília. Brasil. Ministério da Agricultura. (2004, November 12). Lei n° 10970
de 12 de novembro de 2004. Normas referentes à complementação dos padrões de identidade e qualidade do vinho e dos derivados da uva e do vinho. Diário Oficial [da] República Federativa do Brasil, Brasília. Retrieved from http://wwwagriculturagovbr.
Castilhos, M. B. M., Silva, A. C. C., & Bianchi, V. L. D. (2012). Effect of grape pre-drying and static pomace contact on physicochemical properties and sensory acceptance of Brazilian (Oves and Osabella) red wines. European Food Research and Technology, 235(2), 345-354. http://dx.doi.org/10.1007/s00217-012-1764-1.
Coetzee, W. J. D. U. C., Brand, J., Emerton, G., Jacobson, D., Ferreira, A. C. S., & Toit, C. (2015). Sensory interaction between 3-mercaptohexan-1-ol 3-isobutyl-2-methopxypyrazine and oxidation-related compounds. Australian Journal of Grape and Wine Research, 21(2), 179-188. http://dx.doi.org/10.1111/ajgw.12133.
Damásio, M. H. (1991). Análisis sensorial descriptivo: generación de descriptores y selección de catadores. Revista Agroquímica y Tecnología de Alimentos, 31, 165-178.
Fariña, L., Villar, V., Ares, G., Carrau, F., Dellacassa, E., & Boido, E. (2014). Volatile composition and aroma profile of Uruguayan Tannat wines. Food Research International, 69, 244-255. http://dx.doi. org/10.1016/j.foodres.2014.12.029.
Jewison, T., Neveu, V., Lee, J., Knox, C., Liu, P., Mandal, R., Murthy, R.K., Sinelnikov, O., Guo, A.C., Wilson, M., Djoumbou, Y., & Wishart, D.S. (2012). The yeast metabolome database. Nucleic Acids Research, 40(Database issue):D815-20. PubMed: 22064855. Retrieved from http://www.ymdb.ca/.
Jiang, B., Xi, Z., Luo, M., & Zhang, Z. (2013). Comparison on aroma compounds in Cabernet Sauvignon and Merlot wines from four samples are represented by a square corresponding to the mean
of the replicates. The wines have different profiles regarding the area of each chemical compound class and the concentration of acetaldehyde, ethyl acetate, higher alcohols and methanol. The MR wine was unique compared to the others, exhibiting a distinct profile. The SB and QM wines are characterized by the presence of acetaldehyde, 1-propanol, ethyl acetate, alcohol and esters classes of compounds, according to Axis O. This accounted for 75% of the variation among the wines, indicating that the more to the left the vectors are located, the greater the relative area of these compounds. The MR wine stood out from the other wines due to its higher area values for amines, others, aldehydes and ketones, terpenes, methanol and higher alcohols.
The differences uncovered with the PCA might have been influenced by the varietal composition of the wines. Furthermore, although the wines are originated in the same region, they are from different wineries that each have a unique production process. These differences might also be attributed to the identified compounds. The alcohol and esters class might explain why the QM wine had aroma descriptors (pungent and tropical fruits) with significant difference, when compared to the other wines (Table 2). On general, Tecchio et al. (2007) reported that wines produced with V. labrusca cultivars were also characterized by a fruity aroma/flavor due to the presence of esters.
4 Conclusion
The aroma descriptors and volatile compounds confirmed essentials information about the Osabella and Oves red wines. The results indicate that the grape composition of each wine mainly influences the sensory quality and the presence of volatile compounds in red wine. On addition to grape variety, the production process also contributes to the final sensory expression of the wine. According to PCA, fruity descriptors were the primary contributor to the aroma profile of the analyzed wines due to the presence of ethyl acetate and esters, especially in the wine coded as QM, which exhibited the highest variety of compounds. However, considering the continuous growth of Brazilian wine production and the importance of volatile compounds for their flavor, further characterization studies are essential to improve the method of producing such beverages.
Acknowledgements
The authors thank the National Council for Scientific and Technological Development (Conselho Nacional de Desenvolvimento Científico e Tecnológico - CNPq, Brazil) and the Coordination for the Omprovement of Higher Education Personnel (Coordenação de Aperfeiçoamento de Pessoal de Nível Superior - CAPES, Brazil) for funding this study.
References
Arcanjo et al.
Food Sci. Technol, Campinas, 38(2): 271-279, Apr.-June 2018 279/279 279
Robinson, A. L., Boss, P. K., Solomon, P. S., Trengove, R. D., Heymann, H., & Ebeler, S. E. (2014). Drigins of grape and wine aroma part 1: chemical components and vinicultural impacts. American Journal of Enology and Viticulture, 65, 1. http://dx.doi.org/10.5344/ ajev.2013.12070.
Rocha, S. M., Rodrigues, F., Coutinho, P., Delgadillo, O., & Coimbra, M. A. (2004). Volatile Composition of baga red wine: assessment of the identification of the would-be impact odourants. Analytica Chimica Acta, 513(1), 257-262. http://dx.doi.org/10.1016/j.aca.2003.10.009. Rombaldi, C. V., Bergamasqui, M., Lucchetta, L., Zanuzo, M., & Silva, J. A. (2004). Produtividade e qualidade de uva cv. Osabel em dois sistemas de Produção. Revista Brasileira de Fruticultura, 26(1), 89-91. http://dx.doi.org/10.1590/S0100-29452004000100024.
Stone, H. S., Sidel, J. L., Dliver, S., Woosley, A., & Singleton, R. C. (1974). Sensory evaluation by quantitative descriptive analysis. Food Technology, 28, 24-34.
Stone, H. S., & Sidel, J. L. (2004). Sensory evaluation practices. Leeds: Elsevier Acadmic Press. 438 p.
Tao, Y., Wang, L. H. H., & Zang, L. (2008). Volatile compounds of young Cabernet Sauvignon red wine from Changli County (China). Journal of Food Composition and Analysis, 21(8), 689-694. http:// dx.doi.org/10.1016/j.jfca.2008.05.007.
Tecchio, F. M., Miele, A., & Rizzon, L. A. (2007). Sensory characteristics of Oves wine. Revista de Pesquisa Agropecuária Brasileira, 42, 897-899. http://dx.doi.org/10.1590/S0100-204X2007000600018.
The LRO & Ddour Database. (2017). Reading: University of Reading. Retrieved from http://www.odour.org.uk
Verzera, A., Ziino, M., Scacco, A., Lanza, C. L., Mazzaglia, A., Romeo, V., & Condurso, C. (2008). Volatile compound and sensory analysis for characterization of an italian white wine from “Onzolia” grapes. Food Analytical Methods, 1(2), 144-151. http://dx.doi.org/10.1007/ s12161-008-9027-2.
Weldegeris, B. T., Villiers, A., McNeish, C., Seethapathy, A. M., Górecki, T., & Crouch, A. M. (2011). Characterisation of volatile components of Pinotage wines using comprehensive two-dimensional gas chromatography coupled to time-of-flight mass spectrometry (GCxGC-TDFMS). Food Chemistry, 129(1), 188-199. http://dx.doi. org/10.1016/j.foodchem.2010.11.157.
Welke, J. E., Manfroi, V., Zanus, M., Lazarotto, M., & Zini, C. A. (2012). Characterization of the volatile profile of Brazilian Merlot wines through comprehensive two dimensional gas chromatography time-of-flight mass spectrometric detection. Journal of Chromatography. A, 1226, 124-139. PMid:22277184. http://dx.doi.org/10.1016/j. chroma.2012.01.002.
wine grape-growing regions in China. Food Research International, 51(2), 482-489. http://dx.doi.org/10.1016/j.foodres.2013.01.001. Jofré, V., Fanzone, M., Assof, M., & Rivera, M. (2006). Evolución del
contenido de precursores odorantes en cepajes Malbec, Merlot y Cabernet Sauvignon de Tupungato durante el periodo de maduración de uvas. Revista Enologia, 3(1), 64-66.
Manetta, A. C., Giuseppe, L. D., Tofalo, R., Martuscelli, M., Schirone, M., Giammarc, D. M., & Sizzi, G. (2016). Evaluation of biogenic amines in wine: determination by an improved HPLC-PDA method. Food Control, 62, 351-356. http://dx.doi.org/10.1016/j.foodcont.2015.11.009. Meilgaard, M. R., Civillie, G. V., & Carr, B. T. (1999). Sensory evaluation
techniques. Leeds: CRC Press. 464 p.
Mello, L. P. R. (2015). Desempenho da vitivinicultura brasileira em 2015. Embrapa. Retrieved from https://www.embrapa.br/busca-de- noticias/-/noticia/9952204/artigo-desempenho-da-vitivinicultura-brasileira-em-2015.
Moskowitz, H. R. (1983). Product testing and sensory evaluation of foods. Leeds: Food and Nutrition Press. 605 p.
Nelson, R. R., Acree, T. E., Lee, C. Y., & Butts, R. M. (1977). Methyl anthranilate as an aroma constituent of American wine. Journal of Food Science, 42(1), 57-59. http://dx.doi.org/10.1111/j.1365-2621.1977. tb01217.x.
Noble, A. C., Arnold, J., Buechsenstein, A., Leach, E. J., Schmidt, J. D., & Stekrn, P. M. (1987). Modification of a standardized system of wine aroma terminology. American Journal of Enology and Viticulture, 38, 143-146.
Perestrelo, R., Albuquerque, F. F., Marques, J. C., & Câmara, J. S. (2006). Analytical characterization of the aroma of Tinta Negra Mole red wine: Odentification of the main odorants compounds. Analytica Chimica Acta, 563(1-2), 154-164. http://dx.doi.org/10.1016/j. aca.2005.10.023.
Pinho, G., & Bertrand, A. (1995). Analytical determination of Furaneol (25- Dimethyl-4-hydroxy-3 (2H)-Furanone) application to differentiation of qhite wines from hybrid and various vitis vinifera cultivares. American Journal of Enology and Viticulture, 46, 181-186. Reynolds, A. G., Lowrey, W. D., & De Savigny, C. (2005). Onfluence of
irrigation and fertigation on fruit composition, vine performance, and water relations of Concord and Niagara grapevines. American Journal of Enology and Viticulture, 56, 110-128.
Rizzon, L. A. (2010). Metodologia para análise de vinho. Brasília, DF: Embrapa. 120 p