ISSN 0104-6632 Printed in Brazil
www.abeq.org.br/bjche
Vol. 29, No. 02, pp. 429 - 440, April - June, 2012
*To whom correspondence should be addressed
Brazilian Journal
of Chemical
Engineering
CACHAÇA
DISTILLATION INVESTIGATED ON
THE BASIS OF MODEL SYSTEMS
H. F. A. Scanavini
1,2, R. Ceriani
3and A. J. A. Meirelles
2*1
UNISIM, CEPETRO, Universidade Estadual de Campinas, Cidade Universitária Zeferino Vaz, CEP: 13083-862, Campinas - SP, Brasil.
E-mail: [email protected]
2
Laboratório EXTRAE, Departamento de Engenharia de Alimentos, Faculdade de Engenharia de Alimentos, Universidade Estadual de Campinas, Cidade Universitária Zeferino Vaz, CEP: 13083-862, Campinas - SP, Brasil.
E-mail: [email protected]
3Faculdade de Engenharia Química, Universidade Estadual de Campinas, CEP: 13083-852, Campinas - SP, Brazil.
E-mail: [email protected]
(Submitted: June 21, 2010 ; Revised: September 23, 2011 ; Accepted: September 28, 2011)
Abstract - This work reports experimental tests using commercial spirits that were diluted and had their initial composition modified in order to better measure the distillation behavior of selected minor compounds of importance for the quality of alcoholic beverages. Such compounds were added to the commercial cachaça
and the corresponding model wine, obtained after the spirits’ dilution, was distilled. In this way a more precise distillation profile could be determined for those minor compounds. The alembic heating was performed by electrical resistance and the corresponding heat transfer coefficient was determined by analyzing the thermal behavior of the still during the distillations. A simulation algorithm was developed, including the mass and enthalpy balances as well as the heat transfer flux to the boiling wine. Good agreement between experimental and simulated results was obtained for the distillate rate, alcoholic graduation, temperature and most minor component profiles.
Keywords: Cachaça; Distillation; Simulation; Heat transfer coefficient.
INTRODUCTION
Brazilian sugar cane spirit, also called “cachaça”, is a beverage obtained from the distillation of fermented sugar cane juice (wine), with an alcoholic graduation between 38% v/v and 48% v/v (Brasil, 2005). It is the world’s third most consumed spirit by volume, and its consumption is increasing on the international market because of its exotic and special flavor. Nowadays, Brazilian production of sugar cane spirit is estimated at 1.3 billion liters per year.
Cachaça is produced by fermentation of the sugar
cane juice, followed by distillation and aging. Fermentation exerts the main influence on product quality, because minor components, such as alcohols, organic acids, carbonyl compounds and
esters, are generated during this step and are responsible for the spirits flavor (Lurton et al., 1995).
Ethanol is responsible for the beverage’s body. Higher alcohols, such as isoamyl alcohol, represent the main group in terms of the spirits´ flavor (Nykänen, 1986). Some compounds can be considered to be indicators of cachaça quality. The propanol level is usually low in spirits of good quality (Almeida and Barreto, 1972). The acetaldehyde concentration must be low, as it is related to the “hangover” syndrome (Nascimento et al., 1997). The methanol level should be controlled because it causes severe intoxication.
Cachaça quality is also influenced by the
in the distillate and the level of minor compounds is simultaneously determined. The traditional distillation of wine is carried out in a pot still working as a differential distillation unit. The main cut of the distillate, the heart, is concentrated in ethanol and corresponds to the final product (Yokoya, 1995). Two further cuts are usually obtained, the head, which contains the largest amounts of the minor compounds with higher volatility (acetaldehyde, methanol and ethyl acetate), and the tail, used for recovering the residual ethanol still present in the wine.
Although ethanol distillation is a widely investigated subject, the influence of minor compounds on the distillation path is an almost ignored theme. In a previous work of our research group (Scanavini et al., 2009), cachaça distillation was investigated by conducting experiments in a small scale alembic heated by direct fire and taking into account seven minor components. The experimental runs were reproduced by simulation based on a differential distillation algorithm and a good agreement was achieved between the experimental and the simulation results in terms of temperature and alcoholic graduation profiles, and also heart concentrations of the main congeners.
Other works reported the use of computer simulation to study beverage distillation. Osório et al. (2004, 2005) worked with Pisco, a distilled drink typical of Chile and Peru, optimizing the process in terms of the preferences of enologists and the best operational conditions of the distillation column. They included in the simulations six to eight minor components, but only in the latter work did they carry out a comparison of the simulated results with a very limited set of experimental data. In fact, they compared only the recoveries of three components in the heart fraction, ethanol and two minor ones. Gaiser et al. (2002) discussed the use of the commercial software Aspen Plus for simulating the production of grain whisky, typically manufactured in a continuous distillation. Batista and Meirelles (2011) simulated an industrial unit for continuous
cachaça distillation, taking into account ten minor
components and performed a comparison with results of an industrial equipment. Zavala-Loria et al.
(2011) worked with an alcoholic mixture and proposed a thermodynamic model, considering reflux and efficiency, to simulate batch distillation of ideal and non-ideal mixtures.
In the present work a new set of experimental tests is reported using commercial spirits that were diluted and modified by the addition of minor components in order to better measure their
distillation behavior in a model wine. In this way, additional effects that could occur in the distillation of a real fermented must were excluded, as for instance methanol generation associated with the presence of methoxylated pectin. On the other hand, the selected model system is sufficiently complex to represent a real wine in an approximate way, since it contains all minor components important for the quality of spirits. The alembic heating was performed by electrical resistance and the corresponding heat transfer coefficient was determined, allowing the calculation of the vaporization rate in the simulation algorithm. The experimental and simulated results were compared for the alcoholic graduation, temperature and for all the minor component profiles. The comparison was also performed for the head and heart cuts. Such a detailed comparison of experimental and simulated data helps to highlight the aspects to be improved in the use of simulation tools for studying spirit distillation and its quality. In fact, the reliable use of simulation tools for describing purification processes applied to products whose quality is related to minor components of utmost importance still requires further investigation. This is the case of alcoholic beverages, but also of aromas, cosmetics, perfumes, and edible oils.
MATERIAL AND METHODS
Experimental Trials
In order to study the thermal behavior of the still, five experiments were performed using different solutions: (1) distilled water; (2) 96% v/v ethanol and (3) three diluted sugar cane spirits (cachaça), with approximately 9% v/v ethanol. The still was thermally insulated, using a thermal blanket, in order to avoid heat losses to the environment. A scheme of the insulated still is shown in Figure 1. It was considered that the insulation does not allow any significant heat exchange between the equipment and the surroundings.
Brazilian Journal of Chemical Engineering Vol. 29, No. 02, pp. 429 - 440, April - June, 2012
Figure 1: Simple still: (a) heat system; (b) thermometer; (c) the dashed line represents the
thermal blanket used for insulation; (d) condenser (e) temperature sensor under the still.
In order to improve the description of the minor compounds distillation, and also to analyze the thermal behavior of a real distillation, experiments were performed with an already distilled spirit, which was diluted and had its initial composition modified. For these experiments, multidistilled commercial cachaça was used.
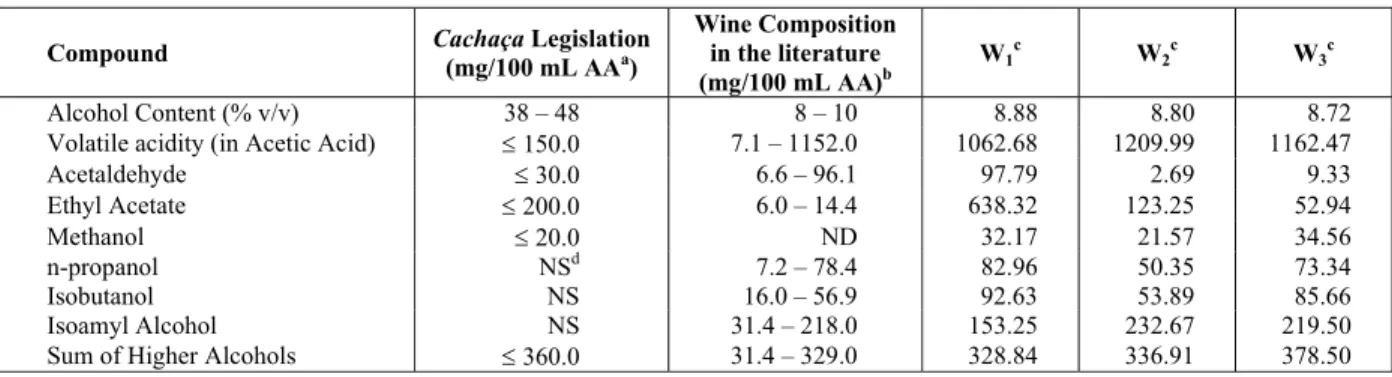
Firstly, those cachaça samples were analyzed in order to determine the alcohol content, volatile acidity and composition. On the basis of these values, the composition modification and dilution were conducted. The modification of composition was done through the addition of minor compounds (acetaldehyde, acetic acid, ethyl acetate, isoamyl alcohol and methanol) in known concentrations. These concentrations were defined based on the range of values for wine compositions found in the literature (Oliveira, 2001; Oliveira et al., 2005; Scanavini et al.,
2009) and the limits of concentrations established by the Brazilian legislation for cachaça (Brasil, 2005).
The values are presented in Table 1.
The aim of modifying the spirits´ composition was to obtain concentrations of minor compounds of an order of magnitude close to the maximum values reported in the literature (Table 1), so that their distillation paths could be followed with higher precision.
Three experiments with three different samples of the same brand of cachaça were performed. In case of the first wine (W1), the cachaça sample was diluted and modified in its acetaldehyde, ethyl acetate, methanol and acetic acid contents. As can be seen in Table 1, the contents of almost all minor compounds were close to the maximum values reported in the literature. The only exception is ethyl acetate, where the composition modification exceeded the maximum value. In the case of wines W2 and W3, the cachaça samples were diluted and modified in their contents of methanol, acetic acid and isoamyl alcohol.
Table 1: Brazilian Legislation for cachaça and wine compositions
Compound Cachaça Legislation (mg/100 mL AAa)
Wine Composition in the literature (mg/100 mL AA)b
W1c W2c W3c
Alcohol Content (% v/v) 38 – 48 8 – 10 8.88 8.80 8.72 Volatile acidity (in Acetic Acid) ≤ 150.0 7.1 – 1152.0 1062.68 1209.99 1162.47
Acetaldehyde ≤ 30.0 6.6 – 96.1 97.79 2.69 9.33
Ethyl Acetate ≤ 200.0 6.0 – 14.4 638.32 123.25 52.94
Methanol ≤ 20.0 ND 32.17 21.57 34.56
n-propanol NSd 7.2 – 78.4 82.96 50.35 73.34
Isobutanol NS 16.0 – 56.9 92.63 53.89 85.66
Isoamyl Alcohol NS 31.4 – 218.0 153.25 232.67 219.50 Sum of Higher Alcohols ≤ 360.0 31.4 – 329.0 328.84 336.91 378.50
a
AA = Anhydrous Alcohol; b
Oliveira, 2001; Oliveira et al., 2005; Scanavini et al., 2009;
c
Cachaças after composition modification and dilution, compositions also in (mg/100 mL AA); d
It should be observed that the initial acetic acid and methanol contents were modified in all wines. The initial concentrations of the minor components with higher volatility (acetaldehyde and ethyl acetate) were modified only in W1. The initial concentration of the main higher alcohol (isoamyl alcohol) was modified in W2 and W3.
During the experiments, flow rates were measured over the time necessary to obtain 50 mL of distillate. These flow rates, in mL/s, were transformed into molar flows (mol/s) and subsequently into rates of heat transfer Q (J/s), on the basis of the enthalpies of vaporization (in J/mol) evaluated at the boiling temperatures of each collected sample.
In the case of the diluted spirits, the distillation of each compound important to the spirit quality was monitored by GC analysis, density and volatile acidity. These analyses were conducted for each 100 mL sample obtained by combining two subsequent distillate samples of 50 mL.
The following temperatures were measured during the experiments: the temperature inside the still (the boiling temperature of the solution, Tb), the room temperature, the resistance temperature (TR) and also the temperature under the still during distillation (Tu). This last temperature represents the temperature of the exterior side of the metal sheet at the still bottom. The resistance temperature was kept constant at 318°C in all experiments.
Physical and Chemical Analysis
The alcohol content was determined by measuring the mixture relative density at 20°C, in a Anton Paar densimeter. Considering that the minor compounds represent a maximum of 0.7% in mass of the collected samples, they do not interfere significantly in the density values and the corresponding alcoholic graduations changed no more than 0.2 oGL as a consequence of their presence, so that measuring the alcohol content through density is a reliable procedure. The volatile acidity was determined by the volumetric method suggested by Amerine and Ough (1974). According to this method, the wine or distillate sample must be further distillated under direct steam injection so that the volatile acidity is withdrawn from the sample and then titrated using a standard NaOH solution. The volatile acidity was calculated and expressed in terms of acetic acid. The other minor compound compositions were determined by gas chromatography (Shimadzu GC 17 A gas chromatograph,), with flame ionization detector
(FID), on a DB-WAX column (30m x 0,25 mm x 0,25 mm), with an AOC-20i automatic injector. The method was based on the one described in Oliveira et al. (2005): Helium was used as the carrier gas, the linear velocity kept constant at 30 cm/s with a temperature ramp of 35°C for 8 min, then an increase to 65°C at a rate of 1°C/min and an increase to 200°C at a rate of 30°C/min, remaining at the final temperature for 5 min; the split ratio was 1:50 and injection volume 1.5 µL. External standard curves were used to determine the compound amounts.
Simulation Program
The simulation program was based on the algorithm suggested by Scanavini et al. (2005) and by Ceriani and Meirelles (2004). The batch distillation in the alembic was considered to be a multicomponent differential distillation without the occurrence of reflux. In the case of the vapor-liquid equilibrium calculations, it was assumed that the liquid and vapor phases are nonideal. The activity coefficients were calculated by the NRTL equation and the fugacity coefficients were evaluated using the virial equation and the Hayden O’Connel approach, as described elsewhere (Scanavini et al., 2009).
The algorithm used is based on the following set of Equation:
Enthalpy balance in the still bottom:
u b
Q=(UA).(T −T ) (1)
L v
dH
Q v.H L
dt
= + (2)
Mass balance in the still bottom:
dL v
dt = − (3)
i
i d(Lx )
v.y
dt = − (4)
Equilibrium relationship:
i.y .Pi i.x .Pi vpi
ϕ = γ (5)
Mass balances in the distillate receiver:
dD v
Brazilian Journal of Chemical Engineering Vol. 29, No. 02, pp. 429 - 440, April - June, 2012 i
1 dD
v.y
dt = (7)
where Q is the heat transferred to the boiling wine (J/s), Tu is the heat source temperature evaluated from the temperature under the still (°C), Tb is the wine boiling temperature (°C), U is the heat transfer coefficient (W/m2°C), A is the heat transfer area (m2), v is the vaporization rate (mol/s), Hv is the vapor phase enthalpy (J/mol), L is the total amount of liquid in the still (mol), HL is the liquid phase enthalpy (J/mol), t is time (s), xi is the liquid phase mole fraction of component i, yi is its vapor phase mole fraction, ϕi and γi are the fugacity and activity coefficients, respectively, P is the total pressure (Pa), Pvpi is the vapor pressure of component i (Pa), D is the total amount of distillate (mol) and Di is the total amount of component i in the distillate (mol).
RESULTS AND DISCUSSION
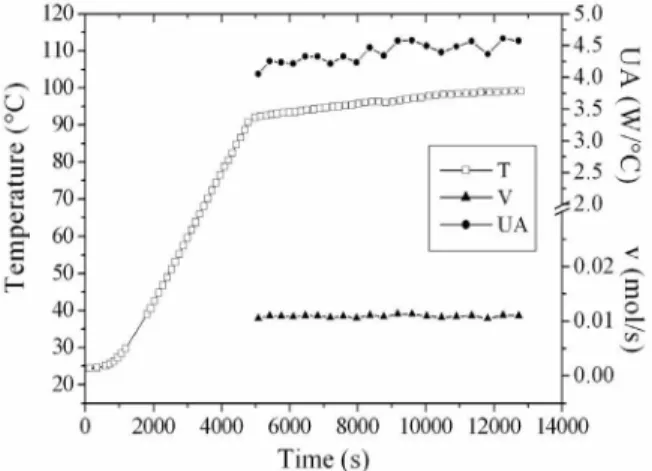
Figure 2 shows the curves of the wine temperature from the beginning of heating, the vaporization rate, in mol/s, and the values of UA for experiment W2. During the distillate withdrawal, the boiling temperature does not show a large variation, but increases continuously, as a consequence of the decreasing concentration of ethanol in the wine. The vaporization rate remains almost constant along the distillation period. The behavior observed for the UA-values shows a slightly larger variation, but the measured changes around the average value were never higher than ± 5%.
Figure 2: Profiles of temperature, vaporization rate
(v) and UA-values for experiment W2.
The UA-values were estimated on the basis of the measured vaporization rates for all experimental
runs. In the case of the diluted spirits distillations, the effect of the wine and distillate changing compositions were taken into account through the wine boiling temperatures and the distillate heat of vaporization.
The calculated UA-values depend on the specified temperature difference between the heat source and the wine temperature. Industrial alembics are normally heated by direct fire or steam. In small scale experiments, the use of electrical heating makes it easier to control the heat transfer and, consequently, the vaporization rate. In each one of these cases, the heat source temperature will be different, affecting the estimated UA-values (see Eq. (1)). In order to avoid this problem, the heat source temperature was assumed to be the temperature of the exterior side of the still bottom (Tu), as measured in the experimental runs. In the case of the water boiling, this temperature was 202°C and for the hydrated alcohol or diluted spirits distillations, it was equal to 197°C. The calculated UA-values are given in Table 2.
Table 2: Values of the heat transfer coefficients UA
Experimental run UA (W / °C)
Water 4.84 ± 0.23 Ethanol 4.07 ± 0.15
W1 4.35 ± 0.20
W2 4.32 ± 0.16
W3 4.31 ± 0.14
Thus, simulations were carried out in order to reproduce the experiments with wines W1, W2 and W3. In these simulations, an average value for UA calculated on the basis of the results shown in Table 2 was used (4.38 W/°C).
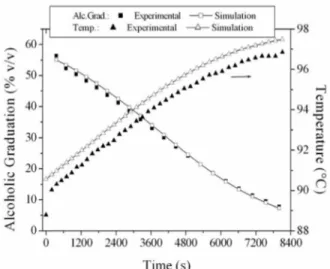
Figure 3 gives the alcoholic graduation profiles and indicates that the simulation provided results very close to the experimental alcohol content. The deviations between experimental and simulated values are shown in Table 3.
Figure 3: Distillate alcoholic graduation and wine temperature profiles for W2 and W4 distillations, respectively.
Table 3: Distillate alcoholic graduation in the experimental and simulated runs
Experiment GLinitial GLfinal Average Deviation (%)a Experimental 56.6 7.6
W1 Simulation 54.0 8.7 7.2
Experimental 56.4 7.8
W2 Simulation 54.9 8.6 5.4
Experimental 56.1 7.3
W3 Simulation 54.7 7.9 4.6
a
Average Deviation:
∑
= −= N
1
n exp
sim exp
r r r * N 100
AD , where N is the total number of experimental
points, rexp is the experimental result and rsim the simulated one.
Table 4: Boiling temperatures in the experimental and simulated runs
Experiment Tinitial (°C) Tfinal (°C) Average Deviation (%) Experimental 88.5 96.9
W1
Simulation 90.3 97.3 0.64
Experimental 88.8 96.7 W2
Simulation 90.5 97.3 0.68
Experimental 88.8 96.9 W3
Simulation 90.6 97.4 0.70
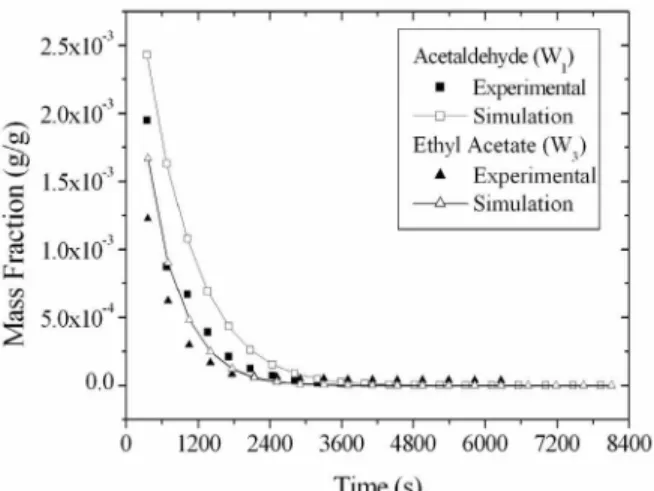
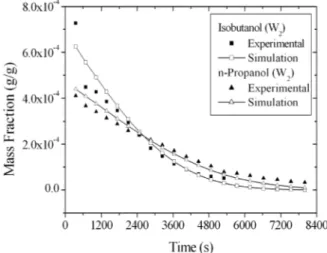
The mass concentration profiles of each component considered in the experimental runs and in the simulations are shown in Figures 4 to 7. In general, a good proximity was observed between the experimental and simulated concentration profiles, with the exception of isoamyl alcohol and acetic acid.
The most volatile compounds, acetaldehyde and ethyl acetate, shown in Figure 4, had distillation profiles that were well described by the simulations, but the initial experimental values were always lower than the simulated ones. In the case of acetaldehyde, it is possible that there was some loss of this compound by evaporation during the condensation of
the distillate fractions. The boiling point of acetaldehyde is very low (Tb = 21°C), and the condensation was carried out using only running water for cooling.
Brazilian Journal of Chemical Engineering Vol. 29, No. 02, pp. 429 - 440, April - June, 2012
Figure 4: Distillate acetaldehyde and ethyl acetate
profiles during distillation.
Figure 5: Distillate methanol and isoamyl alcohol
profiles during distillations.
According to literature reports (Madrera and Alonso, 1996; Cortés et al., 2002; Cortés et al., 2005; Claus and Berglund, 2005), methanol distillate concentrations showed an unexpected increase in concentration at the end of the distillation. This behavior is different than would be expected due to methanol’s high volatility and low boiling point: it should distill mainly at the beginning and its concentration steadily decreases along the distillation path. Despite the somewhat larger differences observed in our results between methanol’s experimental and simulated concentration values, in comparison to the prior profiles, the results for methanol are still in good agreement and do not confirm those literature reports of an unexpected increase in its concentration at the end of the distillation. Considering that those literature works
investigated alembic distillation of real fermented musts, a possible explanation of the observed behavior might be an eventual influence of other compounds on methanol volatility or an eventual methanol generation by, for instance, pectin degradation during real wine distillation.
contained in for the first 200 mL of distillate. For the experimental results, if a volume in this range is separated, this would be enough to withdraw the largest amount of these compounds in the head fraction.
For ethyl acetate in W1, the experiment in which this compound´s initial concentration was modified, 200 mL of head was not enough to make the spirit conform the Legislation, since a content of 205.8 mg/100 mL AA was obtained.
Considering that, when 200 mL was taken as the head fraction, this was not enough to reduce the contents of some lighter components in the heart fraction to within the required values, such as in W1 (ethyl acetate), the simulation results can be used as a tool to determine when the cut should be done in order to distill the spirit according to the Legislation limits.
The higher alcohols propanol and isobutanol did not have their initial contents modified as they were already close to the maximum values found in the wine compositions reported in the literature. Their profiles are shown in Figure 6. For isobutanol, the simulation showed higher values right from the beginning, except for the first experimental point; but the experimental and simulation results are very close. It should be noted that isobutanol concentrations at the end of the distillation have values below the experimental detection limit. The n-propanol profile was even better described by the simulation, although in the beginning the simulation results are higher and in the end the curves invert the prior behavior.
Figure 6: Distillate isobutanol and n-propanol
profiles for W2 distillation.
As pointed out before (Table 1), there are no specific Legislation limits for these two higher
alcohols in separate. So the cuts should be analyzed for all the higher alcohols together, which also includes isoamyl alcohol.
Figure 5 also shows the distillate profiles of isoamyl alcohol. The experimental curve of this higher alcohol crosses the simulation results and presents lower final concentrations. The larger differences between simulation and experiments could be attributed to an inappropriate prediction of isoamyl alcohol volatility. According to the experimental profiles, it can be seen that this higher alcohol is actually more volatile than the simulation predicts. In fact, despite its relatively large carbon chain, isoamyl alcohol is a light component in a water–rich environment, such as alcoholic wine. In such an environment, this compound’s activity coefficient is very large and probably its value was not well predicted by the NRTL equation. According to the simulation results, isoamyl alcohol should be more accumulated in the heart fraction than indicated by the experimental results. Different experimental data sets can be found in the literature for the binary mixture isoamyl alcohol and water (Gmehling and Onken, 1981; Cho et al., 1984; Dechema online, 2010) and, from a quantitative point of view, they do not always agree. In fact, those data exhibit relatively large differences in the region of low isoamyl alcohol concentration, the region of interest in the present case. The set of parameters available in the Aspen Plus database was used in the present work and considered to be the most reliable source at the time. Although alternative sources of parameters could be tested and eventually allow lower deviations between experimental and simulated distillation results, such a decrease in the deviations does not discriminate between errors due to the phase equilibrium data and those related to the distillation process itself. In fact, compensation of errors could occur in such a case, suggesting that new equilibrium data for this binary mixture are probably required to solve the conflict between the already available experimental data.
Brazilian Journal of Chemical Engineering Vol. 29, No. 02, pp. 429 - 440, April - June, 2012 the tail fraction. For this minor compound, the heart
cut is the one that determines its quantity in the
cachaça.
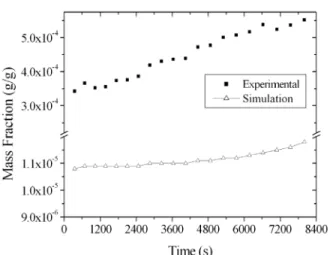
The differences between experimental and simulated contents of acetic acid could be explained by the fact that the experimental volatile acidity should be, according to the Legislation, determined by titration and expressed only in terms of acetic acid. However, there are other organic and inorganic acids present in cachaça, and not considered in the simulation. Those acids surely contributed to increase the experimental values. Besides acetic acid, there are other volatile organic acids that are normal byproducts of the alcoholic fermentation, such as formic, butyric, and propionic acids, present in small quantities (Cardoso et al., 2003; Nascimento et al., 1998; Nykänen and Nykänen, 1991; Amerine et al., 1972). For instance, formic acid is more volatile than acetic acid, so it will distill first, increasing the distillate acidity. On the other hand, volatile inorganic acids, such as carbonic and sulfurous acids can also be present in the wine. Carbon dioxide is produced during fermentation and sulfur dioxide can be used for sugar bleaching, so that residues of these volatile components may be present in cachaça, also contributing for the higher acidity values observed in the experimental runs.
In order to improve the understanding of the volatile acidity behavior during alembic distillation, two actions should be considered in future investigations. In the case of the experimental runs, a series of other acids should be monitored, since prior investigations have detected their presence in spirits (Cardoso et al., 2003; Nascimento et al., 1998; Nykänen and Nykänen, 1991; Amerine et al., 1972). In relation to the simulation approach, those acidic compounds should be incorporated in the software
and the capacity of the equilibrium modeling to correctly predict their volatility behavior should also be evaluated.
As cited previously, the experimental distillates were separated in cuts: the head corresponded to the initial 200 mL of distillate, while the heart ended when the distillate reached about 38% v/v ethanol. The only experiment that did not present a spirit within specifications for all the compounds was W1. In the case of W1, the ethyl acetate content (205.8 mg/100 mL AA) was above the Legislation limit (200 mg/100 mL AA). As should be noted, W1 had its initial ethyl acetate composition changed by a significant amount. In fact, if the concentrations of several minor compounds in the wine were close to or above the maximum values reported in the literature, the use of a simple distillation process may not be able to produce spirits within the required quality limits. In this case, the use of a batch distillation with reflux would probably be the best alternative in order to improve the separation of minor compounds in specific cuts.
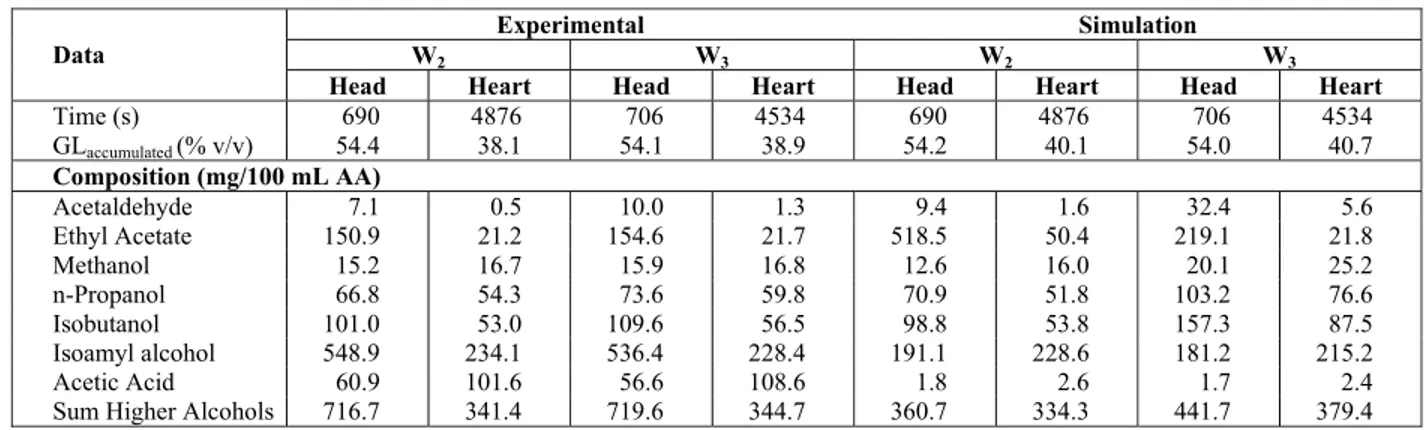
The same cuts were made in the W2 and W3 simulations, maintaining the experimental cut times. Table 5 presents the experimental and simulated cuts. The W2 simulation showed a cachaça within the Legislation limits, and concentrations close to the ones obtained experimentally, with exception of acetic acid and ethyl acetate in W2. For acetic acid, it was observed that its concentration in the simulated spirits (2.6 mg/100 mL AA) was much lower than the experimental ones (101.6 mg/100 mL AA). This was expected, since in the profiles (Figure 7) it can be seen that the program provided a much lower content than in the experimental distillate, despite the fact that the initial acid content was modified in all experimental runs.
Table 5: Experimental and simulated cut compositions
Experimental Simulation
W2 W3 W2 W3
Data
Head Heart Head Heart Head Heart Head Heart
Time (s) 690 4876 706 4534 690 4876 706 4534
GLaccumulated (% v/v) 54.4 38.1 54.1 38.9 54.2 40.1 54.0 40.7
Composition (mg/100 mL AA)
Acetaldehyde 7.1 0.5 10.0 1.3 9.4 1.6 32.4 5.6
Ethyl Acetate 150.9 21.2 154.6 21.7 518.5 50.4 219.1 21.8
Methanol 15.2 16.7 15.9 16.8 12.6 16.0 20.1 25.2
n-Propanol 66.8 54.3 73.6 59.8 70.9 51.8 103.2 76.6
Isobutanol 101.0 53.0 109.6 56.5 98.8 53.8 157.3 87.5
Isoamyl alcohol 548.9 234.1 536.4 228.4 191.1 228.6 181.2 215.2
Acetic Acid 60.9 101.6 56.6 108.6 1.8 2.6 1.7 2.4
Figure 7: Distillate Volatile Acidity profiles, in acetic acid for W2 distillation.
Unfortunately, in the case of W3 the simulation results for methanol (25.2 mg/100 mL AA) and for the sum of higher alcohols (379.4 mg/100 mL AA) are outside the Legislation limits (20 and 360 mg/100 mL AA, respectively). In the case of the higher alcohols, only the isoamyl alcohol initial content was modified and its profiles were not well described by the simulation. However, the content of these compounds in the simulated heart cut is not too different from the experimental one. For methanol, as said before, the simulation predicted a higher concentration in the distillate than in the experimental run (see Figure 5). It should also be noted that the methanol content in W3 is also higher than in W2 (see Table 1).
CONCLUSION
Although the distillation path of the minor compounds is very important for spirits quality, their experimental behavior is not yet fully understood, as in the case of methanol, and their reproduction by simulation tools is also not completely satisfactory. In the present work, a series of experiments conducted with diluted and modified cachaças
allows the measurement of heat transfer coefficients during distillation and the reliable monitoring of the minor compounds’ distillation path. The suggested simulation algorithm was able to reproduce correctly the distillate amount, the wine boiling temperature, the distillate ethanol content and the concentration profiles of most minor components. The experimental and simulated results for methanol do not confirm prior data reported in the literature that indicated an unexpected increase in the methanol
concentration at the end of the distillation. The experimental profiles for isoamyl alcohol and volatile acidity were not well reproduced by the simulation. A better prediction of the vapor-liquid equilibrium for isoamyl alcohol and the inclusion of further acidic components in the wine composition are probably required in order to improve the simulation tools. Despite this drawback, the simulation provides reliable results for most compounds and can help define appropriate distillate cuts for guaranteeing spirits quality.
ACKNOWLEDGMENTS
The authors thank the Brazilian support agencies FAPESP (06/04471-4, 08/56258-8) and CNPq (303650/2007-1).
NOMENCLATURE
A heat transfer area m2
D total amount of distillate mol
Di total amount of component i in the distillate
mol
HL liquid phase enthalpy J/mol
Hv vapor phase enthalpy J/mol
L total amount of liquid in the still
mol
P total pressure Pa
Pvpi vapor pressure of component i
P
Q heat transferred to the boiling wine
J/s
Brazilian Journal of Chemical Engineering Vol. 29, No. 02, pp. 429 - 440, April - June, 2012
Tb wine boiling temperature °C
Tu heat source temperature evaluated as the temperature under the still
°C
U heat transfer coefficient W/m2°C
v vaporization rate mol/s
xi liquid phase mole fraction of component i
yi vapor phase mole fraction of component i
Greek Letters
γi activity coefficient of component i
ϕi fugacity coefficient of component i
REFERENCES
Amerine, M. A., Berg, H. W., Cruess, W. V. Brandy production. In: The technology of wine making. 3rd. Ed. Westport: The Avi publishing Company, 17: 600-644 (1972).
Amerine, M. A., Ough, C. S., Wine and must analysis. New York, J. Wiley & Sons (1974). Brasil, Instrução Normativa n° 13, de 29 de junho de
2005. Regulamento técnico para fixação dos padrões de identidade e qualidade para aguardente de cana e para cachaça. Diário Oficial da União, Brasilia, DF, 30 jun. 2005, Seção 1, n. 124. (In Portuguese).
Cardoso, D. R., Lima-Neto, B. S., Franco, D. W., Nascimento, R. F. Influência do material do destilador na composição química das aguardentes de cana – Parte II. Química Nova, v. 26, (2), p. 165-169 (2003). (In Portuguese).
Ceriani, R., Meirelles, A. J. A. Simulation of batch physical refining and deodorization processes. Journal of the American Oil Chemists Society, v. 81, p. 305-312 (2004).
Cho, T. H., Ochi, K., Kojima, K., Isobaric Vapor-liquid-equilibria for binary S-systems with limited miscibility, normal-amyl alcohol and water-isoamyl alcohol. Kagaku Kogaku Ronbunshu, Tokyo, v. 10, n. 2, p. 181-183 (1984).
Claus, M. J., Berglund, K. A., Fruit Brandy Production by Batch Column Distillation with Reflux. Journal of Food Process Engineering, v. 28, p. 53-67 (2005).
Cortés, S. M., Gil, M. L., Fernandéz, E., The influence of redistillation in the distribution of
volatile components of Marc spirit (Aguardiente) and its repercussion on the aromatic quality. Sciences des Aliments, v. 22, p. 265-275 (2002). Cortés, S. M., Gil, M. L., Fernandéz, E., Volatile
composition of traditional and industrial Orujo spirits. Food Control, v. 16, p. 383-388 (2005). Dechema online. http://i-systems.dechema.de/detherm/
mixture.php. (Accessed in February, 2010). Gaiser, M., Bell, G. M., Lim, A. W., Roberts, N. A.,
Faraday, D. B. F., Schulz, R. A. and Grob, R., Computer simulation of a continuous whisky still. J. Food Eng., v. 51, p. 27-31 (2002).
Gmehling, J., Onken, U., Vapor – Liquid Equilibrium Data Collection. Frankfurt DECHEMA Chemistry Data Series (1981).
Madrera, R. R., Mangas Alonso, J. J. M., Obtención de aguardiente de sidra mediante alambique con columna de rectificación = Obtention of cider spirit by distillation in a rectification column. Alimentaria, v. 277, p. 89-93 (1996). (In Spanish). Nascimento, R. F., Cerroni, J. L., Cardoso, D. R.,
Lima Neto, B. S., Franco, D. W., Comparação dos métodos oficiais de análise e cromatográficos para a determinação dos teores de aldeídos e ácidos em bebidas alcoólicas. Ciência e Tecnologia dos Alimentos, São Paulo, v. 18, (3), p. 350-355 (1998). (In Portuguese).
Nascimento, R. F., Marques, J. C., Neto, B. S. L., Keukeleire, D., Franco, D. W., Qualitative and quantitative high-performance liquid chromatographic analysis of aldehydes in Brazilian sugar cane spirits and other distilled alcoholic beverages. Journal of Chromatography A, Amsterdam, v. 782, p. 13-23 (1997).
Nykänen, L., Formation and occurrence of flavour compounds in wine and distilled alcoholic beverages. American Journal of Enology and Viticulture, Davis, v. 37, (1), p. 84-96 (1986). Nykänen, L., Nykänen, I., Distilled beverages. In:
MAARSE, H. (Ed.) Volatile Compounds in food and beverages. New York: Marcel Dekker, INC., p. 548-580 (1991).
Oliveira, E. S., Características fermentativas, formação de compostos voláteis e qualidade da aguardente de cana obtida por linhagens de leveduras isoladas de destilarias artesanais. Tese (Doutorado em Tecnologia de Alimentos), Faculdade de Engenharia de Alimentos, Universidade Estadual de Campinas (UNICAMP) Campinas (2001). (In Portuguese).
Microbiology & Biotechnology, v. 21, p. 707-715 (2005).
Osório, D., Pérez-Correa, R., Belancic, A. and Agosin, E., Rigorous dynamic modeling and simulation of wine distillations. Food Control v. 15, p. 515-521 (2004).
Osório, D., Pérez-Correa, R., Biegler, L. T. and Agosin, E., Wine distillates: practical operating recipe formulation for stills. J. Agric. Food Chem., v.53, p. 6326-6331 (2005).
Scanavini, H. F. A., Ceriani, R., Cassini, C. E. B., Souza, E. L. R., Maugeri Filho, F., Meirelles, Antonio, J. A., Cachaça Production in a Lab-scale Alembic: Modeling and Computational
Simulation. Journal of Food Process Engineering, DOI: 10.1111/j.1745-4530.2008.00352.x (2009). Scanavini, H. F. A., Ceriani, R., Cassini, C. E. B.,
Maugeri Filho, F., Meirelles, A. J. A., Computer Simulation of a batch still for cachaça production. In: ENPROMER, 4°, 2005, Angra dos Reis. Anais. Rio de Janeiro, UFRJ, CD-ROM (2005).
Yokoya, F., Fabricação de Aguardente de cana. Série Fermentações Industriais, Campinas, n. 2, p. 92 (1995). (In Portuguese).