Arq. Bras. Med. Vet. Zootec., v.70, n.6, p.1823-1832, 2018
Hematological and immunological development from birth to six months
of age in Holstein calves
[Desenvolvimento hematológico e imunológico em bezerros Holandeses do nascimento aos seis meses de idade]
C.C. Baccili1, S.M.F.N. de Oliveira1, J.F.R Costa1, C.O.Massoco1, C.R. Pozzi2, V. Gomes1
1Faculdade de Medicina Veterinária e Zootecnia Universidade de São Paulo ˗ São Paulo, SP 2
Instituto de Zootecnia ˗ Nova Odessa, SP
ABSTRACT
The hematological and immunological development of calves from birth to 6 months of age was performed by hemogram and cellular phenotype. Ten male Holstein calves were assessed in 13 moments: before colostrum intake (D0), every 2 days until the 10th day of life (D2 to D10), at the 15th day after birth (D15), and then monthly up to 6 months (D180). Calves presented hemoconcentration on day (D) 0 and showed a gradual decrease in hematimetric rates until D180. The inversion of the neutrophilic for lymphocytic profile was
observed on D4. The percentage of CD3+ cells on D10 was higher than D30 up to D180. The number of CD4+
and CD8+ cells did not change between time points. The number of CD21+ lymphocytes was significantly
higher at early time points of D0 up to D15, compared on D30 until D150. In conclusion, the neonatal period was marked by stress leukogram in the first 4 days, and low number of B lymphocytes. These might be risk factors for bacterial infections responsible for navel inflammation and diarrhea. The increase in the number of B cells from 30 days of age demonstrated that the calves were functional and able to generate an immune response.
Keywords: bovine, immune system, leukogram, immunophenotyping, flow cytometry
RESUMO
O desenvolvimento hematológico e o imunológico de bezerros do nascimento aos seis meses de idade foram avaliados por meio hemograma e imunofenotipagem dos linfócitos. Para tanto, 10 bezerros machos Holandeses foram avaliados em 13 momentos: antes da ingestão do colostro (D0), a cada dois dias até o 10º dia (D2 a D10), 15º dia (D15) e, em seguida, mensalmente até seis meses de idade (D180). Os bezerros apresentaram hemoconcentração em D0 e decréscimo gradual dos índices hematimétricos até D180. A inversão do perfil neutrofílico para linfocítico foi observada em D4. Os valores de CD3+ (%) em D10 foram maiores que aqueles observados em D30 até D180. CD4+ e CD8+ não apresentaram alterações entre os momentos. Os linfócitos B CD21+ aumentaram significativamente a partir dos primeiros momentos D0 até D15, em comparação com os momentos subsequentes D30 até D150. Em conclusão, o período neonatal foi caracterizado pelo leucograma de estresse nos primeiros quatro dias e o baixo número de linfócitos B. Esses fatos podem ser considerados como fatores de risco para infecções bacterianas responsáveis pelas inflamações umbilicais e pela diarreia. Por outro lado, o aumento de células B após os 30 dias de vida demonstrou que os bezerros foram capazes de gerar uma resposta imune.
Palavras-chave: bovino, sistema imune, leucograma, imunofenotipagem, citometria de fluxo
INTRODUCTION
Newborn calves are considered immune-naïve and agammaglobulinemic at birth, because of the synepitheliochorial placenta from dams, which prevents the passage of pathogens to the fetus
Recebido em 15 de setembro de 2016 Aceito em 31 de janeiro de 2018 E-mail: [email protected]
during pregnancy. Even though this barrier
maintains the sterility of the placental
environment, it is also associated with two
negative consequences for the neonate:
agammaglobulinemia and absence of an
Progesterone, prostaglandins, and the cytokines interleukin (IL)-4 and IL-10, produced by the placenta during pregnancy, are responsible for the suppression of the Th1 maternal response, which releases toxic cytokines for the fetal-placental environment. The predominance of the Th2 immune response is responsible for the susceptibility of the newborn to intracellular
pathogens (Wegmannet al., 1993). Furthermore,
maternal and fetal cortisol released at the end of pregnancy and during labor is responsible for stress leukogram and the decrease of the
functional activity of phagocytes (Chase et
al.,2008).
The immature immune system of newborn calves at birth emphasizes the critical role of passive immunity transfer from the dam. The bovine colostrum is rich in immunoglobulin G1 (IgG1), cells, and cytokines. Mononuclear leukocytes are the predominant cells in the mammary secretion,
especially CD14+ macrophages (39.6%), B
lymphocytes (24.5%), CD4+ T lymphocytes
(13.8%), and CD8+ T lymphocytes (19%) (Park
et al., 1992). These cells are absorbed by the newborn intestinal mucosa and have been identified in the blood stream and lymph nodes
after fresh colostrum intake (Liebler-Tenorioet
al., 2002;Reberet al., 2006).
The duration of immune factor presence in colostrum, especially IgG1, and the precocity of immune system development are the main factors in the epidemiological distribution of infectious diseases in calves. For determining the vulnerability periods, it is necessary to establish the hematological and immunological profiles of calves during early life.
Several studies have been performed to establish the normal values for hematological parameters. However, few published papers included
repeated measurements of hemogram
components in calves during the first 6 months of life. In addition, previous studies were performed using older technology (manual) (Brun-Hansen
et al., 2006). Data on the profile of lymphocyte
subsets in calves are scarce (Kampenet al.,
2006). At this time, we are aware of only two international papers published on this topic, and the results may not be representative for calves
under Brazilian conditions (Wilson et al., 1996;
Kampenet al., 2006).
The hypothesis of this study is that variations in
calves' hematological and immunological
components occur during development, and these variations could indicate the window of susceptibility to antigens that are common in calf rearing. Therefore, a longitudinal study was designed to follow the cellular profile of Holstein calves from birth up to 6 months of age. This profile was evaluated by hemogram and phenotyping of the lymphocyte subsets.
MATERIALS AND METHODS
This research was approved by the Ethics Committee on Animal Use of the Faculty of Veterinary Medicine and Animal Science, University of São Paulo (Protocol # 2305/2011).
Ten Holstein cows and their calves were sourced from a dairy farm located in Nova Odessa, São
Paulo, Brazil. These cows produced 25–30L of
milk per day at the peak of lactation.
The dams were vaccinated against foot and
mouth disease and Brucella abortus according to
the Brazilian official program. These animals were also vaccinated in the pre-partum period by subcutaneous injection of 5mL of commercial multivalent vaccine containing inactivated strains of Bovine viral Diarrhea Virus (BVDV) type 1 (5960) isolated in Iowa (USA) and BVDV type 2
(53637) isolated in Ontario (USA);
live/thermosensitiveBovine Herpesvirus 1
(Cooper) and Parainfluenza-3 Virus (RLB 103);
live-attenuatedBovine Respiratory Syncytial
Virus (strain 375) diluted in the adjuvant with "Quil A, cholesterol and amphigen." The vaccinations for bovine respiratory disease were administered twice, 8 and 4 weeks before the expected delivery dates.
They were then fed with 6L of milk replacer
(Sprayfo® Violeta, Stolen, Deventer, Holanda),
commercial feed (Ração para bezerros®,
Agromix, Sao Paulo, SP, Brazil), hay, mineral
salt (Fosbovi 20®, Tortuga, Mairinque, SP,
Brazil),and water ad libitum until weaning. The
quantity of the feed was increased at the beginning of the transition period and the maximum amount was established to be 3kg/day.
The calves were assessed before colostrum
administration (D0), every 2 days until the 10th
day of life (D2 to D10), at the 15th day after birth
(D15), and then monthly up to 6 months of age (D180).
The calves were given a general clinical examination that included vital signs, hydration, ocular mucous, capillary refill, and palpation of the lymph nodes. The organ systems were evaluated when animals showed any changes in the general clinical examination and data excluded at moment presented (Feitosa, 2014).
Blood samples (4mL) were collected by vein puncture of the external jugular vein, using a
vacuum system, into tubes containing
ethylenediamine tetraacetic acid (EDTA,
1.5mg/mL). All samples were transported under refrigeration in an isothermal box.
Hematological parameters were obtained using
an automatic system (ABC Vet, Horiba ABX®,
Montpellier, FRA). Differential counting of leukocytes was performed by observing the cell
morphological characteristics at
1000xmagnification (Novo et al., 2015).
The phenotyping of blood lymphocytes was performed according to the recommendations of
Della Libera et al. (2012). The proportions of
blood lymphocyte subsets were determined by
flow cytometry (FACSCaliburTM, Becton
Dickinson Biosciences, San Jose, CA, USA). One hundred microliters of whole blood with EDTA was added to the flow cytometry tubes. Red blood cells (RBCs) were lysed by adding
FACS Lyse Solution (BD Biosciences).
Monoclonal antibodies (VMRD, Pullman, WA, USA) against various bovine leukocyte surface molecules (Table 1) were added to a final
concentration of 1μg/mL.The samples were
stained for 30min at 4°C and washed thrice with phosphate buffered saline (PBS). Subsequently,
the primary antibodies were labeled with 1μg/mL
fluorescein isothiocyanate - FITC, 1μg/mL
phycoerythrin- rPE (Invitrogen, Carlsbad, CA,
USA), and 10μg/mL peridinin-chlorophyll
proteins - PercP (Becton Dickinson Biosciences), and incubated for 30min in the dark at 4°C. The IgG1 specific antibody was conjugated with PerCP, the IgG2a specific antibody was conjugated with rPE, and the IgM specific antibody was conjugated with FITC. Finally,
cells were washed twice and suspended in 300μL
of cold, sterile PBS.
Samples were analyzed by flow cytometry using FacsCalibur equipment (BD Biosciences, San Jose, CA, USA). Gate windows in forward angle scatter and 90º light scatter were established to
allow the inclusion of the lymphocyte
population.
Table 1. Primary and secondaryantibodies used to identify blood mononuclear cells
Primary Clones Secondary Isotypes Specificity
CD3 MM1A PerCP®, rat anti-mouse IgG1 T lymphocytes
CD4 IL-A11 rPE®, goat anti-mouse IgG2a T Helper
CD8 BAQ111A
FITIC®, goat anti-mouse IgM T cytotoxic
CD21 BAQ15A IgM B Lymphocytes
Flowjo analysis software (Treestar Inc, San Carlos, USA) was used to analyze the events
(50.000 cells/samples) acquired by flow
cytometry. All samples were gated on forward angle and side scatter to establish the lymphocyte
Results are reported as the percentage of gated cells that were positive for each cell surface
marker. The absolute number of each
lymphocyte subset was calculated by
multiplication of the percentage and the total number of lymphocytes per milliliter of blood obtained from the hemogram.
Statistical analysis was performed using SPSS for Windows (International Business Machines [IBM] Corporation, Armonk, New York, USA).
All variables had parametric distribution
according to the Shapiro-Wilk test, except rod neutrophils and eosinophils. Theage effect was examined using repeated measures analysis of variance(ANOVA). Differences among time points were considered significant when P< 0.05.
Rod neutrophils and eosinophils were not detected at some of the evaluation time points of this research. Therefore, these parameters were determined from D0 up to D6 for rod neutrophils, and from D60 up to D180 for eosinophils. These variables had non-parametric distribution according to the Skewness-Kurtosis test. Theage effect was examined using Friedman test, but none of the tested parameters showed statistically significant difference (P< 0.05) among time points.
RESULTS
The means and standard deviations of the
erythrogram components and multiple
comparisons between time points are shown in Table 2.
Sample time on RBC had decreased from D2 to D6 with an increasing trend throughout the study. Significant differences were seen between D0 (before colostrum intake)to D4 and D6 (P< 0.05).
The maximum values for hemoglobin (HGB) and hematocrit (HCT) were observed on D0. These HCT values then decreased between D2 to D10, with a slight increase thereafter (D15 to D180). HCT values on D0 were significantly different from those on D4, D6, D8 and D10 (P< 0.05).
The values of mean corpuscular volume (MCV), mean corpuscular hemoglobin (MCH) and mean corpuscular hemoglobin concentration (MCHC) decreased gradually during the first 6 months of life (D0 to D180). MCV values on D0 were
significantly different compared with those from D6 up to D150 (P< 0.05), with the exception of D10. Values on D2 were different from those on D8, D30, D60, D120, D150 and D180 (P< 0.05). The mean MCV values on D4, 6, 8 and 10 differed from those on days 60, 120 and 150 (P< 0.05). MCH values on D2 and D8were different compared to those on D60 (P< 0.05).
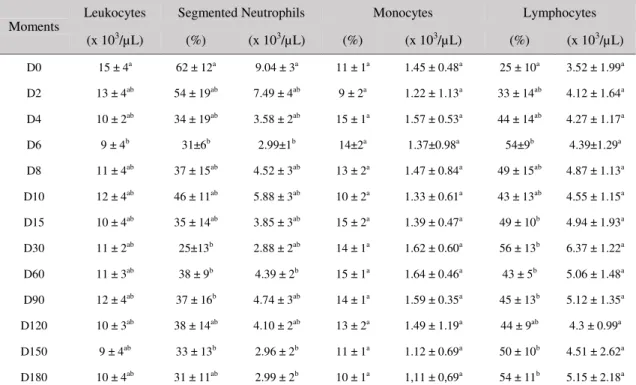
The means and standard deviations of the
leukogram components and multiple
comparisons between time points are shown in Table 3.
Total leukocytes decreased from birth up to D6, after which time, the values increased slightly and remained constant from D8 to D180. The difference between the values on D0 and those on D6 was statistically significant (P< 0.05).
Relative and absolute values for segmented neutrophils showed some variations from D0 to D180. Relative values (%) on D0were higher than those on D6, 30, 60, 90 and 150 (P< 0.05).
Absolute values (x103/µL) on D0 were
significantly different from those on D6, D60, D150 and D180 (P< 0.05).
The relative and absolute values for monocytes varied slightly from D0 to D180. There were no statistically significant differences between the time points, despite the slight variations observed during this study. Relative and absolute lymphocyte values increased from D0 up to D180, and displayed some variations on D6, D30-D90 and D150-180. The number (%) of lymphocytes on D0 was lower than that on D6, D15, D30, D60, D90, D150 and D180 (P< 0.05).
Rod neutrophils and eosinophils were not detected at some of the time points included in this study. The minimum and maximum values observed for rod neutrophils were 1% (0.1 ×
103/µL) on D6 and 3.8% (0.6 x 10³/µL) on D2,
respectively. Eosinophil numbers varied between
1% (0.1 × 10³/µL) on D90 and 3% (0.2 ×
103/µL) on D150. There were no statistically
significant differences between time points for these parameters.
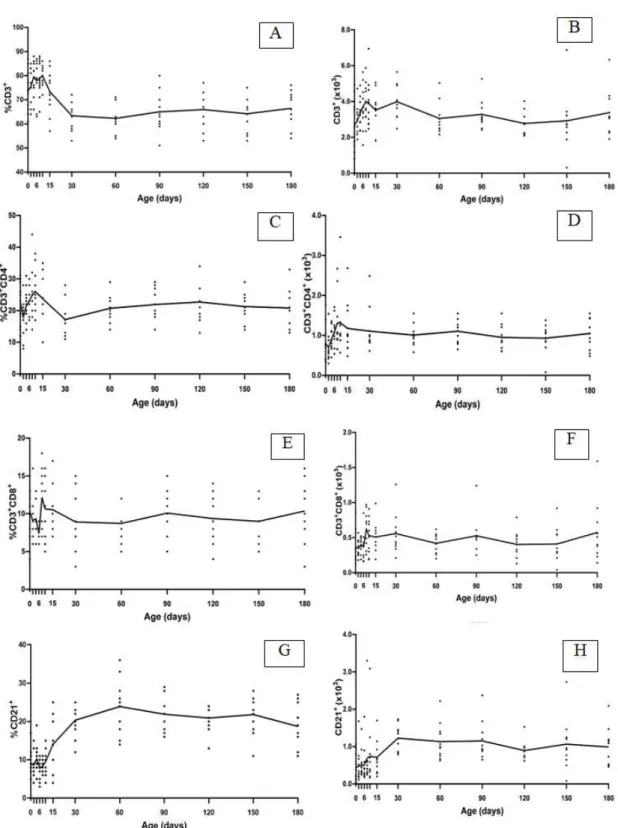
The means and standard deviations for lymphocyte subsets and multiple comparisons between time points are shown in Figure 1. Variations were detected in the proportions of
Table 2. Means and standard deviations of erythrogram components of Holstein calves from birth up to six months of age
Moments RBC
(x 106 /µL)
HGB (g/dL)
HCT (%)
MCV (fL)
MCH (pg)
MCHC (%)
D0 8.5±1.3a 12.5±2.3a 39±6a 46 ± 1af 14.5±1.3ab 32±2a
D2 7.2±1.3ab 10.5±1.9a 31±5ab 43 ± 1ac 14.5±0.7a 33±2a
D4 6.8±1.4b 10.0±1.8a 30±4b 42 ± 2acd 13.8±1.7ab 33±4a
D6 7.1±1.4b 9.3±2.5a 30±4b 42 ± 2cde 13.2±3.0ab 31±8a
D8 7.5±1.2ab 10.2±1.3a 31±4b 41 ± 1de 13.5±0.9a 33±4a
D10 7.7±1.1ab 9.7±1.6a 31±4b 41 ± 2ae 13.3±1.1ab 33±3a
D15 8.5±1.2ab 10.0±1.6a 33±3ab 40 ± 3bcde 12.1±1.8ab 31±5a D30 10±1.4ab 11.1±1.6a 36±6ab 37 ± 3bde 11.7±1.2ab 31±3a
D60 9.8±1.7ab 10.0±2.0a 34±6ab 37 ± 2b 10.6±1.1b 29±3a
D90 9.2±1.8ab 10.8±1.1a 33±4ab 38 ± 4bcde 12.3±1.6ab 33±2a D120 9.6±0.5ab 10.1±0.6a 33±5ab 36 ± 3b 11.2±1.2ab 31±2a D150 9.7±1.7ab 10.1±1.2a 34±6ab 36 ± 2bg 10.7±2.1ab 29±2a D180 9.2±2.1ab 9.7±1.5a 33±7ab 33 ± 9bdef 10.3±2.0ab 29±5a (RBC) red blood cells; (MCV) mean corpuscular volume; (MCH) mean corpuscular hemoglobin; (MCHC) mean corpuscular hemoglobin concentration. Lower case letters in the same column show difference between moments (P< 0.05) using ANOVA for repeated measure.
Table 3. Means and standard deviations of leukogram components of Holstein calves from birth up to six months of age
Moments
Leukocytes Segmented Neutrophils Monocytes Lymphocytes
(x 103/µL) (%) (x 103/µL) (%) (x 103/µL) (%) (x 103/µL)
The mean relative values of CD3+ T lymphocytes did not change substantially in the first 10 days of life and then decreased (D15). The proportion
of CD3+ (%) at D10 was higher than that
observed on D30, D60, D90, D150 and D180 (P< 0.05). There were no statistically significant
differences in the absolute values of CD3+ cells
between time points.
The mean of absolute and relative values of the
subsets CD4+ and CD8+ showed slight variations
during the course of the study. There were no statistically significant differences between time points for these parameters.
The proportions (%) and absolute values of
CD21+ lymphocytes increased significantly from
D0 up to D30–D180. Differences in both
parameters were detected between the early time points of D0, D2, D4, D8, D15 and the later time points of D30, D60, D90, D120 and D150.
By clinical parameters, all calves were healthy
immediately after birth (D0). Navel
inflammation and diarrhea were the most frequently observed disease conditions during the first fifteen days after birth. The frequencies of navel inflammation were 20% (2/10) from D2 up to D10 and increased to 50% by D15 (5/10,). Four cases of diarrhea were detected only on D15.
DISCUSSION
This study followed the hematological and immunological profiles of Holstein calves from birth up to 180 days of life.
Hemoconcentrationwas observed at birth, higher values of RBC, HGB and HCT in the first days
of life are related of a physiological
hemoconcentration due to fetal growth in a placental environment with low concentrations
of O2. The components of the erythrogram are
consistent with established reference ranges,
according to Novo et al., (2015), Benesiet al.
(2012a); Brun-Hansen et al., (2006). The
subsequent decrease values is associated with the higher oncotic pressure and plasma dilution after colostrum administration. Moreover, low serum iron levels in neonates can compromise
erythropoiesis (Mohriet al., 2004; Mohriet al.,
2007).
The MCV values of newborn calves were highest at birth (46 fL) and then decreased subsequently. Erythrocyte size also decreased with advancing age, which probably occurs through the replacement of RBCs containing fetal HGB by
smaller RBCs containing adult HGB (Knowles et
al., 2000; Lee et al., 1971). The decrease in
hematimetric rates was concomitant with the
increase of RBCs from the 10th day of life. These
data are in agreement with variations reported in
previous studies (Brun-Hansen et al., 2006).
The leukocytosis by neutrophilia observed around birth might be caused by the increase of maternal and fetal cortisol at the end of pregnancy and during labor. No evidence of
eosinopenia profile was reported (Fagliariet al.,
1998; Benesiet al., 2012b), since eosinophils cell
concentration of calves are in small numbers in the blood of both young calves and adult animals. Transient increase in circulating neutrophils occurs because of the release of bone marrow cells and the marginal compartment for blood circulation. Furthermore, lower expression
of L-selectin adhesion molecules on the surface
of these cells in the presence of high cortisol
levels has been reported (Nagahataet al., 2000).
Despite the reported neutrophilia, it is worth noting that the phagocytosis and bactericidal activity are decreased in neonate calves (Hauser
et al., 1986).
Leukogram analysis and phenotyping of
lymphocyte subsets allowed us to conclude that the total number of lymphocytes increased because of the increase in the proportion of
CD21+ B cells after 30 days of life. The relative
level of B lymphocytes detected in the first week after birth was low (9%), a value slightly higher than the mean value of 4% reported by
Kampenet al. (2006).
The cellular profile in the calves during the first weeks of life can be influenced by variations in the levels of progesterone, prostaglandin, and cytokines IL-4 and IL-10 transferred from dams
to newborn calves through pregnancy (Chase et
al., 2008). Despite the Th2 cytokine profile at
birth, the increase in the number of B
lymphocytes presenting CD21+ receptor, which
is expressed only in activated B cells, was
The late activation of B cells in neonates may be related to the low number of dendritic cells and low expression of major histocompatibility complex (MHC) class II by monocytes during
the neonatal period (Reberet al., 2008a; Reberet
al., 2008b). Once a pathogen is recognized, it is
internalized and processed by antigen-presenting cells (APCs). The peptides generated by APCs are expressed on the membranes of MHC II cells, which present the peptide to helper T
lymphocytes (CD4+). The binding between MHC
II and T lymphocyte receptor triggers events that result in the clonal expansion of T helper cells and enhanced cytokine production, which stimulate the proliferation of B lymphocytes and their differentiation to memory cells and plasma cells, which in turn produce antigen-specific immunoglobulins (McHeyzer-Williams, 2003).
Activated B cells could also act as APCs (McHeyzer-Williams, 2003). However, the
reduced density of the CD21+ population in the
first month of life can negatively impact B cell self-stimulation.
B cells migrate from the bone marrow to the secondary lymphoid tissues, where they go through the maturation process. Initially, naïve B cells are located in the primary lymphoid follicles, where they bind antigens and become activated. Then, the cells migrate to the germinal center portion for the selection and clonal expansion of antigen-specific B cells, where B lymphocytes are transformed to antibody-secreting plasma cells and memory B cells. The germinal center grows in size as the immune response is triggered by pathogens. It regresses and finally disappears when the infection is resolved. Germinal centers are present in the
lymph nodes for about 3–4 weeks after initial
antigen exposure, and subsequently leave via the efferent lymphatic vessels (Rudinand Thompson, 1998). The increase in activated B lymphocytes observed in this study could have been triggered by antigenic exposure. This phenomenon indicates that the maturation of specific immune system progresses in small steps from birth until
puberty. Kampenet al. (2006) and Chatthaet al.
(2009) also reported a similar increase in lymphocytes after 30 days.
The low number of B lymphocytes may be responsible for colonization and infection by
extracellular microorganisms that cause diarrhea and navel inflammation. These diseases were the main cause of data exclusion in this experiment on D8, D10 e D15.
The proportion of CD3+ T lymphocytes
decreased from the 10th day of life. Variations in
the proportions of CD3+ T lymphocytes could
not be compared with those observed in the other studies owing to the scarcity of longitudinal studies evaluating the expression of this receptor from birth up to 6 months of age.
The proportions of CD4+ and CD8+ T
lymphocytes were stable throughout the study period, with values of 23% and 10% at birth, and 21% and 10%, respectively, at 6 months of age. A similar proportion has been reported in earlier
studies (Allen et al., 1996; Ayoub and Yang,
1996; Kampenet al., 2006; Kulberget al., 2004;
Wilson et al., 1996).
Hematologic and immune components of calves, as determined by hemoconcentration, stress
leukogram, and the predominance of CD3+ T
cells,varied with age, especially in the first
month of life, when compared to CD21+ Bcells
until 30 days of age. Subsequently, the lymphocyte populations increased due to the
increase in CD21+ B cells.
Variation in the cell populations indicates that the neonatal period is a phase of increased susceptibility to infectious diseases. Therefore, extra care is neededto maintain the health and survival of the calves during this phase (Murray and Leslie, 2013).
CONCLUSION
This research highlights the neonatal period as a critical stage in calf rearing. The study results also indicate that hematological profiles and subsets of lymphocytes of calves were functional and able to generate immune response in the calves after 30 days of life.
ACKNOWLEDGEMENTS
REFERENCES
ALLEN, L.J.; KABBUR, M.B.; CULLOR, J.S.
et al. Alterations in blood lymphocyte
subpopulations and hematologic values in neonatal calves after administration of a
combination of multiple-antigen vaccines. J. Am.
Vet. Med. Assoc., v.209, p.638-642, 1996.
AYOUB, I.A.; YANG, T.J. Age-dependent
changes in peripheral blood lymphocyte
subpopulations in cattle: a longitudinal study.
Dev. Comp. Immunol., v.20, p.353-363, 1996.
BARRINGTON, G.M.; PARISH, S.M. Bovine
neonatal immunology. Vet. Clin. N. Am. Food
Anim. Pract., v.17, p.463-476, 2001.
BENESI, F.J.; TEIXEIRA, C.M.C.; LEAL,
M.L.R. et al. Leukograms of healthy Holstein
calves within the first month of life. Pesqui. Vet.
Bras., v.32, p.352-356, 2012b.
BENESI, F.J.; TEIXEIRA, C.M.C.; LISBOA,
J.A.N. et al. Eritrograma de bezerros sadios, da
raça Holandesa, no primeiro mês de vida. Pesqui.
Vet. Bras., v.32, p.357-360, 2012a.
BRUN-HANSEN, H.C.; KAMPEN, A.H.;
LUND, A. Hematologic values in calves during the first 6 months of life. Vet. Clin. Pathol.,v.35, p.182-187, 2006.
CHASE, C.C.; HURLEY, D.J.; REBER, A.J. Neonatal immune development in the calf and its
impact on vaccine response.Vet. Clin. N. Am.
Food Anim. Pract., v.24, p.87-104, 2008.
CHATTHA, K.S.; FIRTH, M.A.; HODGINS, D.C.; SHEWEN, P.E. Age related variation in expression of CD21 and CD32 on bovine
lymphocytes: a cross-sectional study.Vet.
Immunol. Immunopathol.,v.130, p.70-78, 2009.
DELLA LIBERA, A.M.M.P.; BLAGITZ, M.G.;
BATISTA, C.F. et al. Quantification of B cells
and T lymphocyte subsets in bovine leukemia
virus infected dairy cows. Semina, v.33,
p.1487-1494, 2012.
FAGLIARI, J.J.; SANTANA, A.E.; CAMPOS FILHO, E.; CURI, P.R. Blood constituents of the newborn Nelore cattle (Bosindicus), Holstein
cattle (Bostaurus), and Murrah buffalo
(Bubalusbubalis). Arq. Bras. Med. Vet. Zootec.,
v.50, p.253-262, 1998.
FEITOSA, F.L.F. Semiologia de recém-nascidos
ruminantes e equídeos.Semiologia veterinária: a arte do diagnóstico. 3.ed. São Paulo: Roca, 2014. 627p.
HAUSER, M.A.; KOOB, M.D.; ROTH, J.A. Variation of neutrophil function with age in
calves. Am. J. Vet. Res., v.47, p.152-153, 1986.
KAMPEN, A.H., OLSEN, I.; TOLLERSRUD,
T.; STORSET, A.K. et al. Lymphocyte
subpopulations and neutrophil function in calves
during the first 6 months of life. Vet. Immunol.
Immunopathol., v.113, p.53-63, 2006.
KNOWLES, T.G.; EDWARDS, J.E.;
BAZELEY, K.J. et al. Changes in the blood
biochemical and haematological profile of
neonatal calves with age.Vet. Rec., v.147,
p.593-598,2000.
KULBERG, S.; BOYSEN, P.; STORSET, A.K. Reference values for relative numbers of natural
killer cells in cattle blood. Dev. Comp. Immunol.,
v.28, p.941-948, 2004.
LEE, C.K.; ODELL, G.V.; ELIOT, F.P. et al.
Postnatal loss of bovine fetal hemoglobin. Am. J.
Vet. Res.v.32, p.1039, 1971
LIEBLER-TENORIO, E.M.;
RIEDEL-CASPARI, G.; POHLENZ, J.F. Uptake of colostral leukocytes in the intestinal tract of
newborn calves. Vet. Immunol. Immunopathol.,
v.85, p.33-40, 2002.
MCHEYZER-WILLIAMS, M.G. B cells as
effectors. Curr. Opin. Immunol.,v.15, p.354-361,
2003.
MOHRI, M.; SARRAFZADEH, F.; SEIFI, H. A.; FARZANEH, N. Effects of oral iron
supplementation on some haematological
parameters and iron biochemistry in neonatal
dairy calves.Comp. Clin. Pathol., v.13, p.9-42,
2004.
MOHRI, M.; SHARIF, K.; EIDI, S. Hematology and serum biochemistry of Holstein dairy calves: age related changes and comparison with blood
composition in adults. Res. Vet. Sci., v.83,
p.30-39, 2007.
MURRAY, C.F.; LESLIE, K.E. Newborn calf vitality: risk factors, characteristics, assessment,
resulting outcomes and strategies for
NAGAHATA, H.; HIGUCHI, H.; YAMASHIKI, N.; YAMAGUCHI. M. Analysis of the functional characteristics of L-selectin and its expression on normal and CD18-deficient
bovine neutrophils.Immunol.CellBiol., v.78,
p.264-271, 2000.
NOVO, S.M.F.; FREITAS, R.L.; SILVA,
C.P.D.C. et al. Hematological adaptation in
Holstein calves during the neonatal period. Braz.
J. Vet. Res. Anim. Sci, v.52, p.212-216, 2015.
PARK, Y.H.; FOX, L.K.; HAMILTON, M.J.; DAVIS, W.C. Bovine Mononuclear leukocyte
subpopulations in peripheral blood and
mammary gland secretions during lactation. J.
Dairy Sci., v.75, p.998-1006, 1992.
REBER, A.J.; DONOVAN D.C.; GABBARD, J.
et al. Transfer of maternal colostral leukocytes promotes development of neonatal immune
system: I- effects on monocyte lineage cells. Vet.
Immunol. Immunopathol.,v.123, p.186-196, 2008a.
REBER, A.J.; DONOVAN D.C.; GABBARD, J.
et al. Transfer of maternal colostral leukocytes promotes development of neonatal immune
system: II- Effects on neonatal lymphocytes. Vet.
Immunol. Immunopathol.v.123, p.305-313, 2008b.
REBER, A.J.; LOCKWOOD, A.; HIPPEN, A.R.; HURLEY, D.J. Colostrum induced phenotypic and trafficking changes in maternal mononuclear cells in a pheripheral blood leukocyte model for study of leukocyte transfer
to the neonatal calf. Vet. Immunol.
Immunopathol.,v.109, p.139-150, 2006.
RUDIN, C.M.; THOMPSON, C.B. B-Cell
Development and maturation. Semin.
Oncol.,v.25, p.435-446, 1998.
WEGMANN, T.G.; LIN, H.; GUILBERT, L.;
MOSMANN, T.R. Bidirectional cytokine
interactions in the maternal-fetal relationship: is successful pregnancy a TH2 phenomenon?
Immunoly. Today, v.14, p.353-356, 1993.
WILSON, R.A.; ZOLNAI, A.; RUDAS, P.; FRENYO, L.V. T-cell subsets in blood and lymphoid tissues obtained from fetal calves,
maturing calves, and adult bovine. Vet. Immunol.