Least Limiting Water range and Load Bearing
CapaCity oF soiL under types oF traCtor-traiLers
For meChaniCaL harvesting oF green sugarCane
antonio higino Frederico pereira(1), antonio Carlos tadeu vitorino(2), eber augusto
Ferreira do prado(1)*, anderson Cristian Bergamin(3), munir mauad(2) and
heverton ponce arantes(1)
(1) Universidade Federal da Grande Dourados, Faculdade de Ciências Agrárias, Programa de Pós-graduação em Agronomia, Dourados, Mato Grosso do Sul, Brasil.
(2) Universidade Federal da Grande Dourados, Faculdade de Ciências Agrárias, Dourados, Mato Grosso do Sul, Brasil.
(3) Universidade Federal de Rondônia, Departamento de Agronomia, Campus de Rolim de Moura, Rolim de Moura, Rondônia, Brasil. * Corresponding author.
E-mail: eberprado@hotmail.com
aBstraCt
The expansion of the sugarcane industry in Brazil has intensified the mechanization of agriculture and caused effects on the soil physical quality. the purpose of this study was to evaluate the limiting water range and soil bearing capacity of a Latossolo vermelho distroférrico típico(Rhodic Hapludox) under the influence of different tractor-trailers used in mechanical sugarcane harvesting. the experiment was arranged in a randomized block design with five replications. The treatments consisted of green sugarcane harvesting with: harvester without trailer (t1); harvester with two trailers with a capacity of 10 mg each (t2); harvester with trailer with a capacity of 20 mg (t3) and harvester and truck with trailer with a capacity of 20 mg (10 mg per compartment) (t4). the least limiting water range and soil bearing capacity were evaluated. the transport equipment to remove the harvested sugarcane from the field (trailer) at harvest decreased the least limiting water range, reducing the structural soil quality. the truck trailer caused the greatest impact on the soil physical properties studied. the soil load bearing capacity was unaffected by the treatments, since the pressure of the harvester (t1) exceeded the pre-consolidation pressure of the soil.
Keywords: pre-compaction pressure, water behavior, Saccharum spp.
introduCtion
In Brazil, sugarcane (Saccharum spp.) has a
considerable historical socio-economic significance.
In the Center-South region of Brazil, sugarcane is harvested from April through October (Horii, 2004), which is a period of low rainfall. On the other hand, the second growing season tends to be shortened (Severiano et al., 2009), which leads
to traffic of harvest machines at high soil water
content. This situation of shortened late seasons is more characteristic in regions where rainfall is more evenly distributed throughout the year. In
these areas, traffic on soil at unsuitable levels of
water content has promoted compaction by affecting the physical quality and resulted in drawbacks for plant growth and development, diminishing yields over the years (Souza et al., 2006).
Thus, indicators that reflect existing physical soil
conditions should be established to support better management practices. The compressibility curve can be proposed as an indicator of the soil physical quality, which can be used to minimize soil physical degradation, since it can show changes in the soil structure (Dias Junior and Pierce, 1996).
Degradation of soil structure through the use of farm machinery under unsuitable moisture conditions has been the main reason for losses in crop yield potential. With models of load bearing capacity (LBC), it was found that the best time for soil management practices, depending on soil moisture, differs between crops, varying according to the soil moisture and density (Bergamin et al., 2010b).
Another indicator of soil physical quality is the least limiting water range (LLWR), which can be
used to identify soil physical limitations and thus assist producers in choosing better management techniques (Bergamin et al., 2010a). The LLWR is a good indicator of soil physical quality because it incorporates the plant growth limitations due to aeration, water availability and soil penetration resistance in a single parameter (Silva et al., 1994). This indicator is correlated with plant growth (Tormena et al., 2007).
The changes introduced in the structural soil
quality, expressed by LBC and LLWR, deserve
attention and analysis in research. The objective of this study was to evaluate the effect of different tractor-trailers used in mechanical harvesting of green sugarcane on the load bearing capacity and limiting water range of a very clayey Latossolo Vermelho Distroférrico típico (Rhodic Hapludox).
materiaL and methods
The study was conducted in a commercial cultivation area on the Fazenda Dallas in the municipality of Ponta Porã, MS, in the growing season 2012/2013 (latitude 22º 24’ 58” S, longitude 55° 05’ 30” W; 410 m asl). The climate is Cwa,
according to the Köppen classification, with annual
averages of 1,400 mm rainfall and 18 °C in the colder and 25 °C in the warmer months, respectively.
The soil in the area was classified as a very clayey
Latossolo Vermelho Distroférrico típico (Rhodic
Hapludox), with 601 g kg-1 clay, 219 g kg-1 silt and 180 g kg-1 sand (Donagema et al., 2011)
The experiment was installed in a commercial
sugarcane (Saccharum spp) field with plant cane
(first crop), in August 2013. The area was prepared
RESUMO: InterVaLo HíDrICo ÓtImo e CapaCIDaDe De Suporte De Carga
Do SoLo Sob tIpoS De tranSborDoS em CoLHeIta meCanIzaDa De Cana Crua
a expansão do setor sucroenergético brasileiro intensificou a mecanização da lavoura com consequências na qualidade física dos solos. objetivou-se com este trabalho avaliar o intervalo hídrico ótimo e a capacidade de suporte de carga de um Latossolo Vermelho distroférrico típico, sob a influência de diferentes transbordos utilizados na colheita mecanizada de cana. o delineamento experimental foi de blocos ao acaso com cinco repetições. os tratamentos utilizados foram colheita de cana crua com: colhedora sem transbordo (t1); colhedora com dois transbordos com capacidade de 10 mg cada (t2); colhedora com transbordo de capacidade de 20 mg (t3); e colhedora e caminhão transbordo com capacidade de 20 mg (10 mg cada compartimento) (t4). Foram avaliados o intervalo hídrico ótimo e a capacidade de suporte de carga. observou-se que os equipamentos de transporte para a retirada da cana colhida de dentro da área cultivada (transbordo) utilizados na colheita promovem diminuição do intervalo hídrico ótimo, reduzindo a qualidade estrutural do solo. o caminhão transbordo causou maior impacto nos atributos físicos do solo estudados. a capacidade de suporte de carga do solo não foi alterada pelos tratamentos, pois a pressão exercida pela colhedora (t1) é maior que a pressão de pré-consolidação do solo.
for planting by disk harrowing with cutting discs 34”, subsoiling with a sugarcane subsoiler to a depth of 0.45 m, and moderate harrowing with cutting disks of 28”. Planting was fully mechanized (April 2012), using variety RB 85 5156.
The experiment was arranged in strip plots, in
a randomized block design with four treatments, evaluated at two depths (0.10 and 0.20 m), with five replications. The treatments consisted of: T1 - harvester without trailer; T2 - harvester and tractor coupled with two trailers with 10 Mg capacity each; T3 - harvester and tractor coupled with a trailer with 22 Mg capacity; and T4 - harvester and truck with two trailers with 10 Mg capacity each.
In all treatments except T1, the harvested cane
transport equipment was loaded with 20 Mg of sugarcane. The collection rate was 5 km h-1.
The combine used in this experiment was a John
Deere sugarcane harvester, model 3520, with 335 cv (246 kW) raw power and 17 Mg weight, distributed on two tracks. One of the towable trailers used in the
experiment was a Santa Izabel model TLSI, with a weight of 8.0 Mg, distributed on four high flotation
tires Model 600/50-22.5 with inflation pressure of 0.38 MPa, with a load capacity up to 10 Mg of sugarcane, being used two tractor-trailers coupled to the tractor with a total weight of the load of 46 Mg (T2). The other tractor-trailer, with a capacity of up to 22 Mg of sugarcane, was a Teston Giant 22,000 BP model, with a mean weight of 12.5 Mg, distributed on eight tires, four front tires Model 550/45-22.5 with
inflation pressure of 0.29 MPa and four rear tires Model 600/50-22.5 with 0.38 MPa inflation pressure,
considered high, with a total weight of the loaded set of 43 Mg (T3). In addition, a truck model 2628 with
a weight of 17 Mg distributed on 10 low-flotation tires, model 1000/R20, inflation pressure 0.76 MPa,
with two trailers 10 Mg each with a total weight of the loaded vehicles of 37 Mg (T4).
After sugarcane harvesting and the wheeling
in traffic treatments, five trenches were opened
for each of the four treatments, at a distance of 0.40 m from the sugarcane row where undisturbed soil samples were collected in four 83 cm3 metal cylinders (radius 3.22 cm, height 2.55 cm). Seven samples per depth and plot were collected, totaling 70 samples per treatment (35 samples per depth).
Each group of 35 samples per treatment and
depth was divided into seven groups of five samples, and each group exposed to the following matric
potentials: -0.006, -0.01, -0.033, -0.066, -0.1, -0.3, and -1.5 MPa, using a porous plate apparatus (-0.006 MPa) and Richards chamber for the other potentials, as suggested by Klute (1986).
When the pre-saturated sample reached equilibrium at the potentials cited above, these were weighed and then analyzed for soil penetration resistance, using an electronic static penetrometer
at a constant penetration speed of 0.01 m min-1 (cone base diameter 4 mm, angle 30º).
The LLWR was determined as described by Silva et al. (1994). The critical values of water content associated with the soil matric potential, penetration resistance and aeration porosity,
represented respectively by water content at field capacity (θFC), potential of -0.01 MPa (Reichardt, 1988); the water content at the permanent wilting
point (θPWP), potential of -1.5 MPa (Savage et al., 1996); the volumetric water content of the soil in
which the soil penetration resistance (θPR) reaches 2.0 MPa (Taylor et al., 1966); and the volumetric
water content at which air-filled porosity (θAP) is 0.10 m3 m-3 (Grable and Siemer, 1968).
The θFC and θPWP values were calculated by the
mathematical model [θ = e(a + bDs) ψc], proposed by Silva et al. (1994), to adjust the original data, which incorporates the variable bulk density in the function used by Ross et al. (1991), in which
θ is the soil water content (m3 m-3); Bd, the bulk density (Mg m-3); ψ the matric potential (MPa);
and the letters “a”, “b” and “c” are empirical fitting coefficients of the model.
The PR values of all samples with known Bd and
θ are adjusted mathematically, using the model type (RP = dθe Dsf), proposed by Busscher et al. (1990), in which PR is soil penetration resistance (MPa);
θ the soil water content (m3 m-3); Bd the soil bulk density (Mg m-3); and the letters “d”, “e” and “f” are
the empirical fitting coefficients of the model. This equation determined the critical value of θ so that the PR did not exceed 2.0 MPa (θPR), depending on Bd. For this, PR is replaced in the equation by the value of 2.0 MPa, regarded as limiting with regard to the LLWR calculation.
The value of θAP was computed by the model
{θAP = [1 - (Bd/Pd)] - 0.10}, in which θAP is the
volumetric soil water content where the water-filled
porosity is 0.10 m3 m-3; Bd is the soil density (Mg m-3) and Pd the particle density (Mg m-3), adopting the value of 2.65 Mg m-3 as mean particle density.
The fitting of the mathematical models and
calculation of the coefficients “a”, “b”, “c”, “d”, “e” and
“f” was performed by nonlinear regression.
The correlation coefficients (r) of the adjusted
water retention curves were subjected to the F test, according to Blainski et al. (2009, 2012)
After determining the penetration resistance,
the uniaxial compression of the same evaluated
samples was tested by a consolidometer, model CnTA-IHM/BR-001/07, according to Bowles (1986)
and modified by Dias Junior (1994). The pressures
applied to each sample were: 25; 50; 100; 200; 400; 800; and 1,600 kPa, each being applied until
90 % of the maximum deformation was achieved (Taylor, 1948). After each uniaxial compression
to determine the water content and bulk density by the volumetric ring method, as suggested by Donagemma et al. (2011).
The soil compression curve was obtained by a method proposed by Dias Junior and Pierce (1995).
Then, the load bearing capacity (σp) with water content values (θ) were adjusted to a decreasing exponential regression of the type [σp = 10(a + bθ)],
proposed by Dias Junior (1994), determining the models of the LBC soil load bearing capacity. The letters “a” and “b” represent the empirical model fitting coefficients, i.e., the linear and angular
coefficient, respectively.
The models were compared by the homogeneity test of linear models described by Snedecor and Cochran (1989). To obtain the linear models from the
exponential model [10 σp = (a + bθ)], the logarithm
was applied to the preconsolidation pressure values,
resulting in an equation of the type σp = a + log bθ.
The homogeneity test of linear model considers two models, which were compared by the analysis of the intercept “a”, slope “b” and data homogeneity (F).
The adjusted curves of load bearing capacity
had coefficients of determination (R2) which were tested by the F test as proposed by Blainski et al. (2009, 2012).
resuLts and disCussion
All adjusted curves of soil water retention in the
soil had significant determination coefficients (R2) by the F test.
It is clear that the adjustment coefficients of the
water retention curve in the soil were statistically
significant (p<0.01), since the confidence interval of the coefficients does not include the value zero, except for coefficient “b” that was not significant in treatments T1 and T4 and the coefficient “c” in T1,
at a depth of 0.10 m (Blainski et al., 2009; 2012).
At 0.20 m depth, the coefficients “b” and “c” were not significant for T3, in addition to coefficient “a” for T4.
The confidence interval of the adjustment
coefficients “d”, “e” and “f” of the soil penetration
resistance curve does not include the value zero, allowing the conclusion that these were statistically
significant (p<0.01), as described by Blainski et al. (2009, 2012), except for coefficient “d” in T3 and T4,
at 0.10 m depth.
The variations in matric potentials at the critical
limits corresponding to field capacity (-0.01 MPa),
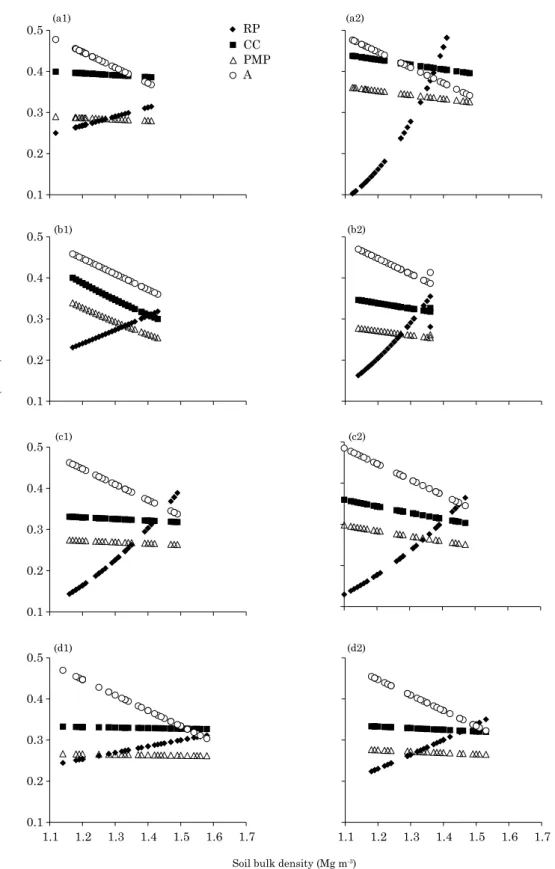
aeration porosity of 10 m3 m-3, the permanent wilting point (-1.5 MPa), and penetration resistance of 2.0 MPa were recorded for each value of bulk density in the treatments evaluated at depths of 0.10-0.20 m (Figure 1).
The values of θCC, θPWP at the critical limits of water potential in the soil increased according to Bd (Figure 1), as similarly observed by Bergamin et al. (2010a) and Garbiate et al. (2011), who studied the same soil class.
In clayey Latosols, compaction or increase in Bd affects the inter-aggregate pore space, reducing the diameter of the larger pores so as to become more
efficient in retaining water at high potentials (θcc) (Kertzman, 1996). This reduction in the diameter of the larger pores can also be seen in the trend of the curve of macroporosity (Figure 1), which decreases with Bd, which is detrimental to the soil quality in the study area.
At the depth of 0.20 m, the coefficients “d” in treatment T3 and “e” in treatment T4 were
not significant.
At a low potential, the positive relationship
between θPWP and Bd is due to the larger mass of particles with high surface adsorption, since the compaction does usually not affect microporosity.
Higher Bd values increase the approximation of the
solid particles and internal friction between particles, increase soil compressibility, and consequently the compaction values, primarily in the surface layers (Araujo Junior et al., 2011; Pacheco and Cantalice, 2011; Souza et al., 2012).
At the highest Bd values, the LLWR was reduced in all treatments at a depth of 0.10 m, where the upper limit of porosity of aeration is
θAP, which decreases as bulk density increases and the lower limit of soil penetration resistance
is θPR, which increases parallel to the increase in Bd. This reduction in LLWR observed for high density values was related to the fact that when
the values of θFC, θPWP and θPR increase and θAP values decreases, LLWR can be zero, when the upper and lower limits meet. Similar results were also reported by Silva et al. (1994), Tormena et al.
(2007), Serafim et al. (2008), and Lima et al. (2012).
In soils with lower structural quality, LLWR
is primarily reduced by θAP (Lima et al., 2012). Kaiser et al. (2009) studied no-tillage management and found that in this system, soil penetration resistance is the lower limit of LLWR and aeration the upper limit, because an increase in Bd and reduction in macroporosity are observed.
Treatment T1, despite the lower total weight than in the others, induced a reduction in LLWR at similar
intensity as the others. This can be explained by the pressure of the sugarcane harvester that exceeded the
support capacity of this soil type, increasing Bd and
0.1 0.2 0.3 0.4
0.5 RP
CC PMP A
0.1 0.2 0.3 0.4 0.5
0.1 0.2 0.3 0.4 0.5
0.1 0.2 0.3 0.4 0.5
1.1 1.2 1.3 1.4 1.5 1.6 1.7 1.1 1.2 1.3 1.4 1.5 1.6 1.7
(a1)
(b1)
(c1)
(d1)
(a2)
(b2)
(c2)
(d2)
Soil water content (m
3 m -3)
Soil bulk density (Mg m-3)
Figure 1. Variation of water content at field capacity (θFC), permanent wilting point (θpWp), aeration
porosity of 0.10 m3 m-3 (θ
ap) and soil penetration resistance of 2.0 MPa (θpr) depending on the density
In soils with adequate physical properties, LLWR corresponds to the available water range, with the
field capacity as the upper limit and the permanent
wilting point the lower limit (Calonego et al., 2011). However, LLWR is decreased when aeration and soil
penetration resistance replace the field capacity and
permanent wilting point as upper and lower limits, respectively (Lima, 2011).
All fitted curves of the LBC models had significant determination coefficients (R2) at 1 % by the F test The confidence interval of the adjustment
coefficients of the LBC models does not include the
value zero, which allows the conclusion that these
were statistically significant (p<0.01), as described
by Blainski et al. (2009, 2012).
When the difference between the values of linear
and angular coefficients were smallest by the LBC models, the σp range is smaller or the curves of LBC models flattened during soil moisture variations
(Pacheco and Cantalice, 2011).
The estimated values of the estimated parameters “a” and “b” of the LBC model, at both depths, ranged from 3.31 (T2) to 3.44 (T4) and -2.20 (T4) to -1.83 (T2 and T3), respectively. The R2 of LBC models ranged from 0.78 to 0.87.
To evaluate possible changes in soil structure caused by the different treatments, the LBC models were compared by the homogeneity test of linear models (Snedecor and Cochran, 1989) at the different depths, for each treatment. The LBC models at the depths of 0.10-0.20 m were not homogeneous; as a result, the LBC values were different at these depths.
The different types of trailers have a significant influence on the LBC model, based on the F test of
data homogeneity of Snedecor and Cochran (1989), at both depths.
The soil LBC, at a depth of 0.10 m, had the
following descending order of σp for the same
moisture level: T4>T3>T2.
In all LBC models in the different treatments, σp varied significantly and inversely with θ (Figures 2
and 3). The reason is that water acts as a lubricant in the soil and reduces the internal friction between the particles and shear strength (Pacheco and Cantalice, 2011), allowing a greater accommodation of compressible particles in the process (Lima and
Silva, 2006; Silva et al., 2009). This exponential decrease in σp with increasing θ (Figures 2 and 3),
according to the soil compressibility model proposed by Dias Junior (1994), was applied by several authors (Araujo Junior et al., 2011; Pires et al., 2012; Souza et al., 2012).
These results support the recommendations of Ajayi et al. (2009), that mechanized operations must be performed based on the LBC, since at high water contents of the soil, the agricultural
and environmental sustainability are threatened by damage to the soil structural quality. It is also
noteworthy that at the same fixed water content in the soil, lower σp values indicate more porous soils
(Lima, 2011).
The organic C content in topsoil layer is higher, which makes the soil more friable (crumbly) (Araujo Junior et al., 2011). For the authors, under tensions, the resilience or recovery of the structure of a soil with higher organic C content tends to be greater, whereas the mechanical strength evaluated by LBC models is lower.
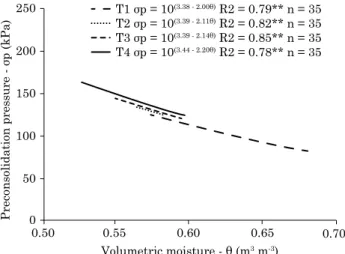
At the depth of 0.10 m (Figure 2), the LBC was very similar in the treatments; the conclusion can
be drawn that the pressure exerted by the harvester
was above the load bearing capacity of the soil, and therefore the trailers did not additionally increase the preconsolidation pressure in the treatments T2, T3 and T4.
Mechanized crop operations can result in soil compaction, with deleterious effects on the soil physical quality (Souza et al., 2012). However, prior knowledge of these effects can be a guide to preventive measures to minimize the damage by adjusting the operation conditions, since there is no other mechanism that can enhance harvest yields as optimally as mechanization.
At a depth of 0.20 m, LBC follows the descending
order of σp at the same moisture level: T4>T2>T3>T1
(Figure 3). The preconsolidation pressure in
Figure 2. Load-bearing capacity models for a Latossolo vermelho distroférrico típico a depth of 0.10 m, under mechanical harvesting of green sugarcane with different types of tractor-trailers. t1 - harvester; t2 - harvester with a tractor coupled with two trailers with a capacity of 10.5 mg each; t3 - harvester with a tractor coupled with a trailer with 22 mg capacity and t4 - harvester with a truck with two trailers with a capacity of 10 mg each.
Preconsolidation pressure - σp (kPa
) T1 σp = 10
(3.38 - 2.00θ) R2 = 0.79** n = 35
T2 σp = 10(3.39 - 2.11θ) R2 = 0.82** n = 35
T3 σp = 10(3.39 - 2.14θ) R2 = 0.85** n = 35
T4 σp = 10(3.44 - 2.20θ) R2 = 0.78** n = 35
Volumetric moisture - θ (m3 m-3)
250
200
150
100
50
0
treatment T4 was highest at this depth. This can
be explained by the type of truck tires, where the inflation pressure is the pressure transmitted to the
soil. Seraut (1990) studied different types of tires with a pressure of 0.08 to 0.16 MPa, and found that the pressure at the soil surface was similar to the
tire inflation pressure and the pressure in the soil,
at a depth of 0.30 m, was directly related to that
of the tire. Porterfield and Carpenter (1986), based
on the mean contact pressure of a tire on a rigid surface, found that the surface compaction level depends on the contact pressure, whereas deep compaction depends on the contact area, width of the tire and the load it bears.
Compaction caused by traffic of agricultural machinery is the main cause of soil physical degradation by reducing the pore space (Bergamin et al., 2010a) and increasing preconsolidation pressure (Silva et al., 2009).
Knowing the LBC is critical to determine the most appropriate moisture conditions to implement agricultural activities. When activities must be applied at high moisture levels in the soil or also when equipment at a pressure above the preconsolidation pressure is used, then measures that minimize soil density with consequent reduction of LBC are required.
ConCLusions
Trailers have a negative effect on the soil physical properties, reducing the least water range and increasing load-bearing capacity.
In the treatment with truck wheeling, due to the type of tires used, with smaller soil contact area and
higher inflation pressure, the limiting water range
was lower, the load bearing capacity greater and the compaction potential higher.
reFerenCes
Ajayi AE, Dias Junior MS, Curi n, Araujo Junior CF, Souza TTT, Vasconcelos Junior AI. Strength attributes and compaction susceptibility of Brazilian Latosols. Soil Till Res. 2009;105:122-7. Araujo Junior CF, Dias Junior MS, Guimarães PTG, Alcântara En. Capacidade de suporte de carga e umidade crítica de um Latossolo induzida por diferentes manejos. R Bras Ci Solo. 2011;35:115-31.
Bergamin AC, Vitorino ACT, Franchini JC, Souza CMA, Souza FR. Compactação em um Latossolo Vermelho distroférrico e suas relações com o crescimento radicular do milho. R Bras Ci Solo. 2010a;34:681-91.
Bergamin AC, Vitorino ACT, Lempp B, Souza CMA, Souza FR. Anatomia radicular de milho em solo compactado. Pesq Agropec Bras. 2010b;45:299-305.
Blainski E, Gonçalves ACA, Tormena CA, Folegatti MV, Guimarães RML. Intervalo hídrico ótimo num nitossolo Vermelho distroférrico irrigado. R Bras Ci Solo. 2009;33:273-81.
Blainski E, Tormena CA, Guimarães RML, nanni MR. Qualidade física de um Latossolo sob plantio direto influenciada pela cobertura do solo. R Bras Ci Solo. 2012;36:79-87.
Bowles JE. Engineering properties of soils and their measurements. 3rd.ed. Auckland: McGraw-Hill; 1986.
Busscher PJ, Willians J, Bristow KL. Equations for extending
water-retention curves to dryness. Soil Sci Soc Am J. 1990;55:923-7. Calonego JC, Borghi E, Crusciol CAC. Intervalo hídrico ótimo e compactação do solo com cultivo consorciado de milho e braquiária. R Bras Ci Solo. 2011;35:2183-90.
Dias Junior MS, Pierce FJ. A simple procedure for estimating preconsolidation pressure from soil compression curves. Soil Technol. 1995;8:139-51.
Dias Junior MS, Pierce FJ. O processo de compactação do solo e sua modelagem. R Bras Ci Solo. 1996;20:175-82.
Dias Junior MS. Compression of three soils under long-term
tillage and wheel traffic [thesis]. East Lansing, MI: Michigan
State University; 1994.
Donagema GK, Campos DVB, Calderano SB, Teixeira WG, Viana
JHn. Manual de métodos de análise de solo. 2ª ed. Rio de Janeiro: Embrapa Solos; 2011.
Garbiate MV, Vitorino ACT, Tomasini BA, Bergamin AC, Panachuki E. Erosão em entre sulcos em área cultivada com cana Figure 3. Load-bearing capacity models for a
Latossolo vermelho distroférrico típico at a depth of 0.20 m, subjected to mechanical harvesting of green sugarcane with different types of tractor-trailers. the models were not statistically different by snedecor and Cochran’s test (1989), so a single equation was adjusted. t1 - harvester; t2 - harvester with a tractor coupled with two trailers of 10.5 mg each; t3 - harvester with a tractor coupled with a trailer with 22 mg capacity and t4 - harvester with a truck with two trailers with a capacity of 10 mg each.
Preconsolidation pressure - σp (kPa
) T1 σp = 10
(3.32 - 1.88θ) R2 = 0.81** n = 35
T2 σp = 10(3.31 - 1.82θ) R2 = 0.87** n = 35
T3 σp = 10(3.31 - 1.82θ) R2 = 0.80** n = 35
T4 σp = 10(3.34 - 1.84θ) R2 = 0.79** n = 35
Volumetric moisture - θ (m3 m-3)
250
200
150
100
50
0
crua e queimada sob colheita manual e mecanizada. R Bras Ci Solo. 2011;35:2145-55.
Grable AR, Siemer EG. Effects of bulk density aggregate size,
and soil water suction on oxygen diffusion, redox potential and
elongation of corn roots. Soil Sci Soc Am J. 1968;32:180-6. Horii J. A cana-de-açúcar como matéria-prima. Visão Agríc. 2004;1:88-93.
Kaiser DR, Reinert DJ, Reichert JM, Collares GL, Kunz M.
Intervalo hídrico ótimo no perfil explorado pelas raízes de feijoeiro
em um Latossolo sob diferentes níveis de compactação. R Bras Ci Solo. 2009;33:845-55.
Kertzman FF. Modificações na estrutura do solo e no
comportamento de um Latossolo Roxo provocado pela compactação
do solo [tese]. São Paulo: Universidade de São Paulo; 1996. Klute A. Water retention: laboratory methods. In: Klute A, editor. Methods of soil analysis - physical and mineralogical methods. 2nd.ed. Madison: ASA/SSSA; 1986. p.635-62.
Lima CLR, Silva AP. Estimativa da capacidade de suporte de carga do solo a partir da avaliação da resistência à penetração. R Bras Ci Solo. 2006;30:217-23.
Lima VMP, Oliveira GC, Serafim ME, Curi N, Evangelista AR.
Intervalo hídrico ótimo como indicador de melhoria da qualidade estrutural de Latossolo degradado. R Bras Ci Solo. 2012;36:71-8. Lima VMP. Melhoria estrutural de Latossolo: indicadores de qualidade e estratégias de manejo [tese]. Lavras: Universidade Federal de Lavras; 2011.
Pacheco EP, Cantalice JRB. Compressibilidade, resistência a penetração e intervalo hídrico ótimo de um Argissolo Amarelo cultivado com cana-de-açúcar nos tabuleiros costeiros de Alagoas. R Bras Ci Solo. 2011;35:403-15.
Pires BS, Dias Junior MS, Rocha WW, Araujo Junior CF, Carvalho RCR. Modelos de capacidade de suporte de carga de um Latossolo Vermelho-Amarelo sob diferentes usos e manejos. R Bras Ci Solo. 2012;36:635-42.
Porterfield JW, Carpenter TG. Soil compaction: an index of
potential compaction for agricultural tires. Trans Am Soc Agron Eng. 1986;29:917-22.
Reichardt K. Capacidade de campo. R Bras Ci Solo. 1988;12:211-16.
Ross PJ, Willians J, Bristow KL. Equations for extending
water-retention curves to drynees. Soil Sci Soc Am J. 1991;55:923-7. Savage MJ, Ritchie JT, Land WL, Dugas WA. Lower limit of soil water available. Agron J. 1996;88:844-51.
Serafim ME, Vitorino ACT, Peixoto PPP, Souza CMA, Carvalho
DF. Intervalo hídrico ótimo em um Latossolo Vermelho distroférrico sob diferentes sistemas de produção. Eng Agric. 2008;28:654-65.
Seraut A. Le pneumatique basse pression. Bull Technol March Equip Agric Cemagref. 1990;50:33-7.
Severiano EC, Oliveira GC, Curi n, Dias Junior M. Potencial de uso e qualidade estrutural de dois solos cultivados com cana-de-açúcar em Goianésia (GO). R Bras Ci Solo. 2009;33:159-68.
Silva AP, Kay BD, Perfect E. Characterization of the least limiting water range. Soil Sci Soc Am J. 1994;58:1775-81.
Silva RB, Lanças KP, Miranda EEV, Silva FAM, Baio FHR. Estimation and evaluation of dynamic properties as indicators
of changes on soil structure in sugarcane fields of Sao Paulo
State - Brazil. Soil Till Res. 2009;103:265-70.
Snedecor GW, Cochran WG. Statistical methods. 8th.ed. Ames: Iowa State University Press; 1989.
Souza GS, Souza ZM, Silva RB, Araújo FS, Barbosa RS. Compressibilidade do solo e sistema radicular da cana-de-açúcar em manejo com e sem controle de tráfego. Pesq Agropec Bras. 2012;47:603-12.
Souza ZM, Beutler n, Prado RM, Bento MJC. Efeito de sistemas de colheita de cana-de-açúcar nos atributos físicos de um
Latossolo Vermelho. Científica. 2006;34:31-8.
Taylor DW. Fundamentals of soil mechanics. new york: John Wiley; 1948.
Taylor HM, Roberson GM, Parker Jr JJ. Soil strength-root
penetration relations to medium to coarse-textured soil materials.
Soil Sci. 1966;102:18-22.