ISSN: 1809-4430 (on-line) www.engenhariaagricola.org.br
2 São Paulo State University – Unesp/ Jaboticabal - SP, Brazil.
Received in: 7-17-2017 Accepted in: 12-11-2017
Doi:http://dx.doi.org/10.1590/ 1809-4430-Eng.Agric.v38n2p 208-216/ 2018
HIGH PRECISION WEIGHING LYSIMETERS FOR EVAPOTRANSPIRATION
MEASUREMENTS OF SUGARCANE PRE-SPROUTED PLANTLETS
Luís G. P. Libardi
1*, Rogério T. de Faria
2, Alexandre B. Dalri
2, Glauco de S. Rolim
2,
Luiz F. Palaretti
21*Corresponding author. São Paulo State University – Unesp/ Jaboticabal - SP, Brazil. E-mail: lgplibardi@g mail.co m
KEYWORDS
irrigation, water
balance, water
requirement.
ABSTRACT
Sugarcane pre-sprouted plantlets (PSP) production system is an innovative method to
enhance crop multiplication rate. Determination of crop evapotranspiration (ETc) is
crucial for water requirement identification throughout the plant cycle for irrigation
management. ETc can be satisfactorily measured by weighing lysimeters. The objective of
the study was to construct and calibrate three low-cost weighing lysimeters to measure
ETc of PSP. The built lysimeters had 0.6909 m² area (1179 mm x 586 mm), with 400 mm
depth supported by 3 load cells. Lysimeters calibration showed excellent precision
measurements, due to high linear correlation (R² = 1.0000) between electric signal and
equivalent mass, high accuracy, confirmed by mean absolute error between 0.0272 and
0.0382 mm,
mean square error between 0.0011 and 0.0024 mm² and Willmott’s index of
agreement (d) equal to unit. Maximum hysteresis (0.1951 mm) and hysteresis at full scale
(0.4492%) did not compromise the evaluations. Daily ETc measurements showed
variation of 0.27 mm among lysimeters and were coincident with daily course of
reference evapotranspiration (ETo). The cost of the equipment was low, except for the
data acquisition system. Therefore, lysimeters presented low cost and were adequate to
measure ETc of PSP in greenhouse-grown.
INTRODUCTION
The system of production of pre-sprouted plantlets (PSP) is an innovative and efficient method for sugarcane planting, as it allows the reduction in the use of buds,
providing higher crop’s multiplication rates and better
control in plants vigor quality. The PSP production consists on growing plantlets originated from buds (species asexual reproductive structure) contained in stalks nodes, named as min i-stalks, p lanted in tubes filled with substrate (Landell et al., 2012).
PSP is grown in greenhouses, where correct irrigation management is of great importance for a successful production. Pardossi & Incrocci (2011) warn that poor irrigation often causes production losses and reduced quality on final product, while excessive irrigation increases crop susceptibility to diseases, pumping energy costs, water wastage, and environmental pollution due to nutrient leaching. Despite the industry's willingness to provide high technology equipment for irrigated agriculture to producers, in many cases, irrigation
management is carried out empirically (Pardossi & Incrocci, 2011; Repullo et al., 2015).
Adequate replenishment of consumptive water by a crop is of fundamental importance to the success of irrigated agriculture, and its determination depends on numerous edaphoclimat ic variables, of management and crop, that must be analyzed prior to the implementation of the hydraulic project. Among various methods available, the FAO-56 (Allen et al., 1998) is considered standard for determining crop water requirements in general. In such a method, crop evapotranspiration (ETc) is calculated as a function of the product between crop coefficient (Kc), experimentally determined, and reference evapotranspiration (ETo), calcu lated with meteorological data obtained at the location where Kc was previously determined.
water balance co mponents of a vegetated surface or of bare soil. With lysimeter measurements, Kc value can be experimentally determined by the ratio between ETc and ETo along the crop cycle.
Lysimeters are composed of a tank filled with soil or substrate, installed with its surface level to the area around the land, and being desirably, undetectable to the naked eye due to the similarity of its cover in relation to external area. They are supported in a weighing mechanis m that measures the mass variation of the system and transmits it as an electrical signal to a datalogger that registers the values at defined time intervals (Peñalver et al., 2015; Hagenau et al., 2015). One of the difficult ies in using lysimeters is the high cost of construction and installation (Nascimento et al., 2016; Silva et al., 2016).
In the literature, there is no information on ETc fro m PSP under protected cultivation to calculate the water requirement of sugarcane, unlike other s pecies traditionally grown in this environment such as tomato (Qiu et al., 2014), strawberry (Gavilán et al., 2015) and gerbera (Carmassia et al., 2013). There are also no suitable lysimeters for the measurement of ETc of PSP in protected environment.
In this context, the present study was conducted with the objective of exposing details of the construction and calibration of three low cost lysimeters as well as evaluating their capacities to measure ETc under protected environment conditions for PSP production.
MATERIAL AND MET HODS
Place of study
The present study was carried out in a greenhouse using pre-sprouted sugarcane plantlets from the São Martinho Mill (São Mart inho S/A), located at the
geographic coordinates 21°19’23’’ S and 48°06’47’’ W
and 528 meters of altitude, in the municipality of Pradópolis, SP. According to the classification of Köppen -Geiger (Alvares et al., 2013), the climate of the place is classified as humid subtropical (Aw), with dry and mild winter and hot and rainy summer. The greenhouse of the study was composed of 8 spans with arches of 7 m wide and 24 modules of 4.5 m o f length each, totaling 6048 m² (56 m wide and 108 m long). In the cover, a Polysack Ginegar diffuser plastic film was used, with a thickness of
150 µ m and ultravio let treat ment with 15% solar radiation filter, while the frontal and lateral ones were made of
white net with a thickness of 150 μm and ultraviolet
treatment with 30% filter.
Building and installation of the e qui pments
Three lysimeters (Lysimeter 1, Lysimeter 2 and Lysimeter 3) were installed in the greenhouse, each one made to support a set of three trays composed of 54 tubes of 180 ml each, totaling 162 plants of PSP of sugarcane by lysimeter.
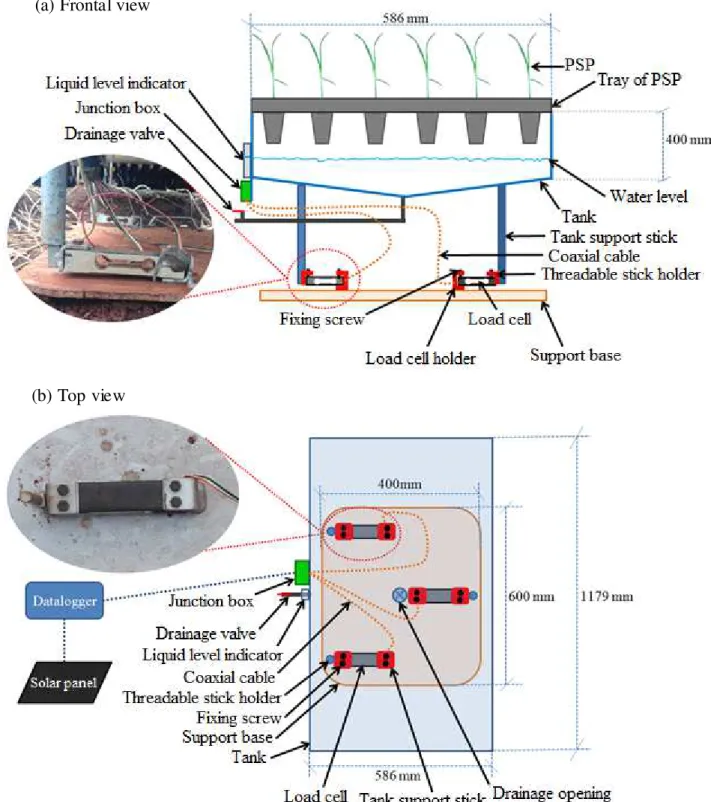
FIGURE 1.Schematic frontal view (a) and top view (b) of the lysimeters.
Previously to lysimeter installation, soil was leveled and a support base was constructed at the installation site. Load cell holders were then installed on main support base, the load cells being subsequently installed in these supports. Two screws were used to attach the load cells to the supports. Then, the lysimeter tank was supported by the triple set of load cells. The lysimeter sticks were attached to the top of the load cells, also using two screws for the correct fixation. The junction box has been properly fixed by four screws on the junction box support. Positioning adjustments were made to ensure the free flotation of the tanks on the load cells so that there was no external interference.
Subsequently, the lysimeter data acquisition system was installed composed of datalogger, mult iplexer and solar panel for the supply of electric energy to a battery. The installation was made using prefabricated steel supports and fixed at the support posts of the structure of the greenhouse. After the structural installation, cables were connected between load cells, junction boxes and lysimeter data acquisition system.
The load cells used (GL-30, A lfa Instrumentos Eletrônicos Ltda., São Pau lo, SP, Brazil) were manufactured in alu minu m with no minal capacity of 3 0 kg, sensitivity of 2.0000 +/ - 10% mV V-1 and accuracy of 0.03% full scale according to the manufacturer. A junction
(a) Frontal view
box (4134 A, Alfa Instrumentos Eletrônicos Ltda., São Paulo, SP, Brazil) per lysimeter was used. It had the function of combin ing the electrical signal of the three load cells which was then retransmitted by only one coaxial cable to the datalogger. A data acquisition system for the three lysimeters was used for the collection and storage data from the load cells. This system was composed by multip lexer of d ifferential channel (AM 416 Relay Multiplexer, Campbell Scientific, Logan, Utah, USA) and datalogger (CR10, Campbell Scientific, Logan, Utah, USA). The system power supply was made with a 12V and 7A battery coupled to a solar panel generat or (SP20R-PW, Campbell Scientific, Logan, Utah, USA). Stored data transfer was done directly to the microco mputer or indirectly to the memory module that later had the data transferred into a microcomputer through a software (PC200W, Campbell Scientific, Logan, Utah, USA) specific for this purpose. The datalogger was programmed to perform load cell readings every second
and the data storage was published on average every 20 minutes.
A meteorological station was installed with sensors to register temperature and relative humidity of the air in the canopy (HC2SC3-L, Campbell Scientific, Logan, Utah, USA) p rotected with radiat ion shield 12 p lates, net solar radiation (Campbell Scientific, Logan, Utah, USA ) and wind velocity at 2 meters (A100LK, Campbell Scientific, Logan, Utah, USA). The data acquisition system of this weather station is independent of the lysimeter data acquisition system, being configured to perform readings every second and store the average data every 10 minutes by datalogger (CR10X, Campbell Scientific, Logan, Utah, USA), also with differential channel mu ltip lexer (AM 416 Relay Multiplexer, Campbell Scientific, Logan, Utah, USA) and 12V and 7 A battery and solar panel-power (SX10M, Campbell Scientific, Logan, Utah, USA ) (Figure 2).
FIGURE 2.Weather station (a), data acquisition display module (b ) and irrigation bar (c).
Cali br ati on of lysimeters
After installation, the calibration of the three lysimeters was performed on September 25th, 2016 and lasted 3 hours and 20 minutes (7:00 a.m. to 10:20 p.m.), with appro ximately 1 hour per lysimeter and 20 minutes for calibrat ion preparations. During the calibration, the canopy air temperature ranged fro m 15.4 °C to 28.4 °C, the relative hu mid ity of the air fro m 87.9% to 54.3%, and the wind velocity at 2 m of 0.0 to 0.8 m s-1.
The methodology used in the calibration process of the lysimeters consisted of a correlation between the electric signal (ES), emitted fro m the load cells, and known masses applied in the system, in order to establish the linearity and hysteresis of these measurements (Faria et al., 2006). Before starting the calibration sequence, a mass of 26.4 kg was inserted on each lysimeter, which was equivalent to three trays with plantlets, in order to represent the dead weight in each lysimeter.
For the calibration, were used hermetically sealed bags filled with sand previously dried in drying oven of hot air circulating at 60 °C for 48 h. For the measurement of known masses, a precision digital scale of 0.01 g was used. The plastic bags totaled 40 units, of wh ich 30 contained a mass of 664.68 g (bag S1), equivalent to 0.962 mm, and 10 units had a mass of 66.47 g (bag S2), equivalent to 0.0962 mm. The equivalent mass (EM) in mm was obtained by the relation between the sand mass by the lysimeter area (0.6909 m²). After establishing the dead weight of the lysimeter, the addition and removal of mass in the lysimeter started. The sequence of additio n and removal of the bags was chosen so that the calibration comprised variations of equivalent mass of approximately 3 mm (set of 3 bags S1), 0.3 mm (set of 3 bags S2) and 0.1 mm (1 bag S2) to reach a total equivalent mass of approximately 30 mm. A set of 3 S1 bags (2.8860 mm) was added 5 times, provid ing an equivalent mass of 14.4349 mm, once a set of 3 S2 bags (0.28886 mm),
(c)
(a)
totaling 14.7195 mm, 4 times 1 bag S2 (0.0962 mm), totaling 15.1043 mm, once a set of 3 bags S2 (2.886 mm), totaling 15.3930 mm, 5 t imes a set of 3 bags S1 (0.28886 mm), totaling 29.8238 mm. Finally, in reverse sequence, the same procedure was performed for the discharge of lysimeters. The time between each addition and removal was 30 sec, the load cell voltage reading being performed at 10 and 20 after the addition or removal o f the known mass. The 10 seconds of difference were chosen to guarantee that stabilizat ion in the weight of the lysimeter occurred after the addition or removal of the mass.
The data obtained in the calibration were submitted to the coefficient of determination calcu lated in M icrosoft Excel® spreadsheet to determine the precision, the mean absolute error (Equation 1), the mean square error (Equation 2) and the concordance index (Equation 3) proposed by Willmott (1985) to determine the accuracy. The Willmott index varies fro m 0 to 1, with 1 being the maximu m agreement of the values estimated to the observed.
(1)
(2)
(3)
in wh ich,
MAE - mean absolute error, mm;
MSE - mean square error, mm²;
n - number of observations, dimensionless;
d - Willmott concordance index, d imensionless;
Yobs - standard equivalent masses used for calibrat ion of lysimeters, mm;
Yest - equivalent masses obtained in calibration of lysimeters, mm, and
Ȳobs - mean of standard equivalent masses used for calibrat ion of lysimeters, mm.
In order to verify the variability in mass determination by the load cell between addition and mass removal, the hysteresis error (H) was calculated by the maximu m difference between addition readings and the removal of the same mass values (Equation 4). In order to compare the errors of the two weighing systems, the hysteresis is expressed as a percentage of the full scale (HFS), according to [eq. (5)].
(4)
(5)
in wh ich,
H - hysteresis, mm;
Yadi - equivalent mass obtained during calibrat ion
during the addition of mass “i” in lysimeters, kg;
Yremi - equivalent mass obtained during calibration during removal of mass “i” in lysimeters, kg;
HFS - hysteresis at full scale, %, and
C - load cell capacity, 43.4 mm.
Lysimeters test
After the calibrat ion, it was performed a mass variation check test in the lysimeters (M) for determination of ETc, by the [eq. (6)].
(6)
in wh ich,
ETci - crop evapotranspiration on the lysimeter at
day “i”, mm;
Mi+1 - mass equivalent at 0h on the day following
the “i”, mm;
Mi - mass equivalent at 0h on “i”, mm;
Bi - irrigation depths on the day “i”, mm, and
Di - drainage on the day “i”, mm.
The values of ETc obtained in each lysimeter were compared to ETo, calculated by the Penman -Monteith equation (Equation 7), parameterized by the FAO-56 method (Allen et al., 1998) using the meteorological variables records obtained by the weather station.
(7)
in wh ich,
ETo - reference evapotranspiration, mm d-1;
S - slope of saturation vapor pressure curve, kPa °C -1
;
Rn - net solar radiat ion, MJ m-2 d-1;
G - soil heat flu x, MJ m-2 d-1 (negligible for daily values);
γ - psychrometric constant, 0.063 kPa °C-1; U2 - wind speed at 2 m, m s-1;
es - saturation vapor pressure, kPa;
ea - actual vapor pressure, kPa, e
T - mean air temperature, °C.
mini-stalks in an acclimat ized greenhouse (7 days at 30 oC and 90% relat ive humid ity). Three trays containing the plantlets were allocated to each lysimeter on September 30th, 2016. The measurements were held on October 1st and 2nd, 2016.
The irrigation was performed by spraying, applied by a 14 m wide irrigation bar, co mposed of 33 no zzles (TT TEEJET 11008VS, TeeJet, Springfield, Illinois, USA), spaced at 0.43 m (Figure 2). The regulation of the applied water level was adjusted by the speed of the bar, in which the flow was fixed in 2.6 l min-1 nozzle-1 and speed was limited in 8 m min-1, with the possibility of applying depths greater than 0.67 mm with each pass.
RES ULTS AND DISCUSS ION
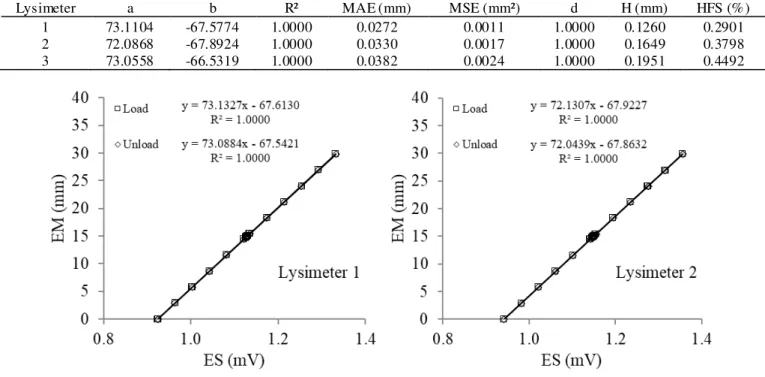
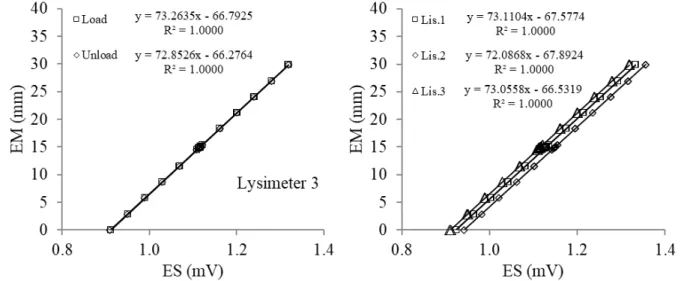
The calibration of the three lysimeters presented a high correlation (R² = 1.0000) between equivalent mass in mm and electrical signal, evidencing a high precision in the measurement of the equipments. The analysis of the results indicated high homogeneity in the weighing characteristics between lysimeters, with values of angular coefficient (a) of linear regression varying from 72.0868 mm mV-1 to 73.1104 mm mV-1, that is, variation of 1.0236 mm mV-1. In the same way, the variat ion of this coefficient between load and discharge was 0.0443 mm mV-1 for Lysimeter 1, 0.0868 mm mV-1 for Lysimeter 2 and 0.4109 mm mV-1 for Lysimeter 3 (Figure 3). These variations
were lower than those found by Mariano et al. (2015), due to the smaller capacity of the load cells used by the authors. The linear regression coefficient (b) varied fro m -66.5319 mm to -67.8924 mm, that is, a difference of 1.3605 mm, wh ich can be attributed to the differences in dead weights of each lysimeter. The mean absolute error varied fro m 0.0272 mm to 0.0382 mm, lo wer than those found by Mariano et al. (2015), Nascimento et al. (2011), Howell et al. (1995), Allen & Fischer (1991) and Faria et al. (2006) and similar to Campeche (2002). The mean square error varied fro m 0.0011 mm² to 0.0024 mm², it can be concluded that lysimeters are high ly accurate. In addition, to the accuracy of the equivalent mass measurement in mm was also demonstrated by Willmott’s index of agreement (d) (Willmott et al., 1985) which presented values of 1.0000 for the three lysimeters (Tab le 1), a result similar to observed by Mariano et al. (2015). The maximu m hysteresis value of 0.1951 mm and hysteresis at the full scale of 0.4492% observed in Lysimeter 3 d id not compro mise the equivalent mass ratings in mm in the three lysimeters of the study. Therefore, the equipments are suitable for ETc of PSP evaluations with precision and accuracy around 0.1 mm, which is suitable for applications in protected cultivation.
TABLE 1. Coefficients of linear regression of the line y = ax + b between equivalent mass (y, in mm) and electrical signal (x , in mV), coefficient of determination (R²), mean absolute error (MAE), mean square error (MSE), Willmott index (d), hysteresis (H) and full scale hysteresis (HFE) of the calibration of the three lysimeters.
FIGURE 3. Relationship between equivalent- mass (EM) and electric signal (ES) for load and unload of lysimeter 1 (a), lysimeter 2 (b ), lysimeter 3 (c) and for load and unload together values on the different lysimeters (d).
On the two days of the evaluation of the lysimeters, two irrigation events occurred on 10/01/2016 (7:40 a.m. and 2:40 p.m.), as well as on 10/02/2016 (10:40 a.m. and 12:00 p.m.). These irrigation events promoted increase in the EM of the lysimeters, while ETc caused a decrease in EM of the lysimeters, especially at the mo ment of higher at mospheric demand of the day (11:00 a.m. to 01:00 p.m.) (Figure 4).
FIGURE 4. Equivalent-mass (mm) registered by the three lysimeters during the test period, highlighting irrigation depths (ID) and crop evapotranspiration (ETc).
FIGURE 5. Hourly values of crop evapotranspiration (ETc) co mpared to reference evapotranspiration (ETo – Penman-Monteith) for the three lysimeters during test.
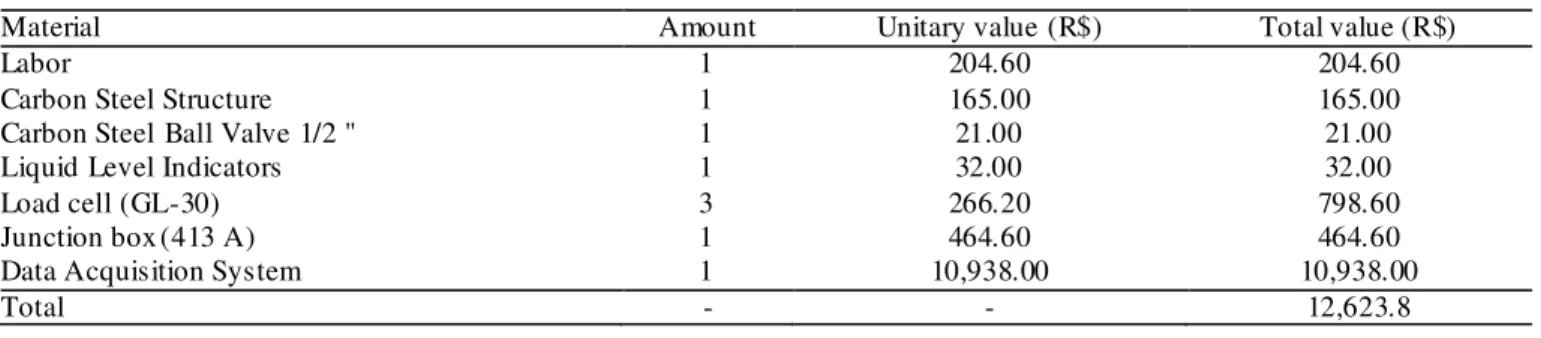
With the exception of the data acquisition system, the cost of lysimeter manufacturing materials can be considered low, totaling R$ 1,685.80. Data acquisition system used in the survey was budgeted at R$ 10,938.00, corresponding to 86.6% of the total cost (Table 2). The cost of this component can be attenuated by the use of alternative equip ment availab le o n the market.
TABLE 2. Costs of construction and installation of each weighing lysimeter.
Material Amount Unitary value (R$) Total value (R$)
Labor 1 204.60 204.60
Carbon Steel Structure 1 165.00 165.00
Carbon Steel Ball Valve 1/2 " 1 21.00 21.00
Liquid Level Indicators 1 32.00 32.00
Load cell (GL-30) 3 266.20 798.60
Junction box (413 A) 1 464.60 464.60
Data Acquisition System 1 10,938.00 10,938.00
CONCLUS IONS
The constructed and calibrated lysimeters presented excellent accuracy and precision detection of EM variations around 0.1 mm and hysteresis magnitude that did not compromise the equivalent mass evaluations. Conclusions verified by the high linear correlat ion (R2 = 1.0000) between ES (mV) and EM (mm), as well as coefficients of MAE between 0.0272 and 0.0382 mm, MSE between 0.0011 and 0.0024 mm2, d = 1.0000, maximu m value of H of 0.1951 mm and of HFS of 0.4492%, tolerable values for measures of water consumption in greenhouse-grown.
The tests performed indicated an ext remely similar performance in measurement of ETc among lysimeters, showing a variation of 0.27 mm, and ETc daily courses coincided with ETo.
The construction cost of the lysimeters (R$ 1,685.80) was lo w, except for the data acquisition system.
Therefore, the equipment presented low cost and its measurements were perfectly satisfactory for the study of ETc for irrigation management of PSP in g reenhouse-grown.
REFERENCES
Allen RG, Fischer DK (1991) Direct load cell-based weighing lysimeter system. In : Allen RG, Howell TA, Pruitt WO, Water IA, Jensen E. Lysimeter for
evapotranspiration and environmental measurements. New Yo rk, A merican Society of Civ il Engineers, p114-124.
Allen RG, Pereira LS, Raes D, Smith M (1998) Crop evapotranspiration: guidelines for co mputing crop water requirements. Ro me, Un ited Nations Food and Agriculture Organization. 301p. (Irrigation and drainage paper 56)
Alvares CA, Stape JL, Sentelhas PC, Gonçalves JLM ,
Sparovek G (2013) Köppen’s climate classification map for Brazil. Meteorologische Zeitschrift 22(6):711-728.
Campeche LFSM (2002) Construção, calib ração e análise de funcionamento de lisímetros de pesagem para
determinação da evapotranspiração da cultura da lima
ácida “Tahiti” (Citrus latifolia Tan.). Tese Doutorado, Universidade de São Paulo, Escola Superior de Agricu ltura
“Luiz de Queiroz”.
Carmassia G, Baccib L, Bronzinia M , Incroccia L, Magginia R (2013) Modelling transpiration of greenhouse gerbera (Gerbera jamesonii H. Bo lus) grown in subs trate with saline water in a Med iterranean climate. Scientia Horticulturae 156:9-18.
Faria RT, Campeche FSM, Ch ibana EY (2006) Construção e calibração de lisímetros de alta precisão. Revista
Brasileira de Engenharia Agrícola A mb iental 10(1):237 -242.
Gavilán P, Ruiz N, Lo zano D (2015) Daily forecasting of reference and strawberry crop evapotranspiration in greenhouses in a Mediterranean climate based on solar radiation estimates. Agricultural Water Management 159:307-317.
Hagenau J, Meissner R, Borg H (2015) Effect of exposure on the water balance of two identical lysimeters. Journal o f Hydrology 520:69-74.
Howell TA, Schneider AD, Dusek DA, Marek TH, Steiner JL (1995) Calibration and scale performance of Bushland weighing lysimeters. Transactions of the ASAE
38(4):1019-1024.
Landell M GA , Campana MP, Pery F, Xavier MA, Anjos IA, Dinardo-Miranda LL, Scarpari MS, Garcia JC, Bidóia MAP, Silva DN, Mendonça JR, Kanthack RAD, Campos MF, Brancalião SR, Pet ri RH, Miguel PEM (2012) Sistema de mult iplicação de cana-de-açúcar com uso de mudas pré-brotadas (MPB), oriundas de gemas
individualizadas. Ribeirão Preto, Instituto Agronômico de Camp inas. 16p.
Mariano DC, Faria RT, Freitas PSL, Lena BP, Johann AL (2015) Construction and calibration of a bar weigh ing lysimeter. Acta Scientiaru m 37(3):271-278.
Nascimento AHC, Montenegro SMGL, Filho JACA, Silva EFF, Lima NS (2016) Desempenho de um lisímetro de pesagem hidráu lica co m diferentes sistemas de leitura. Irriga 1(1):232-245.
Nascimento EF, Campeche LFSM, Bassoi LH, Silva JA, Lima A CM, Pereira FA C (2011) Construção e calibração de lisímetros de pesagem para determinação da
evapotranspiração e coeficiente de cultivo em v ideira de vinho cv. Syrah. Irriga 16(3):271-287.
Pardossi A, Incrocci L (2011) Tradit ional and new approaches to irrigation scheduling in vegetable crops. HortTechnology 21(3):309-313.
Peñalver LR, Repullo JA V, Buendía MJ, Gu zmán I, Martínez JMM (2015) Develop ment of an innovative low cost weighing lysimeter for pottedplants: Application in lysimetric stations. Agricultural Water Management 151:103-113.
Qiu R, Songa J, Du T, Kang S, Tong L, Chen R, Wu L
(2014) Corrigendum to ‘Response of evapotranspiration
and yield to planting density of solar greenhouse grown
tomato in northwest China’. Agricultural Water
Management 134:137.
Repullo JA V, Peñalver LR, Buendía MJ, Rosillo JJ, Martínez JMM (2015) Soft ware for the automatic control of irrigation using weighing-drainage lysimeters.
Agricultural Water Management 151:4-12.
Silva JC, Silva TJA, Bonfim-Silva EM, Duarte TF, Pacheco AB (2016) Construction and assessment of a hydraulic weighing lysimeter. African Journal of Agricultural Research 11(11):951-960.
Willmott CJ, Ackleson SG, Dav is RE, Feddema JJ, Klin k
KM, Legates DR, O’donnell J, Rowe CM (1985) Statistics