ABSTRACT: The present study aimed to evaluate the accumulation and distribution of Cu and Zn fractions in the profile of an Inceptisol by application of fungicides with a previous history of apple cultivation in southern Brazil. Stratified soil samples (0.0 – 0.025 m, 0.025 –0.050 m, 0.05 – 0.10 m, 0.10 – 0.15 m, 0.15 – 0.20 m and 0.20 – 0.40 m depth) were collected in two apple orchards (8 years old and 18 years old), and in a native pasture area adjacent to the orchards. The soil was subjected to analysis of physical and chemical properties and to chemical fractionation of Cu and Zn. The fractions of soluble, exchangeable, organic, residual and total Cu and Zn accumulated
SOIL AND PLANT NUTRITION -
Article
Copper and zinc fractions in the profile of an
Inceptisol cultivated with apple in southern Brazil
Gustavo Brunetto1*, Lucas Benedet2, Vítor Gabriel Ambrosini2, Jucinei Jose Comin2,George Wellington Bastos de Melo3, Matheus Ademir dos Santos2, Cledimar Rogério Lourenzi2,
Arcangelo Loss2, Paulo Belli Filho2, Djalma Eugênio Schmitt2, Rafael Couto1
1.Universidade Federal de Santa Maria - Departamento de Solos - Santa Maria (RS), Brazil. 2.Universidade Federal de Santa Catarina - Centro de Ciências Rurais - Florianópolis (SC), Brazil. 3.Empresa Brasileira de Pesquisa Agropecuária - Uva e Vinho - Bento Gonçalves (RS), Brazil.
*Corresponding author: brunetto.gustavo@gmail.com Received: Jan. 31, 2017 – Accepted: Sept. 18, 2017
INTRODUCTION
In the state of Santa Catarina, in southern Brazil, an area of approximately 18.000 ha is cultivated with apple crops (Malus domestica). It is the largest apple-producing area in Brazil, and Santa Catarina is the second largest producer, after Rio Grande do Sul state. Current apple production amounts to 531.000 t, equivalent to 44% of national production (Epagri 2013; Acate 2014). Nevertheless, apple trees are grown in regions with frequent rainfall, which stimulates the incidence of foliar fungal diseases and may reduce fruit yield and harm fruit quality. Therefore, foliar fungicides, e.g., the copper-based Bordeaux mixture (Ca(OH)2 + CuSO4) and
zinc-based mixtures, such as those with the active ingredient Mancozeb (C4H6MnN2S4 × Zn), are applied throughout the
year. Furthermore, fungicides containing Cu and Zn are applied after leaf senescence and during plant dormancy to promote dormancy breaking and branches disinfection.
The accumulation of Cu and Zn fractions, especially in the upper soil layers, can be stimulated by several factors: unidirectional fungicide applications; Zn and Cu being washed off the leaf surface by rainfall; the deposition of senescent leaves and pruned branches; the cycling of Cu and Zn by species of ground cover plants that co-inhabit the orchards; a low transfer of Zn and Cu to apples; and an absence of soil disturbance between orchard rows (Fernández-Calviño et al. 2010; Mackie et al. 2012; Ruyters et al. 2013).
In soil, Cu and Zn are retained by physical and chemical bonds, by mineral and organic components, and their availability depends on: the mineral contents, oxides and hydroxides of Fe, Al and Mn; carbonates (Bradl 2004); soil pH values (Toselli et al. 2009); cation exchange capacity (CEC); content; and composition of organic matter (Fernández-Calviño et al. 2010). However, when Cu and Zn contents increase in the soil, as a result, for example, of frequent fungicide applications, there can be accumulation and changes in the distribution of their fractions in such soil components. Adsorption of Cu and Zn in the soil occurs primarily in high affinity sites, usually forming inner sphere complexes. The remainder is adsorbed at sites with low binding energy and, consequently, it increases the availability and mobility of these elements in the soil profile (Brunetto et al. 2014). Thus, the increase of Cu and Zn in the soil over the years may increase the amount of soluble and exchangeable fractions of these elements, increasing toxicity to plants (Michaud et al. 2007; Nagajyoti et al. 2010; Yadav 2010; Fernández-Calviño et al.
2012) and water contamination through their transfer in the soil profile (Mileusnić et al. 2014; Marchand et al. 2014).
The fractions of Cu and Zn can be estimated by chemical fractionation, which removes Cu and Zn from the most labile to the most stable fractions (Tessier et al. 1979). The total amount of these elements in soils or sediments can be separated into bioavailable fractions (water-soluble and exchangeable), potentially bioavailable fractions (bound to clay minerals, oxides, carbonates and organic matter) and residual fractions (bound to the structure of minerals) (Casali et al. 2008; Frankowski et al. 2010; Brunetto et al. 2013; Duplay et al. 2014). However, in the Americas, particularly in subtropical and temperate regions, few studies exist on the accumulation and distribution of Cu and Zn fractions in the soil profile in apple orchards with a history of continuous fungicides application, whose compositions include Cu and Zn. The present study aimed to evaluate the accumulation and distribution of Cu and Zn fractions in the profile of an Inceptisoil on two plantations previously cultivated with apple trees in southern Brazil.
MATERIALS AND METHODS
Study location
This study was conducted using soil collected from two commercial orchards, one with eight years of cultivation (O8) and another with 18 years of cultivation (O18), and a soil from native pasture (NP), located nearby the orchards, in the county of Urubici, in the Planalto Serrano region, state of Santa Catarina, southern Brazil (Long 49°35’30”W, Lat 28°00’05”S). At the three sites, the soil was classified as an Inceptisoil, a Cambissolo Húmico in Brazilian classification (Embrapa 2013). The local relief was classified as slightly undulating, with a 4% slope. The climate is humid mesothermal with mild summers, Cfb type according to Köppen classification, with an average annual rainfall of 1360 – 1600 mm, average temperature of 15.4 °C, and between 20 and 29 frosts can occur throughout the year (Pandolfo et al. 2002).
Orchard O8 was implanted in 2003 with a planting density of 4,444 plants·ha–1 (4.5 m between rows and
0.5 m between plants), and orchard O18 in 1993, with a planting density of 1,482 plants·ha–1 (4.5 m between
commercial varieties, with Gala and Fuji accounting for 70% and 30% of the plants, respectively, with trees grown under a central-leader planting system. The plants of orchard O8 were grafted onto a Marubakaido rootstock, with a 20-cm M9 filter, while in orchard O18 the plants were grafted onto a Marubakaido rootstock without filter.
The implantation of the orchards was preceded by an application of lime to raise the soil pH in water to 6.0. Lime was applied on the surface and incorporated into the soil with a plow and then with a harrow to a depth of approximately 0.3 m. The plantation received 1000 kg·ha–1
of formula fertilizer (5-20-10; N-P2O5-K2O), totaling 50,
200 and 100 kg·ha–1 of N, P
2O5 and K2O, respectively.
The fertilizer was applied to the soil surface and also incorporated to approximately 0.3 m. Maintenance fertilizer was added annually: approximately 50, 30 and 150 kg·ha–1 of N, P
2O5 and K2O in the formulation
11-7-35. The fertilizer was applied on the soil surface without incorporation, in a row coincident with the canopy of the plants. Weed control in these rows was performed annually with the use of an herbicide (with glyphosate as the active ingredient). Between rows, weeds consisted primarily of Trifolium repens, Trifolium
pratenses, Paspalum notatum and Chaptalia nutans.
They were mowed throughout the apple tree cycle at approximately 0.10 m height from the soil surface. The native pasture area, which was used as reference, was located adjacent to the orchards, and natural vegetation was composed mainly of cover crops.
For fungal disease control during the production period of the orchard (October to April), was applied a spray volume of approximately 1000 L·ha–1 of fungicides N-
(4,6-dimethylpyrimidine-2-yl) aniline (PYRIMETHANIL) (45 mL 100 L); N-(trichloromethylthio) cyclohex-4-ene-1,2-dicarboximide (CAPTAN) (22 g 100 L); Sulfur (sulfur) (100 g 100 L); and especially Mancozeb (160 g 100 L). The fungicides were applied every seven days, always with rotation between the products. However, if it rained for more than nine consecutive hours, a new application was performed. During the winter period, the plant apple trees received 1000 L·ha–1 spray volume of a copper-based
fungicide (Copper II + Oxychloride – Cu oxychloride), one application at the beginning of the production cycle, during the budding of the leaves, and other at the end of the cycle, after leaf senescence, with a total of around 22 fungicide applications per year.
Collection and preparation of soil samples
In October 2011, eight years after the implantation of orchard O8 and 18 years after the implantation of orchard O18, six trenches measuring 0.5 m depth and 0.5 × 0.3 m side were opened in random spots close to the planting rows in each orchard. Six trenches were opened at random points on the NP. Stratified samples were collected in each of the trenches in the following layers: 0.0 – 0.025 m, 0.025 – 0.05 m, 0.05 – 0.10 m, 0.10 – 0.15 m, 0.15 – 0.20 m and 0.20 – 0.40 m. Soil samples were air-dried, ground in a porcelain mortar, passed through a 2-mm mesh sieve, and reserved for analysis.
Physical and chemical characterization of soil
The soil samples were quantified for the levels of clay, silt and sand by the pipette method (Embrapa 1997). Total organic carbon was determined by the Walkley-Black method (Embrapa 1997), and the levels of soil organic matter were measured by multiplying the total organic carbon content by 1,724 (Tedesco et al. 1995). Analysis of soil pH was performed using a soil:water suspension of 1:1 v/v ratio (Tedesco et al. 1995). The levels of available phosphorus (P) and exchangeable potassium (K) were determined in a solution extracted by Mehlich–1 solution (HCI 0.05 mol·L–1
+ H2SO4 0.0125 mol·L
–1); P was determined by colorimetry
(Murphy and Riley 1962) in a spectrophotometer; and K in a flame photometer. The contents of exchangeable Ca2+,
Mg2+ and Al3+ were determined in a solution extracted by
KCl (1 mol·L–1), whereas Ca and Mg were determined
by atomic absorption spectrometry (AAS), and Al by titration with NaOH (Tedesco et al. 1995). Effective cation exchange capacity (CECeffective) was calculated by summing
the exchangeable cations of Al3+ + Ca2+ + Mg2+ + K+. Cation
exchange capacity at pH 7.0 (CECpH 7.0) was calculated by
the sum of exchangeable bases (Ca2+ + Mg2+ + K+) plus
H + AlSMP estimated from the equation proposed by Kaminski
et al. (2002). Table 1 shows the determined physicochemical parameters.
Chemical fractionation of copper and zinc in soils
et al. (1979). Soil samples (1 g, in triplicate) were transferred to 50 mL polypropylene tubes to perform the following sequential extractions: the soluble fraction, extracted with deionized water (8 mL) (Cusol and Znsol); the exchangeable
fraction, extracted with 1.0 mol.L–1 MgCl
2 at pH 7.0 (8 mL)
(CuE and ZnE); the mineral-bound fraction, extracted with
0.04 mol.L–1 hydroxylamine hydrochloride (NH
2OH.HCl)
in 25% acetic acid (v/v) at pH 2.0 (20 mL) (CuMin and ZnMin);
and the organic-bound fraction extracted with 0.02 mol.L–1
HNO3 (3 mL) + 30% H2O2 (8 mL) + NH4OAc in 20% HNO3
(v/v) (5 mL) (CuOM and ZnOM). The supernatant was separated
by centrifugation at 3200 xg for 30 min, and an aliquot was set aside to determine the Cu and Zn levels. Between each extraction, the samples were agitated with deionized water and centrifuged, and the supernatant was discarded. At the end of the sequential extraction, the remaining residues were dried at 65 °C for 24 h, and then, 0.50 g of the dry residue was subjected to digestion with concentrated HF + HClO4 to
determine the residual Cu and Zn fractions (CuR and ZnR). To
determine the pseudototal levels, 30% H2O2 + concentrated
HF + concentrated HClO4 solution was added to 0.5 g samples
of dry soil (not subjected to sequential extraction of Cu and Zn) to digest the samples (CuT and ZnT). In conducting the
study, all glassware was soaked in 10% HNO3 for at least
24 h and then washed in deionized water three successive times before use. The CuSum and ZnSum represent the sum of
fractions CuSol, CuE, CuMin, CuOM, and CuR and ZnSol, ZnE,
ZnMin, ZnOM, and ZnR, respectively.
Statistical analysis
The results of the Cu and Zn fractions were submitted to analysis of variance (ANOVA), and when the effects were significant between the layers of the same area, the means were compared by Tukey’s test (a = 5%). The differences between areas were evaluated using orthogonal contrasts: native pasture versus orchards and orchard O8 versus orchard O18 within each sampled soil layer. An analysis of variance was performed, and the differences in the proposed contrasts were tested at 5%, 1% and 0.1% probability of error for the F-test.
The fractions of CuSol, CuE, CuMin, CuOM, CuR and CuSum and
the fractions of ZnSol, ZnE, ZnMin, ZnOM, ZnR and ZnSum were
submitted to principal component analysis (PCA). For this purpose, the mean of six replicates was calculated for each layer and subjected to PCA. To minimize the discrepancy between the data, the values were normalized using Eq. 1:
Area Layer Clay Silt Sand OC Al Ca Mg P K pH CECpH 7.0 CTCeffective
(m) (g∙kg–1) (cmol
c∙kg
–1) (mg∙kg–1) (cmo
c ∙kg –1 )
NP
0 – 0.025 91 545 364 105.5 0.9 4.6 3.6 7.1 585 5.00 31.5 10.2
0.025 – 0.05 106 560 334 73.1 3.2 2.4 2.4 3.9 266 3.96 32.9 7.2
0.05 – 0.10 113 540 347 72.8 5.6 1.4 1.3 2.9 138 3.91 32.1 6.0
0.10 – 0.15 111 537 352 69.8 7.2 0.8 1.0 1.9 112 3.80 38.4 5.6
0.15 – 0.20 139 515 345 45.2 7.4 0.7 0.7 1.6 59 3.65 40.6 6.1
0.20 – 0.40 151 483 366 41.5 8.2 0.5 0.6 0.6 49 3.74 33.6 5.7
O8
0 – 0.025 240 195 565 50.0 0.2 6.5 8.0 35 144 5.19 15.1 10.2
0.025 – 0.05 257 182 561 47.1 0.1 6.8 3.1 19.7 81 6.11 12.8 10.3
0.05 – 0.10 259 186 555 37.4 0.1 7.2 3.2 21.7 55 6.22 13.4 10.6
0.10 – 0.15 272 171 557 38.1 0.1 6.0 4.5 8.6 38 6.41 13.5 10.7
0.15 – 0.20 272 168 560 32.5 0.1 6.7 4.6 4.8 38 6.09 14.5 11.5
0.20 – 0.40 213 192 595 13.2 0.2 5.4 3.7 1.5 24 5.29 14.4 9.4
O18
0 – 0.025 209 211 580 63.5 0.2 6.8 6.5 95.6 271 5.18 21.7 14.2
0.025 – 0.05 216 199 585 55.4 0.1 7.7 2.4 95.3 115 4.93 18.7 10.5
0.05 – 0.10 209 210 582 41.1 0.1 13.7 3.2 83.1 110 5.07 17.5 10.9
0.10 – 0.15 212 201 587 27.1 0.2 8.2 3.1 83.3 65 5.37 16.7 11.7
0.15 – 0.20 213 208 580 27.3 0.1 9.0 3.0 79.1 64 5.51 17.0 12.3
0.20 – 0.40 241 185 574 29.6 0.2 6.7 3.4 51.8 40 5.47 14.3 10.4
(value – minimum value / maximum value – minimum value) × 2 – 1
PCA is used to reduce data size and thus facilitate analysis by means of a correlation circle graph (Herlihy and McCarthy 2006).
RESULTS
Fractions of Cu in soil
In the native pasture (NP) soil, the highest levels of CuSol,
CuR, CuSum and CuT were observed in the layer of 0.0 – 0.025 m
and decreased at deeper levels (Table 2). The levels of CuE in
the NP soil did not differ between layers. The highest levels of CuMin in the NP soil were found in the layers at 0.0 – 0.025 m
and 0.025 – 0.050 m, whereas for the CuOM fraction, the
higher content was observed in the layers at 0.0 – 0.025 m to 0.10 – 0.15 m. In the soil of O8 and O18 orchards, the highest levels of all Cu fractions were observed in the layer at 0.0 – 0.025 m and decreased in deeper layers.
The CuR fraction had higher levels compared with the
CuSol, CuE, CuMin, and CuOM fractions in all soil layers of NP
(Table 2). The levels of CuSol, CuE, CuMin and CuOM were similar
to each other, except for the layer at 0.15 – 0.20 m, in which the CuE fraction had higher levels than the fractions of CuSol,
CuMin and CuOM (Table 2). In all soil layers evaluated for O8,
the levels of CuR were also higher than those found in the
CuSol, CuE, CuMin and CuOM fractions, with the exception of
the layer at 0.0 – 0.025 m, where there were no differences in the level of CuOM. For the orchard O18, there were also
higher levels of CuE compared with the CuSol, CuE, CuMin and
(1)
Layers (m) Cu fractions (mg∙kg
–1)
CuSol CuE CuMin CuOM CuRes CuSum CuTotal CV (%)
NP
0 – 0.025 0.17 Ad1 0.65 Ad 0.56 Ad 0.56 Ad 7.14 Ac 9.07 Ab 12.70 Aa 17.29
0.025 – 0.05 0.11 Bd 0.61 Ad 0.54 Ad 0.50 ABd 5.24 Bc 7.00 Bb 10.59 Ba 16.57
0.05 – 0.10 0.11 Bd 0.70 Ad 0.39 Bd 0.42 ABCd 3.85 BCc 5.48 Cb 7.93 Ba 17.26
0.10 – 0.15 0.07 Cd 0.63 Ad 0.35 Bd 0.41 ACd 3.36 CDc 4.82 CDb 7.99 Ba 26.07
0.15 – 0.20 0.07 Ce 0.65 Ad 0.27 Ce 0.31 CDe 2.50 CDc 3.79 DEb 7.28 Ba 20.40
0.20 – 0.40 0.05 Cd 0.63 Acd 0.14 Dd 0.18 Dd 2.23 Dbc 3.23 Eb 6.99 Ba 28.78
CV (%) 12.42 3.99 8.89 16.67 15.18 10.99 11.28
O8
0 – 0.025 0.50 Ae 1.98 Ae 11.89 Ad 18.43 Ac 21.64 Ac 54.44 Ab 86.04 Aa 7.16
0.025 – 0.05 0.27 Bf 0.92 Bef 3.54 Bde 4.80 Bd 17.30 Bc 26.83 Bb 71.01 Ba 8.66
0.05 – 0.10 0.26 Bf 0.60 Cef 2.66 Cde 3.39 Cd 13.01 Cc 19.93 Cb 58.24 Ca 7.57
0.10 – 0.15 0.25 BCe 0.42 CDe 2.46 CDd 2.19 Dde 9.72 Dc 15.05 Db 51.56 Da 8.85
0.15 – 0.20 0.22 Cd 0.26 DEd 2.07 DEd 1.81 Dd 7.64 Dc 12.01 DEb 43.22 Ea 9.49
0.20 – 0.40 0.15 Dd 0.09 Ed 1.79 Ed 1.47 Dd 7.13 Dc 10.62 Eb 28.67 Fa 13.43
CV (%) 5.83 14.15 6.04 5.93 11.05 6.11 5.04
O18
0 – 0.025 0.70 Af 1.15 Af 19.13 Ae 50.13 Ac 35.39 Ad 106.50 Ab 120.16 Aa 6.34
0.025 – 0.05 0.39 Be 0.97 Be 12.55 Bd 23.92 Bc 24.70 Bc 62.52 Bb 78.02 Ba 8.58
0.05 – 0.10 0.28 Cf 0.93 Bf 11.82 BCe 15.28 Cd 18.63 Cc 46.93 Cb 68.71 Ca 5.94
0.10 – 0.15 0.24 Ce 0.70 Ce 10.99 Cd 13.99 Cd 18.96 Cc 44.87 Cb 55.04 Da 8.10
0.15 – 0.20 0.24 Ce 0.68 Ce 8.64 Dd 13.92 Cc 12.14 Dcd 35.61 Db 40.50 Ea 9.95
0.20 – 0.40 0.23 Cd 0.66 Cd 6.59 Ec 5.84 Dc 5.53 Ec 18.85 Eb 22.52 Fa 12.09
CV (%) 7.86 6.36 3.91 4.55 11.67 4.47 5.39
Table 2. Cu fractions of an Inceptisoil under native pasture (NP) and in orchard O8 (8 years old) and orchard O18 (18 years old), both cultivated with apple trees.
CuOM fractions only in the layers at 0.05 – 0.10 m and 0.10 –
0.15 m. In the soil layer from 0.0 – 0.025 m in orchard O18, the level of CuOrg was higher than the levels of CuR, CuMin,
CuE and CuSol (Table 2).
The means of the levels of all Cu fractions in the six evaluated layers (0.0 – 0.025 m, 0.025 – 0.05 m, 0.05 – 0.10 m, 0.10 – 0.15 m, 0.15 – 0.20 m and 0.20 – 0.40 m), except for the CuE fraction, were higher in the soil of orchards O8 and
O18, compared with the levels of soil under natural pasture (Tables 2 and 3). This result was also observed when comparing the means of Cu levels in the six evaluated layers between the two orchards, where all fractions, except for CuE, were
higher in the orchard O18 compared with O8 (Tables 2 and 3). Furthermore, the CuMin, CuOM, CuE and Cusum fractions
were higher in the orchard O18 compared with O8 in the six layers (Tables 2 and 3). The exceptions were the levels of fractions CuE and CuTotal (0.025 – 0.05 m), CuSol (0.05 – 0.10
m) and CuSol and CuTotal (0.10 – 0.15 m and 0.15 – 0.20 m),
which showed no differences (Table 3).
The native pasture layer at 0.0 – 0.025 m had the highest percentage of Cu in the residual fraction (CuRes) (Figure 1),
but in the soil of O8 and O18, the percentage of CuRes
decreased compared with that of the native pasture soil. There was also an increase in the CuOM and CuMin fractions.
In the soil of O18, the percentage of CuOM was higher than
that of the CuE and CuRes fractions. In the layer at 0.025 –
0.050 m, the CuRes percentages decreased in the soil of O8 and
O18, compared with that of the native pasture soil, because of an increase in the percentage of CuOM, especially in the
soil of O18. In the layer at 0.05 – 0.10 m, the percentages of CuRes were similar between the soil under native pasture
and that of O8. However, in the soil of O8, the percentages of CuOM and CuMin were higher compared to the soil under
native pasture. The highest percentages of CuOM and CuMin
were observed in the soil of O18, compared with the soils of the native pasture and O8. In the layers at 0.10 – 0.15 m, 0.15 – 0.20 m and 0.20 – 0.40 m, the percentages of CuOM
and CuMin increased in the soil of O8, and especially in
the soil of O18. In the latter, because of the increase in the CuOM and CuE fractions, a lower proportion of CuRes was
present compared with NP and O8. For the CuE fraction,
the soil under native pasture had the highest percentages in all evaluated layers.
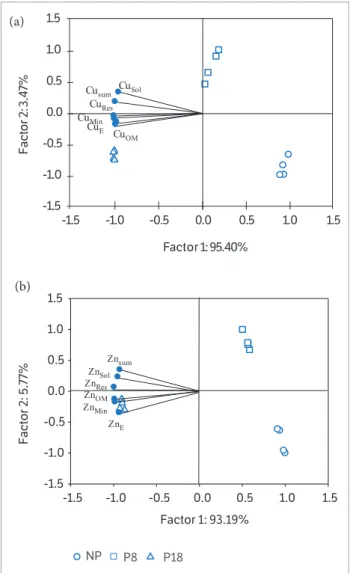
The principal component analysis (PCA) of the Cu fractions showed a relation between the main component 1 (factor 1) and the main component 2 (factor 2), which was split among the areas (NP, O8 and O18) (Figure 2a), accounting for 98.87% of the results. The areas of native pasture and O8 were separated from O18 by factor 1 of PCA, which helps to explain 95.4% of the results. The result was strongly influenced by the variables Cusol, CuE, CuMin, CuOM
and CuRes. Factor 2 of the PCA, which helps explain only
3.4% of the results, separated the areas of orchards O8 and O18 from the native pasture area.
Zn fractions in soil
The highest levels of Zn fractions (ZnSol, ZnE, ZnMin, ZnOM,
ZnR and ZnSum) and ZnTotal were found in the layer at 0.0 –
0.025 m in all areas assessed, with a subsequent decrease in the levels because of increasing depth (Table 4). The exception to this pattern was found in the soil of O8 and O18, where the ZnOM and ZnTotal fractions did not differ between the layers
at 0.0 – 0.025 m and 0.025 – 0.050 m. Furthermore, in the soil of O18, the ZnRes fraction showed equal values between
those two layers and the layer at 0.0 – 0.15 m.
1Means of six evaluated layers. *Significant at 5%; ** significant at 1%; *** significant a 0.1%; ns = no significant.
Table 3. Orthogonal contrasts between the Cu fractions of an Inceptisoil under native pasture (NP) and in orchard O8 (8 years old) and orchard O18 (18 years old), both cultivated with apple trees.
Contrasts CuSol CuE CuMin CuOM CuR CuSum CuTotal
NP vs O8 and O181 *** Ns *** *** *** *** ***
O8 vs O181 *** Ns *** *** *** *** *
Layer 0.0 – 0.025 O8 vs O18 *** *** *** *** *** *** ***
Layer 0.025 – 0.05 O8 vs O18 *** Ns *** *** *** *** ns
Layer 0.05 – 0.10 O8 vs O18 ns *** *** *** *** *** ***
Layer 0.10 – 0.15 O8 vs O18 ns *** *** *** *** *** ns
Layer 0.15 – 0.20 O8 vs O18 ns *** *** *** ** *** ns
In all layers and areas assessed, the highest Zn levels were found in ZnTotal, except for the Znsum fraction, which
showed values equal to those of the ZnTotal fraction in the
layer at 0.05 – 0.10 m for O8. For the ZnRes fraction, there
were higher levels compared with the ZnSol, ZnE, ZnMin
and ZnOM fractions in all layers of the soil under natural
pasture, O8 and O18. The level of the ZnMin fraction in the
soil under native pasture, O8 and O18 in all layers was lower than that of ZnRes, but higher than the levels of ZnSol, ZnE
and ZnOM. In the soil of O18, in all layers, the ZnE levels
were higher than the levels in the soil layers of the native pasture and O8.
Contrast orthogonal analysis showed that the mean Zn content of the six measured layers (0.0 – 0.025 m, 0.025 – 0.05 m, 0.05 – 0.10 m, 0.10 – 0.15 m, 0.15 – 0.20 m and 0.20 – 0.40 m) and of all fractions (ZnE, ZnMin,
ZnOM, ZnR, ZnSum and ZnTotal) was higher in the soil
of O8 and O18, compared with the soil under native pasture (Tables 4 and 5). This result was also found by comparing the means of Cu levels measured in the six Figure 1. Relative percentage of each Cu fraction obtained from a sequential extraction compared with the sum of the amount extracted from six layers of an Inceptisoil under native pasture and in orchards cultivated with apple trees (O8 and O18).
ZnSol ZnE ZnMin ZnOM ZnRes
0.0 – 0.025 m
P18 P8
0.025 – 0.05 m
P18 P8
Relative Percentage of the Sum of Fractions
0 10 20 30 40 50 60 70 80 90 100
0.05 – 0.10 m
P18 P8
0.10 – 0.15 m
0.15 – 0.20 m
0 10 20 30 40 50 60 70 80 90 100
0.20 – 0.40 m
NP
layers between the two orchards, where all the fractions were higher in orchard O18 compared with O8. Except for the ZnSol fraction in the layers at 0.10 – 0.15 m
and 0.20 – 0.40 m, and ZnR in the layer at 0.0 – 0.025 m,
all other fractions in all layers were higher in the soil of O18, compared with that of O8 (Tables 4 and 5).
Layer (m)
Zn fractions (mg∙kg–1)
ZnSol ZnE ZnMin ZnOM ZnR ZnSum ZnTotal CV (%)
NP
0 – 0.025 0.18 Ae1 3.21 Ae 9.38 Ad 1.89 Ae 16.24 Ac 30.90 Ab 39.57 Aa 9.06
0.025 – 0.05 0.10 Be 1.70 Be 5.04 Bd 1.78 Be 12.02 Bc 20.62 Bb 24.38 Ba 10.38
0.05 – 0.10 0.08 BCe 1.51 Bcd 4.03 Cc 1.26 Bcd 9.35 BCb 16.22 Cb 19.59 Ca 20.38
0.10 – 0.15 0.07 BCe 1.42 Be 3.46 Dd 1.03 Be 8.29 Cc 14.26 CDb 17.97 CDa 13.21
0.15 – 0.20 0.06 CDe 0.73 Cde 3.01 DEd 0.43 Ce 7.08 Cc 11.39 DEb 14.53 Da 17.68
0.20 – 0.40 0.03 De 0.66 Cde 2.77 Ed 0.27 Ce 6.76 Cc 10.48 Eb 14.05 Da 18.51
CV (%) 19.30 9.24 4.83 9.96 11.95 7.24 9.24
O8
0 – 0.025 0.16 Ae 3.56 Ae 14.65 Ad 1.83 Ae 48.55 Ac 68.74 Ab 75.70 Aa 6.48
0.025 – 0.05 0.12 Be 0.57 Be 6.63 Bd 1.42 Be 33.40 Bc 42.14 Bb 76.25 Aa 4.93
0.05 – 0.10 0.11 BCc 0.42 Cc 5.29 Cc 1.40 Bc 23.51 Cb 30.74 Ca 34.16 Ba 18.84
0.10 – 0.15 0.11 BCDd 0.39 Cd 3.47 Dd 1.22 BCd 18.66 CDc 23.85 Db 30.37 Ba 13.19
0.15 – 0.20 0.08 CDd 0.41 Cd 1.83 Ed 1.07 Cd 15.32 Dc 18.71 Db 28.86 BCa 10.35
0.20 – 0.40 0.08 Dc 0.13 Dc 1.41 Ec 1.00 Cc 16.22 Db 18.82 Db 22.82 Ca 15.87
CV (%) 13.58 3.24 4.94 9.83 9.92 7.72 6.46
O18
0 – 0.025 0.22 Ad 12.03 Ad 41.75 Ac 4.56 Ad 49.69 Ac 108.25 Ab 155.00 Aa 12.67
0.025 – 0.05 0.16 Be 6.49 Be 29.74 Bd 4.36 Ae 45.88 Ac 86.63 Bb 100.86 Ba 7.44
0.05 – 0.10 0.15 BCe 4.09 Ce 28.52 BCd 3.26 Be 43.71 Ac 79.73 BCb 96.99 Ba 5.77
0.10 – 0.15 0.12 BCDe 2.79 De 26.94 CDd 2.72 Be 41.54 Ac 74.11 Cb 93.25 Ba 11.86
0.15 – 0.20 0.11 CDd 2.13 Ed 25.42 Dc 2.63 Bd 30.70 Bc 60.98 Db 89.28 Ba 9.99
0.20 – 0.40 0.09 De 1.73 Fe 14.56 Ed 1.88 Ce 24.21 Bc 42.48 Eb 59.59 Ca 14.25
CV (%) 15.32 3.25 3.15 9.68 10.04 5.39 8.43
Table 4. Zn fractions of an Inceptisoil under native pasture (NP) and in orchard O8 (8 years old) and orchard O18 (18 years old), both cultivated with apple trees.
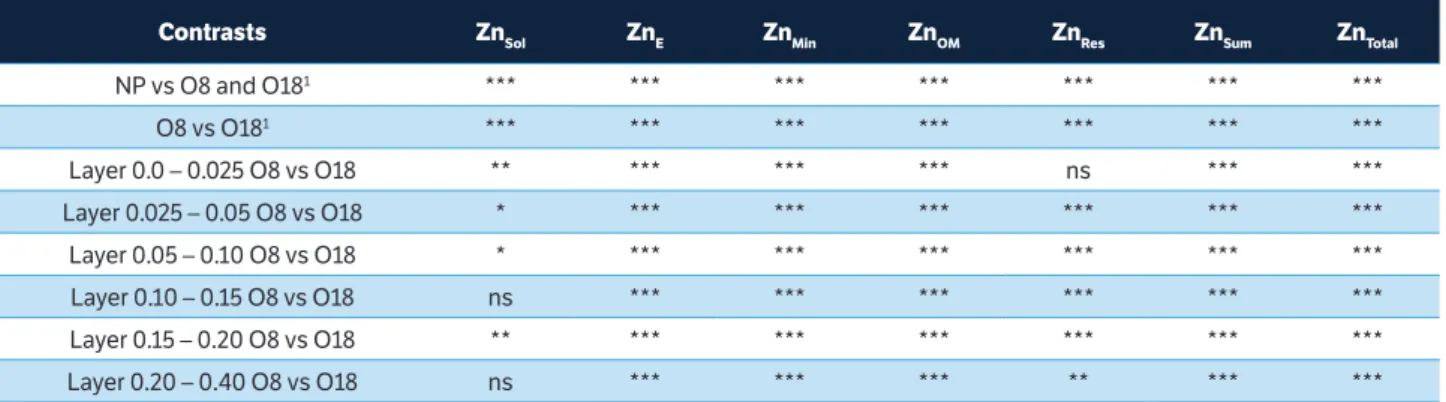
Contrasts ZnSol ZnE ZnMin ZnOM ZnRes ZnSum ZnTotal
NP vs O8 and O181 *** *** *** *** *** *** ***
O8 vs O181 *** *** *** *** *** *** ***
Layer 0.0 – 0.025 O8 vs O18 ** *** *** *** ns *** ***
Layer 0.025 – 0.05 O8 vs O18 * *** *** *** *** *** ***
Layer 0.05 – 0.10 O8 vs O18 * *** *** *** *** *** ***
Layer 0.10 – 0.15 O8 vs O18 ns *** *** *** *** *** ***
Layer 0.15 – 0.20 O8 vs O18 ** *** *** *** *** *** ***
Layer 0.20 – 0.40 O8 vs O18 ns *** *** *** ** *** ***
1Means followed by the same capital letter in a column and lower case in a row do not differ by Tukey’s test (p < 0.05). CV = coefficient of variation.
Table 5. Orthogonal contrasts between Zn fractions of an Inceptisoil under native pasture (NP) and in orchard O8 (8 years old) and orchard O18 (18 years old), both cultivated with apple trees.
In the layers at 0.0 – 0.025 m, 0.025 – 0.050 m, 0.05 – 0.10 m, 0.10 – 0.15 m, 0.15 – 0.20 m and 0.20 – 0.40 m, the highest percentages of Zn in soil under the native pasture, O8 and O18 were found in the residual fraction (ZnRes), being
that the highest percentages were in the soil of O8 (Figure 2). However, in the soil of O18 was an increase of Zn content in the mineral fraction (ZnMin) in all layers, compared with
the soils of the native pasture and O8.
The PCA of Zn fractions showed the relation between the main component 1 (factor 1) and main component 2 (factor 2), which suggested separation of the areas assessed
(Figure 2b), supporting the PCA of Cu fractions. Factors 1 and 2 accounted for 98.96% of the results. Factor 1, which explained 93.19% of the data, separated the areas of native pasture and O8 from that of O18. The ZnSol, ZnE, ZnMin, ZnOM
and ZnRes fractions contributed greatly to this result, whereas
factor 2 contributed only 5.7% to the result and separated O8 and O18 from the native pasture area.
DISCUSSION
The highest levels of Cu fractions (CuSol, CuE, CuMin,
CuOM, CuR, CuSum and CuTotal) were observed in the surface
layer (0.0 – 0.025 m), especially in the soils of orchards O8 and O18. They can be attributed to years of applications of foliar fungicides, such as Mancozeb, Pyrimethanil and [CuSO4·5H2O + Ca(OH)2)], with the aim of preventing
fungal diseases and also to promote dormancy breaking of plants (Verdisson et al. 2001; Komárek et al. 2010; Duplay et al. 2014). Thus, Cu may have accumulated on the soil surface because the applications were directional to the trees and Cu was washed off the surface of leaves by rainfall, and also by deposition of senescent leaves and pruned branches containing Cu derived from these applications (Brunetto et al. 2013). Furthermore, the higher level of Cu on the soil surface was also favored by the absence of soil disturbance in planting rows and between rows of apple trees over the years, by the cycling of Cu through deposition and subsequent decomposition of senescent leaves and pruned branches of apple trees, or even by the decomposition of roots in the soil (Amery et al. 2007; Yuan et al. 2007; Wang and Mulligan 2013; Pérez-Esteban et al. 2013). Therefore, the organic matter content in the upper layers of the soil are maintained and some Cu remains on the soil surface because its electron configuration is [Ar]3d104s1, thus making it highly reactive
with the functional groups of organic matter that contain S and N, in addition to the carboxyl and phenolic functional groups (Croué et al. 2003). Furthermore, organic compounds provide Cu with high binding energy and low desorption (Lair et al. 2006; Casali et al. 2008; Brunetto et al. 2013).
In the case of the orchards, especially O18, the higher Cu content, represented by CuTotal, can be attributed to the
22 annual fungicide applications throughout the years. In addition to the factors mentioned above, the fresh pulp of apple fruit is between 2 and 4 mg·kg–1 Cu (Stüpp
et al. 2013). In this sense, an orchard with production of Figure 2. The ratio between the principal component 1 (factor 1)
and principal component 2 (factor 2), mean levels of (a) Cu and
(b) Zn in the layer at 0.0 – 0.40 m. Cusol and ZnSol – soluble fraction
extracted with H2O; CuE and ZnE – exchangeable fraction extracted
with MgCl2 1.0 mol·L–1; Cu
Min and ZnMin – mineral fraction extracted with
NH2OHHCl 0.04 mol L–1 in 25% CH
3COOH; CuOM andZnOM – organic
fraction extracted with HNO3 0.02 mol·L–1 + 8 mL of 30% H
2O2; CuSum
and ZnSum – sum of all fractions; and CuRes and CuRes – residual fraction
extracted with HNO3 + HCL + H2O2.
Factor 1: 93.19%
-1.5 -1.0 -0.5 0.0 0.5 1.0 1.5
Factor 2: 5.77%
-1.5 -1.0 -0.5 0.0 0.5 1.0 1.5 Znsum ZnSol ZnRes ZnOM ZnMin ZnE P18 P8
Factor 1: 95.40%
-1.5 -1.0 -0.5 0.0 0.5 1.0 1.5
60 t·ha–1 has exported 0.24 kg·ha–1 Cu, a fact that contributes
to a higher accumulation of this trace element in the soil. Cu accumulation in the orchards was also favored because the relief at the site of the orchards is gently undulating, and cover crops are planted between the orchard rows, favoring the deposition of plant residues on the soil surface, which minimizes the transfer of Cu by the drained solution (Loures et al. 2006; Pinho et al. 2006). The higher Cu content in the soil – mostly in the organic fraction (CuOM), compared with other fractions (CuRes, CuMin,
CuE and CuSol), especially in the surface layer (0.0 – 0.25 m), with
increasing age of the orchards (eight years for O8 and 18 years for O18) and, therefore, a larger number of Cu-containing fungicide applications and higher nutrient-cycling time – can be attributed to high affinity and reactivity with the functional groups of the soil organic matter (Pérez-Novo et al. 2008). Therefore, because Cu is part of the organic fraction, the adoption of conservation management practices in orchards is crucial, for example, the deposition and maintenance of plant residues on the soil surface helps maintain the levels of soil organic matter and the absence of soil disturbance minimizes the mineralization of organic matter (Ferreira et al. 2013; López-Piñeiro et al. 2013). Nevertheless, the migration of the Cu to a depth of 0.40 m in the soil of orchards O8 and O18 was observed through the level of CuTotal and CuOM,
CuMin and CuRes fractions, (Table 3, Figure 1). This may have
happened due to the saturation of functional groups of organic matter (Besnard et al. 2001; Croué et al. 2003), by the saturation of functional groups of Fe and Mn oxides (Bradl 2004), and the silanol and aluminol groups of phyllosilicates (Sposito 1989; McBride 1994). Furthermore, the decrease in pH values in the soil profile (Table 1) may change the sorption capacity of the clay minerals, especially iron oxides (Sposito 1989). At acidic pH values, sorption is lower and desorption is facilitated (Brunetto et al. 2013).
The highest levels of ZnTotal, in particular, as has occurred with
Cu in the most superficial soil layer (0.0 – 0.025 m), mainly in the soil of orchards O8 and O18, are due to the unidirectional annual applications of fungicides containing Zn in their composition, such as Mancozeb (Komárek et al. 2010), Zn being washed off the surface of leaves by rainfall, and deposition of Zn-containing leaves or pruned branches (Fernández-Calviño et al. 2012; Brunetto et al. 2014; Duplay et al. 2014). Furthermore, the higher accumulation of ZnTotal in the surface layers of the soil of the orchards, particularly
orchard O18, is associated with a larger number of Zn-containing foliar fungicide applications for the preventive control of fungal diseases over the years (Brunetto et al. 2013). As seen for Cu, accumulation of Zn forms on the surface is also associated with
an absence of soil disturbance in the rows and between the rows of apple trees, in addition to Zn cycling in the soil by the ground cover plants located in the rows and between rows of orchards (Couto et al. 2015; Hristovski et al. 2014).
In all soil layers of NP and orchards O8 and O18, higher levels of Zn were observed in the ZnRes and ZnMin fractions (Table 4 and
Figure 3b), and these fractions are more stable and characterized by low availability and mobility in soil (Ramos 2006; Fernández-Calviño et al. 2012). ZnTotal and the ZnE, ZnMin and ZnR fractions
(Table 4 and Figure 3b) showed migration of Zn to 0.40 m depth. This may have occurred because of the migration of Zn by the flow of water in the soil because a fraction of Zn tends to remain in the soil solution in free form or as soluble ionic pairs (Citeau et al. 2003) and also by turbulent water flow in macropores and by soil cracks or even bioturbation (Girotto et al. 2010; Brunetto et al. 2013). In addition, Zn can bind to organic acids with low molecular weight, increasing its mobility in the soil profile (Wang and Mulligan 2013). This may occur because the formation of metal complexes with organic compounds with low molecular weight alters the balance between the metals in the labile form in the solid phase and in the soil solution, thus, dissolved organic compounds can also increase the release of Cu in the solid phase, and consequently increase its mobility in the soil (Girotto et al. 2010). In addition, Zn mobility may have been facilitated because of the decrease in water pH in the deeper layers of the soil, contributing to the formation of stable (innersphere) complexes between Zn and the functional groups of organic and mineral fractions of soil (Brunetto et al. 2013).
The increase in the ZnE fraction in the soil profile, which is a
bioavailable fraction (Tessier et al. 1979) especially in the orchard O18 (Table 4), increases the potential for contamination of subsoil water (Banas et al. 2010; Fernández-Calviño et al. 2012). However, the increase in ZnE in the upper layers, where the roots
of apple trees and ground cover plant species are located in the rows and inter-rows of the orchards, may potentiate toxicity to plants (Nagajyoti et al. 2010; Fernández-Calviño et al. 2012). One example is the data obtained by Zhang et al. (2013) and Hansi et al. (2014). The first authors, studying the length of barley (Hordeum vulgare) roots grown in soil in a greenhouse with the addition of 0, 12.5, 25, 50, 100, 200, 400 and 800 mg Cu·kg–1,
observed that root elongation drastically decreases with increasing Cu in solution.
well as reducing transportation of the solution on the soil surface. Moreover, it helps maintain the organic matter content in the soil (Brunetto et al. 2013). The increased Zn concentration in the soil can also cause toxicity to microorganisms, adversely affecting, for example, the decomposition of the crop residue deposited on the ground and the mineralization of soil organic matter (Gillera et al. 1998). ZnE also increases in the most superficial soil layer, which
can enhance the transfer of Zn on the soil surface by the solution drained or adsorbed in the sediment (Fernández-Calviño et al. 2008; Fernández-Calviño et al. 2012), which, in turn, enhances contamination of surface water adjacent to the orchards.
CONCLUSION
The Cu and Zn fractions increased in the surface soil layer (0.0 – 0.025 m) of apple orchards compared to native pasture cultivation, being associated with the time of cultivation.
Most Cu was distributed in the less stable organic fraction in the upper layers of apple orchards, which may potentiate toxicity to plants and transfer Cu to subsurface waters. In deeper layers, however, Cu was also distributed in the residual and mineral fractions, which are more stable.
0.0-0.025 m
P18 P8
Relative Percentage of the Sum of Fractions
0.0
25
-0.0
5 m
P18 P8
0.10-0.15 m
0 10 20 30 40 50 60 70 80 90 100
0.05-0.10 m
P18 P8
0.15-0.20 m
0 10 20 30 40 50 60 70 80 90 100
0.20-0.40 m
ZnSol ZnE ZnMin ZnOM ZnRes NP
NP
NP
Most Zn in the soil of apple orchards was distributed in the residual and mineral fractions, indicating low mobility, as well as potential toxicity to plants.
ACKNOWLEDGEMENTS
We are thankful to the CNPq (National Council for Scientific and Technological Development) for its financial support and for the research productivity grant awarded to the first author.
ORCID IDs
G. Brunetto
https://orcid.org/0000-0002-3174-9992
L. Benedet
https://orcid.org/0000-0002-0560-8790
V. G. Ambrosini
https://orcid.org/0000-0001-9069-850X
J. J. Comin
https://orcid.org/0000-0002-6176-6208
G. W. B. de Melo
https://orcid.org/0000-0001-5825-3500
M. A. dos Santos
https://orcid.org/0000-0003-2814-0788
C. R. Lourenzi
https://orcid.org/0000-0002-0347-0003
A. Loss
https://orcid.org/0000-0002-3005-6158
P. Belli Filho
https://orcid.org/0000-0003-4338-2830
D. E. Schmitt
https://orcid.org/0000-0001-9665-9704
R. Couto
https://orcid.org/0000-0003-1071-4165
Associação Catarinense de Empresas de Tecnologia (2014). Agronegócio e tecnologia. Anuário 2014. Estado de Santa Catariana. Available at: http://www.acate.com.br/sites/default/ files/anuarioacate_0.pdf. Accessed on April 27, 2016.
Amery, F., Degryse, F., Degeling, W., Smolders, E. and Merckx, R. (2007). The copper-mobilizing-potential of dissolved organic matter in soils varies 10-fold depending on soil incubation and extraction procedures. Environmental Science & Technology, 41, 2277-2281. http://doi.org/10.1021/es062166r.
Banas, D., Marin, B., Skraber, S., Chopin, E. I. B. and Zanella, A. (2010). Copper mobilization affected by weather conditions in a stormwater detention system receiving runoff waters from vineyard soils (Champagne, France). Environmental Pollution, 158, 476-482. http://doi.org/10.1016/j.envpol.2009.08.034.
Besnard, E., Chenu, C. and Robert, M. (2001). Influence of organic amendments on copper distribution among particle-size and density fractions in Champagne vineyard soils. Environmental Pollution, 112, 329-337. https://doi.org/10.1016/ S0269-7491(00)00151-2.
REFERENCES
Bradl, H. B. (2004). Adsorption of heavy metal ions on soils and soils constituents. Journal of Colloid and Interface Science, 277, 1-18. http://doi.org/10.1016/j.jcis.2004.04.005.
Brunetto, G., Miotto, A., Ceretta, C. A., Schmitt, D. E., Heinzen, J., Moraes, M. P., Canton, L., Tiecher, T., Comin, J. J. and Girotto E. (2014). Mobility of copper and zinc fractions in fungicide-amended vineyard sandy soils. Archives of Agronomy and Soil Science, 60, 609-624. http://doi.org/10.1080/0365034 0.2013.826348.
Casali, C. A., Moterle, D. F., Rheinheimer, D. S., Brunetto, G., Corcini, A. L. M., Kaminski, J. and Melo, G. W. B. (2008). Formas e dessorção de cobre em solos cultivados com videira na Serra Gaúcha do Rio Grande do Sul. Revista Brasileira de Ciência Solo, 32, 1479-1487. http://doi.org/10.1590/
S0100-06832008000400012.
Couto, R. R., Benedet, L., Comin, J. J., Belli Filho, P., Martins, S. R., Gatiboni, L. C., Radetski, M., Valois, C. M., Ambrosini, V. G. and Brunetto, G. (2015). Accumulation of copper and zinc fractions in vineyard soil in the mid-western region of Santa Catarina, Brazil. Environmental Earth Sciences, 73, 6379-6386. http://doi.org/10.1007/s12665-014-3861-x.
Croué, J. P., Benedetti, M. F., Violleau, D. and Leenheer, J. A. (2003). Characterization and copper binding of humic and nonhumic organic matter isolated from the south platte river: evidence for the presence of nitrogenous binding site. Environmental Science & Technology, 37, 328-336. http://doi.org/10.1021/es020676p.
Duplay, J., Semhi, K., Errais, E., Imfeld, G., Babcsanyi, I. and Perrone, T. (2014). Copper, zinc, lead and cadmium bioavailability and retention in vineyard soils (Rouffach, France): the impact of cultural practices. Geoderma, 230-231, 318-328. http://doi. org/10.1016/j.geoderma.2014.04.022.
Empresa Brasileira de Pesquisa Agropecuária (1997). Manual de métodos de análise de solo. Centro Nacional de Pesquisas de Solo, Rio de Janeiro: Embrapa-CNPS.
Empresa Brasileira de Pesquisa Agropecuária (2013). Sistema Brasileiro de Classificação de Solos (Brazilian System for Soil Classification). Centro Nacional de pesquisas de solo, Rio de Janeiro: Embrapa-CNPS.
Empresa de Pesquisa Agropecuária e Extensão Rural de Santa Catarina (2013). Síntese Anual da Agricultura de Santa Catarina. Instituto de Planejamento e Economia Agrícola de Santa Catarina. Available at: http://docweb.epagri.sc.gov.br/website_cepa/ publicacoes/Sintese_2014.pdf. Accessed on May 5, 2016.
Fe r n á n d e z Ca l v i ñ o, D. , Pa t e i ro M o u re , M . , Ló p e z -Periago, E., Arias-Estévez, M. and Nóvoa-Muñoz, J. C. (2008). Copper distribution and acid-base mobilization in vineyard soils and sediments from Galicia (NW Spain). European Journal of Soil Science, 59, 315-326. http://doi. org/10.1111/j.1365-2389.2007.01004.x.
Fernández-Calviño, D., Pateiro-Moure, M., Nóvoa-Muñoz, J. C., Garrido-Rodrigues, B. and Arias-Estévez, M. (2012). Zinc distribution and acid-base mobilization in vineyard soils and sediments. Science of the Total Environment, 414, 470-479.
http://doi.org/10.1016/j.scitotenv.2011.10.033.
Fernández-Calviño, D., Soler-Rovira, P., Polo, A., Arias-Estévez, M. and Plaza, C. (2010). Influence of humified organic matter on copper behavior in acid polluted soils. Environmental Pollution, 158, 3634-3641. http://doi.org/10.1016/j.envpol.2010.08.005.
Ferreira, A. O., Amado, T. J. C., Nicoloso, R. S., Sá, J. C. M., Fiorin, J. E., Hansel, D. S. S. and Menefee, D. (2013). Soil carbon stratification affected by long-term tillage and cropping systems in southern Brazil. Soil and Tillage Research, 133, 65-74. http:// doi.org/10.1016/j.still.2013.05.011.
Frankowski, M., Zioła-Frankowska, A., Kowalski, A. and Siepak, J. (2010). Fractionation of heavy metals in bottom sediments using Tessier procedure. Environmental Earth Sciences, 60, 1165-1178. http://doi.org/10.1007/s12665-009-0258-3.
Gillera, K. E., Witerb, E. and McGrathc, S. P. (1998). Toxicity of heavy metals to microorganisms and microbial processes in agricultural soils: a review. Soil Biology and Biochemistry, 30, 1389-1314. https://doi.org/10.1016/S0038-0717(97)00270-8.
Girotto, E., Ceretta, C. A., Brunetto, G., Santos, D. R., Silva, L. S., Lourenzi, C. R., Lorensini, F., Vieira R. C. B. and Schmatz, R. (2010). Acúmulo e formas de cobre e zinco no solo após aplicações sucessivas de dejeto líquido de suínos. Revista Brasileira de Ciência do Solo, 34, 955-965. http://dx.doi. org/10.1590/S0100-06832010000300037.
Hansi, M., Weidenhamer, J. D. and Sinkkonen, A. (2014). Plant growth responses to inorganic environmental contaminants are density-dependent: experiments with copper sulfate, barley and lettuce. Environmental Pollution, 184, 443-448. http://doi. org/10.1016/j.envpol.2013.09.027.
Herlihy, M. and McCarthy, J. (2006). Association of soil test phosphorus with phosphorus fractions and adsorption characteristics. Nutrient Cycling in Agroecosystems, 75, 79-90. http://doi.org/10.1007/s10705-006-9013-2.
Hristovski, S., Berg, B. and Melovski, L. (2014). Limitless decomposition in leaf litter of Common beech: patterns, nutrients’ and heavy metal’s dynamics. Pedobiologia, 57, 131-138. http://doi.org/10.1016/j.pedobi.2014.01.005.
Kaminski, J., Gatiboni, L. C., Rheinheimer, D. S., Martins, J. R., Santos, E. J. S. and Titssot, C. A. (2002). Estimativa da acidez potencial em solos e sua implicação no cálculo da necessidade de calcário. Revista Brasileira de Ciência do Solo, 26, 1107-1113. http://doi.org/10.1590/S0100-06832002000400029.
Lair, G. J., Gerzabek, M. H., Haberhauer, G., Jakusch, M. and Kirchmann, H. (2006). Response of the sorption behavior of Cu, Cd, and Zn to different soil management. Journal of Plant Nutrition and Soil Science, 169, 60-68. http://doi.org/10.1002/jpln.200521752.
López-Piñeiro, A., Muñoz, A., Zamora, E. and Ramírez, M. (2013). Influence of the management regime and phenological state of the vines on the physicochemical properties and the seasonal fluctuations of the microorganisms in a vineyard soil under semi-arid conditions. Soil and Tillage Research, 126, 119-126. http://doi.org/10.1016/j.still.2012.09.007.
Loures, A. P. S., Soares, A. A., Matos, A. T., Cecon, P. R. and Pereira, O. G. (2006). Remoção de fósforo em sistema de tratamento de esgoto doméstico, por escoamento superficial. Revista Brasileira de Engenharia Agrícola e Ambiental, 10, 706-714. http://dx.doi.org/10.1590/S1415-43662006000300025.
Mackie, K. A., Müller, T. and Kandeler, E. (2012). Remediation of copper in vineyards – a mini review. Environmental Pollution, 167, 16-26. http://doi.org/10.1016/j.envpol.2012.03.023.
Marchand, L., Nsanganwimana, F., Cook, B. J., Vystavna, Y., Huneau, F., Le Coustumer, P., Lamy, J. B., Oustrière, N. and Mench, M. (2014). Trace element transfer from soil to leaves of macrophytes along the Jalle d’Eysines River, France and their potential use as contamination biomonitors. Ecological Indicators, 46, 425-437. http://doi.org/10.1016/j.ecolind.2014.07.011.
McBride, M. B. (1994). Environmental chemistry of soils. New York: Oxford University Press.
Michaud, A. M., Bravin, M. N., Galleguillos, M. and Hinsinger, P. (2007). Copper uptake and phytotoxicity as assessed in situ for durum wheat (Triticum turgidum durum L.) cultivated in Cu-contaminated, former vineyard soils. Plant and Soil, 298, 99-111. http://doi.org/10.1007/s11104-007-9343-0.
Mileusnić, M., Mapani, B. S., Kamona, A. F., Ružičić, S., Mapaure, I. and Chimwamurombe, P. M. (2014). Assessment of agricultural soil contamination by potentially toxic metals dispersed from improperly disposed tailings, Kombat mine, Namibia. Journal of Geochemical Exploration, 144, 409-420. http://doi. org/10.1016/j.gexplo.2014.01.009.
Murphy, J. and Riley, J. P. (1962). A modified single solution method for the determination of phosphate in natural waters. Analytica Chimica Acta, 27, 31-36. http://dx.doi.org/10.1016/ S0003-2670(00)88444-5.
Nagajyoti, P. C., Lee, K. D. and Sreekanth, T. V. M. (2010). Heavy metals, occurrence and toxicity for plants: a review. Environmental Chemistry Letters, 8, 199-216. http://doi. org/10.1007/s10311-010-0297-8.
Pandolfo, C., Braga, H. J., Silva Jr., V. P., Massignam, A. M., Pereira, E. S., Thomé, V. M. R. and Valci, F. V. (2002). Atlas climatológico do Estado de Santa Catarina. Florianópolis: Epagri. CD-Rom.
Pérez-Esteban, J., Escolástico, C., Moliner, A. and Masaguer, A. (2013). Chemical speciation and mobilization of copper and zinc in naturally contaminated mine soils with citric and tartaric acids. Chemosphere, 90, 276-283. http://doi.org/10.1016/j. chemosphere.2012.06.065.
Pérez-Novo, C., Pateiro-Moure, M., Osorio, F., Nóvoa-Muñoz, J. C., López-Periago, E. and Arias-Estévez, M. (2008). Influence of organic matter removal on competitive and noncompetitive adsorption of copper and zinc in acid soils. Journal of Colloid and Interface Science, 322, 33-40. http://doi.org/10.1016/j.jcis.2008.03.002.
Pinho, A. P., Matos, A. T., Costa, L. M., Morris, L. A. and Martinez, M. A. (2006). Modelagem da retenção de herbicidas em zonas ripárias. Revista Brasileira de Engenharia Agrícola e Ambiental, 10, 896-902. http://dx.doi.org/10.1590/ S1415-43662006000400017.
Ramos, M. C. (2006). Metals in vineyard soils of the Penedès area (NE Spain) after compost application. Journal of Environmental Management, 78, 209-215. http://doi.org/10.1016/j. jenvman.2005.04.017.
Ruyters, S., Salaets, P., Oorts, K. and Smolders, E. (2013). Copper toxicity in soils under established vineyards in Europe: a survey. Science of the Total Environment, 443, 470-477. http:// doi.org/10.1016/j.scitotenv.2012.11.001.
Sposito, G. (1989). The chemistry of soils. New York: Oxford University Press.
Stüpp, J. J., Rosa, E. F. F., Amarante, C. V. T., Mafra, A. L. and Steffens, C. A. (2013). Nutrição, sanidade, rendimento e qualidade de frutos em macieiras ‘Catarina’ conduzidas sob manejo integrado e orgânico. Revista Brasileira de Fruticultura, 35, 634-641. https://dx.doi.org/10.1590/S0100-29452013000200036.
Tessier, A., Campbell, P. G. C. and Bisson, M. (1979). Sequential extraction procedure for the speciation of particulate trace metals. Analytical Chemistry, 51, 844-851. http://doi.org/ http://10.1021/ac50043a017.
Toselli, M., Schiatti, P., Ara, D., Bertacchini, A. and Quartieri, M. (2009). The accumulation of copper in soils of the Italian region Emilia-Romagna. Plant, Soil and Environment, 55, 74-79. https:// doi.org/10.17221/317-PSE.
Verdisson, S., Couderchet, M. and Vernet, G. (2001). Effects of procymidone, fludioxonil and pyrimethanil on two non-target aquatic plants. Chemosphere, 44, 467-474. https://doi.org/10.1016/ S0045-6535(00)00468-9.
Wang, S. and Mulligan, C. N. (2013). Effects of three low-molecular-weight organic acids (LMWOAs) and pH on the mobilization of arsenic and heavy metals (Cu, Pb, and Zn) from mine tailings. Environmental Geochemistry and Health, 35, 111-118. http:// doi.org/10.1007/s10653-012-9461-3.
Yadav, S. K. (2010). Heavy metals toxicity in plants: an overview
on the role of glutathione and phytochelatins in heavy metal
stress tolerance of plants. South African Journal of Botany
,
76,167-179. http://doi.org/10.1016/j.sajb.2009.10.007.
Yuan, S., Xi, Z., Jiang, Y., Wan, J., Wu, C., Zheng, Z. and Lu, X.
(2007). Desorption of copper and cadmium from soils enhanced
by organic acids. Chemosphere, 68, 1289-1297. http://doi.
org/10.1016/j.chemosphere.2007.01.046.
Zhang, X., Wang, X., Wei, D., Li, B., Ma, Y. and Huang, Z. (2013).
The influence of soil solution properties on phytotoxicity of
soil soluble copper in a wide range of soils. Geoderma,