Rev. Caatinga
USE OF TREATED SEWAGE AS WATER AND A NUTRITIONAL SOURCE FOR
BEAN CROPS
1CLEY ANDERSON SILVA DE FREITAS2*, JOSÉ ADEILSON MEDEIROS DO NASCIMENTO2, FRANCISCO
MARCUS LIMA BEZERRA3, RONNEY MENDES MAGALHÃES DE LIMA4
ABSTRACT- Considering the relevance of the reduction or replacement of fresh water supplies for irrigation, to mitigate the use of agricultural fertilizers and to improve sustainability, this study aimed to evaluate water and nutritional efficiency of treated sewage in cowpea plots. The experiment was conducted in the city of Tianguá-CE, on land belonging to the Water and Sewage Treatment Company of Ceará. It used a randomized block design for the arrangement of split plots. The plots contained two water sources (treated sewage and well water). The subplots contained four irrigation levels based on potential evapotranspiration (50%, 75%, 100%, and 125% of ETc) and the sub-subplots contained four nitrogen, phosphorous, and potassium (NPK) levels (0%, 33%, 66%, and 99% of the nutritional recommendations for cowpea cultivation). The yield variables, number of pods per plant, bean numbers per pod, and bean production, were improved with increased irrigation, regardless of the water source. Examining NPK levels in particular, yields differed depending on the water source. The use of treated domestic wastewater for bean irrigation can replace up to 100% of commercial fertilizers.
Keywords: Vigna unguiculata. Trickle. Recycle. Fertilizing.
USO DO ESGOTO DOMÉSTICO TRATADO COMO FONTE HÍDRICA E NUTRICIONAL PARA A CULTURA DO FEIJOEIRO
RESUMO- Objetivou-se com o presente trabalho quantificar os componentes de produtividade da cultura do feijão submetida a diferentes lâminas de irrigação com água de poço e esgoto doméstico tratado em solo com diferentes níveis de adubação NPK. O experimento foi conduzido em Tianguá - CE, na área da Estação de Tratamento de Esgoto da Companhia de Água e Esgoto do Ceará. Foi utilizado o delineamento em blocos casualizados, em parcelas subsubdivididas 2 x 4 x 4, referente à duas fontes hídricas (efluente de esgoto doméstico tratado e água de poço amazonas) nas parcelas, quatro lâminas de irrigação baseadas na evapotranspiração potencial (50, 75, 100 e 125% da ETc) nas subparcelas e nas subsubparcelas quatro níveis de NPK (0, 33, 66 e 99%) da recomendação nutricional para a cultura. As variáveis analisadas, número de vagens por planta, números de grãos por vagem e produtividade de grãos aumentaram em função do incremento da lâmina de irrigação, independente da fonte hídrica. Quanto ao tratamento níveis de NPK, os resultados produtivos divergiram em função da fonte hídrica. O uso do efluente esgoto doméstico tratado na irrigação do feijoeiro pode substituir até 100% dos fertilizantes comerciais.
Palavras-chave: Vigna unguiculata. Irrigação. Reúso de água. Adubação.
____________________
*Corresponding author
1Received for publication in 12/09/2016; accepted in 05/30/2017.
Paper extracted from the Master dissertation of the fourth author.
2Instituto Federal de Educação Ciências e Tecnologia do Ceará, Tianguá, CE, Brazil; [email protected], [email protected].
3Department of Soil Science, Universidade Federal do Ceará, Fortaleza, CE, Brazil; [email protected].
INTRODUCTION
Cowpea is a crop of economic importance in the northeast region of Brazil. However, when compared to the national average (914 kg ha-1), the
low average productivity of the region (330 kg ha-1)
compromises both the agricultural and economic viability of this crop. This is mainly due to the water and nutrient shortage that is characteristic of the soil and climate of the region (PELEGRIN et al., 2009; LOCATELLI et al., 2014).
Irrigation can complement, or even completely replace, rainfall during drought periods, ensuring agricultural production. Andrade Júnior, Rodrigues and Frizzone (2002) evaluated the productivity of irrigated beans, registering values up to 2,809 kg ha-1, at an irrigation depth of 449.1 mm.
This result is similar to the value of 2,946.52 kg ha-1
measured by Mantovani et al. (2012) at 418.16 mm of depth, with irrigation irregularly distributed throughout the crop cycle.
In addition to irrigation, a factor that contributes significantly to increasing bean yield is an adequate supply of nutrients, especially nitrogen (N), phosphorus (P), and potassium (K). Pelegrin et al. (2009) used different levels of N, and obtained a productivity of 3,762 kg ha-1 from 160 kg ha-1 of
fertilizer. When considering P in particular, Silva et al. (2010) observed maximum yield values of 1,177 kg ha-1 from an application of 90 kg ha-1 of
P2O5. Oliveira et al. (2007) assessed the yield potential of the beans as a function of potassium
fertilization and found a greater yield, 25,300 kg ha-1,
with an application of 171 kg ha-1 of K
2O. In addition to water, treated domestic sewage can be used as an alternative source of nutrients for bean cultivation.
In this context, the study aimed to quantify bean productivity and productivity components, at various irrigation depth levels, using both water and treated domestic sewage in soil with differing amounts of NPK fertilizers.
MATERIAL AND METHODS
The experiment was conducted from October to December 2014 on land belonging to the Companhia de Água e Esgoto do Estado do Ceará (CAGECE), in the municipality of Tianguá, Ceará (CE) (located at latitude: 3°44ʹ16ʹʹS; longitude: 40°59ʹ30ʹʹW; medium altitude: approximately 740 m). According to the Köppen classification, the climate in the region can be classified as Aw (tropical dry climate), with average temperatures of 26 °C and average annual rainfall of 1,350 mm.
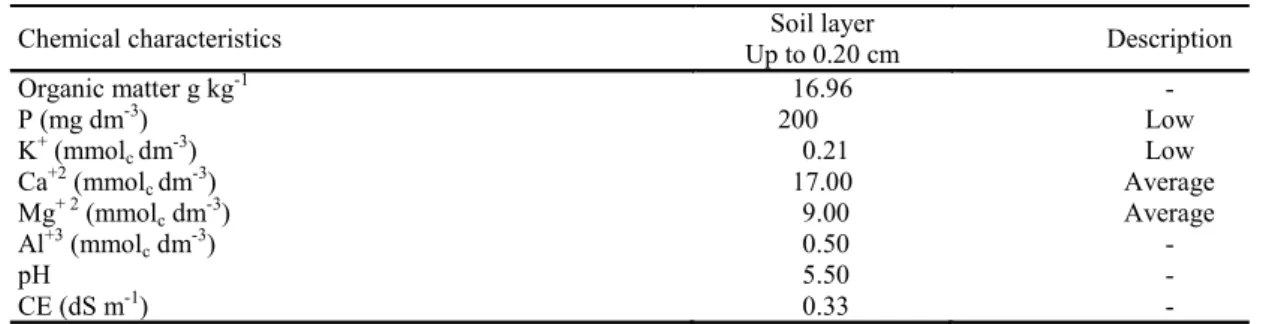
When preparing for the experiment, soil samples from the experimental area were collected in layers of up to 0.20 m. These samples were later sent to the Laboratório de Solos at the Federal University of Ceará, and the results from the chemical analysis have been displayed in Table 1.
Table 1. Soil chemical attributes of the experimental area, Tianguá, CE.
Chemical characteristics Soil layer
Up to 0.20 cm Description
Organic matter g kg-1 16.96 -
P (mg dm-3) 200 Low
K+ (mmol
cdm-3) 0.21 Low
Ca+2 (mmolc dm-3) 17.00 Average
Mg+ 2 (mmolc dm-3) 9.00 Average
Al+3 (mmolc dm-3) 0.50 -
pH 5.50 -
CE (dS m-1) 0.33 -
1
Extractors: P, Na, and K; Mehlich: Ca, Mg, and Al; KCl: pH water (1:2.5).
Soils were prepared by slicing and cross -grading. Additionally, 3 kg m-2 of tanned bovine
manure was used, to increase organic matter concentration and therefore, to structurally improve the soil in the experimental area, following the recommendation given by Amaro et al. (2007). Cowpea (Vigna unguiculata) BRS Marataoã was planted in the experimental area with a spacing of 0.30 × 0.50 m, to evaluate the treatments.
The experiment followed a random block with split-plot designs, with four replications, in a 2 × 4 × 4 factorial, with two sources of water (well water and treated domestic sewage), four irrigation
depth levels (50%, 75%, 100%, and 125% of the crop evapotranspiration (ETc)), and four combined levels of NPK (0%, 33%, 66%, and 100%). The plots parameters comprised water type, subplots of four irrigation depth levels, and the sub-subplots of the NPK levels.
Rev. Caatinga
recommended upper limits of 150 kg ha-1 of N,
120 kg ha-1 of Pand 90 kg ha-1 of K (BRASIL,
2013).
Each sub-subplot had five rows of plants. Central rows were treated as useful lines, whereas side rows served as the borders. Every row took up an area of 2.5 m2 (0.5 × 5.0 m), with 34 plants.
The domestic sewage effluent that was used came from households in the municipality of Tianguá (CE), and was serially treated by a waste stabilization pond system. In the first pond, which had a small water surface and was considerably
deep, anaerobic bacteria aided in the process of flocculation and separation of solid particles. The second (facultative) pond was shallow and characterized by a large surface area, water treatment was performed by aerobic bacteria, algae, and solar radiation. The third and fourth pounds were called maturation ponds, and were similar in design to the facultative pond. The sewage effluent used for irrigation was taken from the maturation ponds. Samples of the treated sewage effluent used for the experiment were analyzed, and the results are displayed in Table 2.
Table 2. Chemical analysis of the sewage effluent samples.
Item Parameters Results
1 pH 7.7
2 EC (µs cm-1) 1040.0
3 Total Solids (mg L-1) 742.0
4 Total Suspended Solids (mg L-1) 68.0
5 Total Dissolved Solids (mg L-1) 674.0
6 Total Alkalinity (mg CaCO3 L -1
) 224.1
7 Calcium (mg L-1) 11.9
8 Magnesium (mg L-1) 15.8
9 Chloride (mg L-1) 217.4
10 Sodium (mg L-1) 164.6
11 Potassium (mg L-1) 36.4
12 Total Ammonia (mg N L-1) 7.5
13 COD (mg L-1) 324.3
14 Total Phosphorus (mg L-1) 7.4
EC, Electrical conductivity; COD, Chemical oxygen demand.
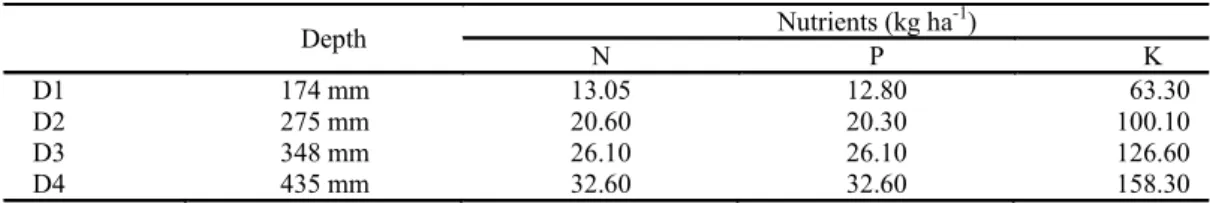
Table 3 shows the NPK concentrations of the treated sewage effluent as a function of irrigation depth level.
The evaluated yield variables were: number of pods per plant (NPP), number of beans per pod (NBP), mass of 100 beans (M100B), and bean
productivity (BP).
The data were subjected to analysis of variance, carried out using the F-test with 1% and 5% cutoffs of probability. The programs ASSISTAT® (beta version 7.6) and SAEGD® (version 9.0) were used to perform the statistical analyses.
Depth Nutrients (kg ha
-1
)
N P K
D1 174 mm 13.05 12.80 63.30
D2 275 mm 20.60 20.30 100.10
D3 348 mm 26.10 26.10 126.60
D4 435 mm 32.60 32.60 158.30
Table 3. NPK concentration in treated sewage effluent as a function of irrigation depth level.
RESULTS AND DISCUSSION
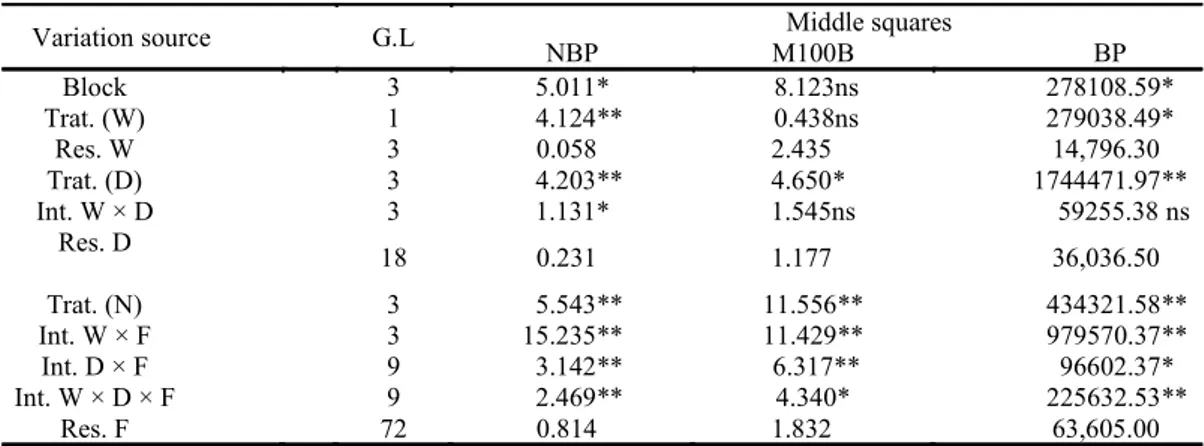
According to the analyses of variance, the two water sources significantly influenced the NBP and BP. In addition, all analyzed variables were noticeably influenced by irrigation depth levels (D), NPK fertilizer levels (F), and the plot dimensions W × D × N (Table 4).
Table 5 shows the highest average of NBP (12.39) was obtained using treated sewage effluent.
When compared to the average (12.03) obtained
using well water, the difference is significant (Table 5). The corresponding average values of NBP
Table 4. Summary of the analysis of variance of the data given for number of beans per pod (NBP), mass of 100 beans (M100B), and bean productivity (BP) using two water sources (W), four irrigation depth levels (D), and four NPK levels (F).
Variation source G.L Middle squares
NBP M100B BP
Block 3 5.011* 8.123ns 278108.59*
Trat. (W) 1 4.124** 0.438ns 279038.49*
Res. W 3 0.058 2.435 14,796.30
Trat. (D) 3 4.203** 4.650* 1744471.97**
Int. W × D 3 1.131* 1.545ns 59255.38 ns
Res. D
18 0.231 1.177 36,036.50
Trat. (N) 3 5.543** 11.556** 434321.58**
Int. W × F 3 15.235** 11.429** 979570.37**
Int. D × F 9 3.142** 6.317** 96602.37*
Int. W × D × F 9 2.469** 4.340* 225632.53**
Res. F 72 0.814 1.832 63,605.00
**Significant at 1% probability; *Significant at 5% probability; ns, not significant.
Table 5. Average of number of beans per pod (NBP) as a function of two water sources (W), four irrigation depth levels
(D), and four NPK levels (F).
Water source Irrigation depth level (mm)
NPK level
AVERAGES
F1 F2 F3 F4
Number of beans per pod (NBP)
Well water
D1 174 13.22 11.54 11.86 12.06 12.17a
D2 275 10.72 11.93 13.27 12.69 12.15b
D3 348 10.63 12.23 12.00 10.31 11.29b
D4 435 11.51 12.00 13.06 13.48 12.51a
Averages 11.52B 11.93B 12.55A 12.14A 12.03b
Sewage
D1 174 13.03 12.76 11.79 11.16 12.19a
D2 275 13.65 13.51 12.06 10.93 12.54a
D3 348 13.66 13.38 11.02 10.62 12.17a
D4 435 13.57 12.13 13.47 11.53 12.68a
Averages 13.48A 12.95A 12.09A 11.06B 12.39a
Averages followed by different letters differ from each other by the Tukey's test at 5% probability. Lowercase letters correspond to columns, whereas uppercase letters correspond to rows.
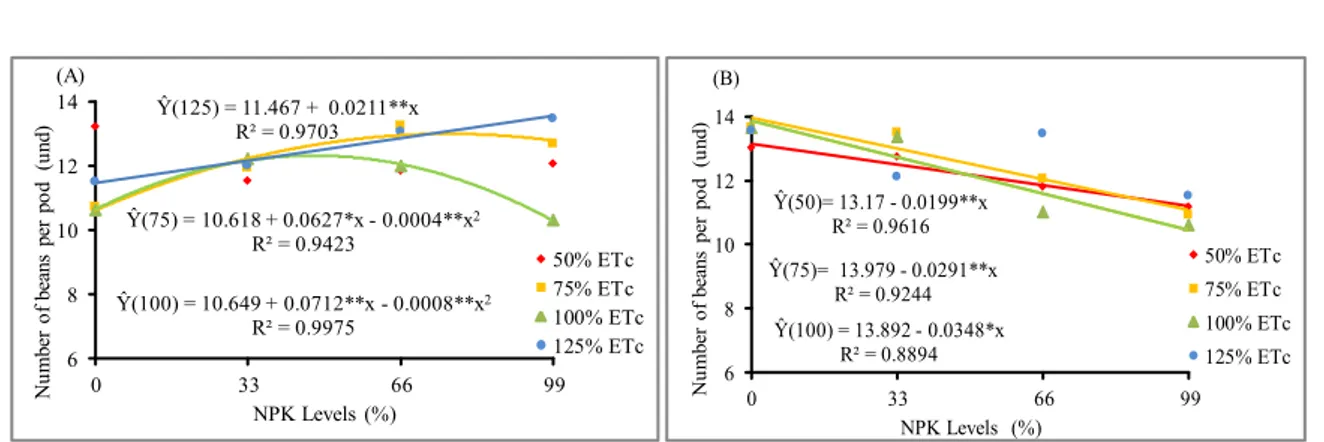
Regression analysis was employed to estimate NBP variability as a function of NPK levels, using well water and fixed irrigation depth (D). However, it was not possible to determine a mathematical model that fitted the data for the value of D, and was consistent with 50% of ETc. In addition, the mathematical model that best fitted the irrigation depth levels with 75%, 100%, and 125% of ETc was a quadratic function for the first two, and a linear function for the last one. NBP tended to increase as function of increasing fertilizer, peaking at 13.56 beans per pod for the treatments with 125% ETc and 99% of NPK (Figure 1A).
For plants irrigated using treated sewage (Figure 1B), with fixed irrigation depth levels and different NPK levels, the statistical model that best fitted the data was a linear function. The exception to this was the treatment corresponding to 125% of
ETc, for which no equation seemed to fit adequately, where an increase in NPK levels caused a reduction in NBP. The highest estimated NBP observed using sewage effluent was 13.98 and 13.89 with 75% and 100% ETc, respectively; commercial fertilizer N1 was not used in either case. It is possible that the excessive NPK levels were the result of an excess of these nutrients in the soil, because treated domestic sewage has a high concentration of these elements. This excess might also have resulted in antagonistic effects on other nutrients.
Rev. Caatinga Ŷ(75) = 10.618 + 0.0627*x - 0.0004**x2
R² = 0.9423
Ŷ(100) = 10.649 + 0.0712**x - 0.0008**x2 R² = 0.9975
Ŷ(125) = 11.467 + 0.0211**x
R² = 0.9703
6 8 10 12 14
0 33 66 99
N
u
m
b
er
o
f
b
ea
n
s
p
er
p
o
d
(u
n
d
)
NPK Levels (%)
50% ETc 75% ETc 100% ETc 125% ETc (A)
Ŷ(50)= 13.17 - 0.0199**x R² = 0.9616
Ŷ(75)= 13.979 - 0.0291**x R² = 0.9244
Ŷ(100) = 13.892 - 0.0348*x R² = 0.8894 6
8 10 12 14
0 33 66 99
N
u
m
b
er
o
f
b
ea
n
s
p
er
p
o
d
(u
n
d
)
NPK Levels (%)
50% ETc
75% ETc 100% ETc
125% ETc (B)
Figure 1. Number of beans per pod (NBP) as a function of NPK and irrigation depth levels for the beans irrigated with (A)
well water and (B) treated domestic sewage.
Table 6 shows the average mass of 100 beans (M100B) was 18.98 and 19.10 g using well water and treated domestic sewage, respectively, and they did not differ statistically. Independent of the water
source, these averages were higher than the 15.5 g observed for the same cultivar recorded by Freire Filho et al. (2005) and Teixeira et al. (2010).
Table 6. Average mass of 100 beans (M100B) as a function of two water sources (W), four irrigation depth levels (D), and
four NPK fertilization levels (F).
Water source Irrigation depth level (mm)
NPK level
AVERAGES
F1 F2 F3 F4
Mass of 100 beans (M100B)
Well water
D1 174 19.36 20.29 17.65 20.16 19.37a
D2 275 17.99 18.87 21.58 17.68 19.28ab
D3 348 16.91 20.53 17.02 18.15 18.15b
D4 435 18.56 19.19 19.43 19.32 19.12ab
Averages 18.20B 19.97A 18.92B 18.83B 18.98a
Sewage
D1 174 19.9 20.41 18.04 19.02 19.34a
D2 275 20.28 19.95 18.12 17.26 18.9ab
D3 348 19.6 19.6 19.39 16.71 18.83b
D4 435 20.33 18.58 19.82 18.54 19.32ab
Averages 20.03A 19.64A 18.84AB 17.88B 19.10a
Averages followed by different letters differ from each other by the Tukey's test at 5% probability. Lowercase letters correspond to columns, whereas uppercase letters correspond to rows.
Regarding the M100B data, it was not possible to find a simple mathematical model that explained the biological behavior of the data against the variation observed among the studied factors. The highest value of M100B noted in plants irrigated with well water was 21.58 g, obtained with an irrigation depth of 275 mm (75% of ETc) and 66% of recommended NPK (99 kg ha-1 of N, 79.2 kg ha-1 of
P, and 59.4 kg ha-1 of K). In contrast, for plants
grown using domestic sewage effluent the highest value was 20.33 g, obtained using a combination of an irrigation depth corresponding to 125% of ETc (435 mm) and 0% of NPK. One possible explanation for this performance without the use of commercial fertilizers may be the availability of NPK and other
nutrients in treated domestic sewage, which with an irrigation depth of 435 mm produced a total of 32.6 kg of N ha-1, 32.6 kg of P ha-1, and
158.3 kg of K ha-1. These were added in installments
throughout the cropping cycle.
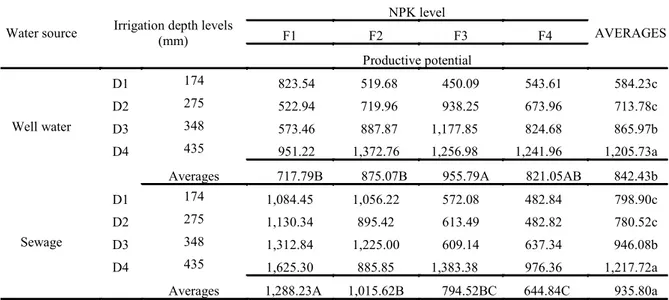
Table 7 shows that the highest productivity (935.8 kg ha-1) was observed in plants irrigated with
treated domestic sewage, differing significantly (P < 0.05) from the average of 842.4 kg ha-1 observed
Table 7. Averages of bean productivity (BP) as a function of two water sources (W), four irrigation depth levels (D), and four NPK levels (F).
Water source Irrigation depth levels (mm)
NPK level
AVERAGES
F1 F2 F3 F4
Productive potential
Well water
D1 174 823.54 519.68 450.09 543.61 584.23c
D2 275 522.94 719.96 938.25 673.96 713.78c
D3 348 573.46 887.87 1,177.85 824.68 865.97b
D4 435 951.22 1,372.76 1,256.98 1,241.96 1,205.73a
Averages 717.79B 875.07B 955.79A 821.05AB 842.43b
Sewage
D1 174 1,084.45 1,056.22 572.08 482.84 798.90c
D2 275 1,130.34 895.42 613.49 482.82 780.52c
D3 348 1,312.84 1,225.00 609.14 637.34 946.08b
D4 435 1,625.30 885.85 1,383.38 976.36 1,217.72a
Averages 1,288.23A 1,015.62B 794.52BC 644.84C 935.80a
Averages followed by different letters differ from each other by the Tukey's test at 5% probability. Lowercase letters correspond to columns, whereas uppercase letters correspond to rows.
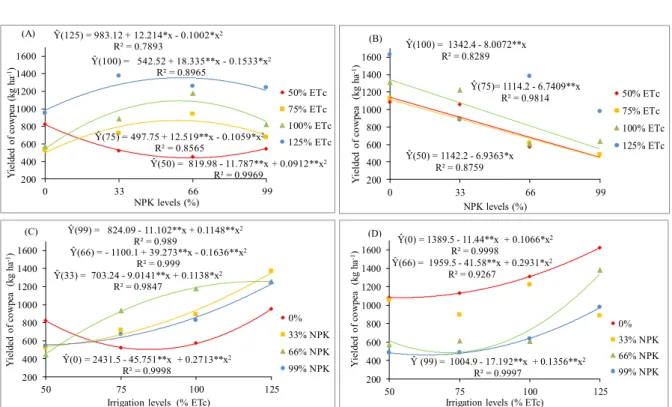
Assessing BP as a function of NPK levels for each irrigation depth yielded the quadratic function that best fitted the well water data (Figure 2A). BP tended to increase with NPK, except for the irrigation depth with 50% of ETc (174 mm) where yielded decreased as NPK increased. This could be explained by an increase in salt concentration in the soil tied to an increase in NPK, that is associated with water shortage. This effect was noted by Assis Júnior. et al. (2007), who concluded that increasing salinity decreases the bean yielded.
With respect to the plants irrigated using sewage, BP data was adjusted to fit a linear function, where a decrease in yielded levels and an increase in
NPK levels were observed. This can be associated with excess nutrients, because the sewage already contains nutrients (Figure 2B).
Viana et al. (2011) observed a quadratic effect on bean performance relating to nitrogen (N) and phosphorus (P) concentrations; N was tested at 0, 70,
140, and 210 kg ha-1 and P 0, 100, 200, and
300 kg ha-1 of P
2O5. The highest productivity (1,528 kg ha-1) was obtained with 98 kg ha-1 of N and
201 kg ha-1 of P, emphasizing that there is a limit to
these relationships; above that value, yielded decreases.
Analyzing the effect of irrigation depth levels on BP for every level of NPK, it was observed that the polynomial model had the best fit, regardless of water source. Additionally, higher water availability also contributed to increasing BP (Figure 2C and 2D). Andrade Júnior, Rodrigues and Frizzone (2002) experimented with the cowpea BR 14 Mulato using different irrigation depth levels, and noted the same quadratic behavior for the yielded of this plant.
The highest estimated potential yield was 1,355 kg ha-1 for plants irrigated with well water
equivalent to 125% of ETc (435 mm) and 66% of NPK. There was an increase of approximately 208% when compared to BP of 439 kg ha-1,corresponding
to the estimate for plants irrigated using well water, but with the lowest water availability, an irrigation depth equivalent to 50% of ETc, and 64% of NPK. These results demonstrated the importance of irrigation and efficient fertilization for increasing yield. Mantovani et al. (2012) observed a maximum yielded for the common bean of 2,946.52 kg ha-1
using an irrigation depth of 418.16 mm, a value that is very close to what was observed in this work.
Rev. Caatinga
Ŷ(50) = 819.98 - 11.787**x + 0.0912**x2 R² = 0.9969
Ŷ(75) = 497.75 + 12.519**x - 0.1059*x2 R² = 0.8565
Ŷ(100) = 542.52 + 18.335**x - 0.1533*x2 R² = 0.8965
Ŷ(125) = 983.12 + 12.214*x - 0.1002*x2 R² = 0.7893
200 400 600 800 1000 1200 1400 1600
0 33 66 99
Y ie ld ed o f co w p ea (k g h a -1)
NPK levels (%)
50% ETc
75% ETc
100% ETc
125% ETc (A)
Ŷ(50) = 1142.2 - 6.9363*x R² = 0.8759
Ŷ(75)= 1114.2 - 6.7409**x R² = 0.9814
Ŷ(100) = 1342.4 - 8.0072**x R² = 0.8289
200 400 600 800 1000 1200 1400 1600
0 33 66 99
Y ie ld ed o f co w p ea (k g h a -1)
NPK levels (%)
50% ETc
75% ETc
100% ETc
125% ETc (B)
Ŷ(0) = 2431.5 - 45.751**x + 0.2713**x2 R² = 0.9998
Ŷ(33) = 703.24 - 9.0141**x + 0.1138*x2 R² = 0.9847
Ŷ(66) = - 1100.1 + 39.273**x - 0.1636**x2 R² = 0.999
Ŷ(99) = 824.09 - 11.102**x + 0.1148**x2 R² = 0.989
200 400 600 800 1000 1200 1400 1600
50 75 100 125
Y ie ld ed o f co w p ea (k g h a -1)
Irrigation levels (% ETc)
0%
33% NPK
66% NPK
99% NPK (C)
Ŷ(0) = 1389.5 - 11.44**x + 0.1066*x2 R² = 0.9998
Ŷ(66) = 1959.5 - 41.58**x + 0.2931*x2 R² = 0.9267
Ŷ (99) = 1004.9 - 17.192**x + 0.1356**x2 R² = 0.9997
200 400 600 800 1000 1200 1400 1600
50 75 100 125
Y ie ld ed o f co w p ea (k g h a -1)
Irrigation levels (% ETc)
0%
33% NPK
66% NPK
99% NPK (D)
Figure 2. Yielded of cowpea irrigated with (A and C) well water and (B and D) treated domestic sewage as a function of
NPK levels (A and B) and irrigation depth levels (C and D).
CONCLUSION
An increase in water availability promoted improved productivity. A reference depth of 125% of evapotranspiration (ETc) gave the best bean productivity, regardless of the water source.
For beans irrigated with well water, there was an improvement in productivity with increasing fertilizer up to the recommended NPK limit of 66%. Plants irrigated at a depth of 50% of ETc gave reduced yields with increasing levels of NPK fertilizer, which was a response to water stress.
For plants irrigated with treated domestic sewage, an increase in fertilizer levels resulted in a decrease in yielded due to the excess of nutrients, because these were already present in the sewage.
The treated domestic sewage made nutrients available in part for every irrigation treatment; this resulted in an efficient distribution of nutrients, which was reflected in the increased BP.
Treated domestic sewage can be used as a source of both water and nutrients for common bean cultivation, allowing for substitution of up to 100% of NPK fertilizer.
ACKNOWLEDGEMENTS
CAGECE–Companhia de Água e Esgoto do Ceará for making the area available and for partially supporting this research.
IFCE–Instituto de Educação Ciência e Tecnologia do Ceará for providing research funds.
REFERENCES
AMARO, G. B. et al. Recomendações técnicas para o cultivo de hortaliças em agricultura familiar. 1. ed. Brasília, DF: EMBRAPA, 2007. 15 p.
ANDRADE JÚNIOR, A. S.; RODRIGUES, B. H. N.; FRIZZONE, J. A. Níveis de irrigação na cultura do feijão caupi. Revista Brasileira de Engenharia Agrícola e Ambiental, Campina Grande, v. 6, n. 1, p. 17-20, 2002.
ASSIS JÚNIOR, J. O. et al. Produtividade do feijão-de-corda e acúmulo de sais no solo em função da fração de lixiviação e da salinidade da água de irrigação. Engenharia Agrícola, Jaboticabal, v. 27, n. 3, p. 702-713, 2007.
BEZERRA, F. M. L. et al. Irrigação com esgoto doméstico tratado e doses de nitrogênio na produção do girassol. Engenharia Agrícola, Jaboticabal, v. 34, n. 6, p. 1186-1200, 2014.
BRASIL. Ministério da Agricultura, Pecuária e Abastecimento. EMBRAPA — Cultivo do Feijoeiro Comum: Calagem e Adubação. Disponível em: <http:// www.agencia.cnptia.embrapa.br> Acesso em: 12 mai. 2013.
2005.
FREITAS, C. A. S. et al. Crescimento da cultura do girassol irrigado com diferentes tipos de água e adubação nitrogenada. Revista Brasileira de Engenharia Agrícola e Ambiental, Campina Grande, v. 16, n. 10, p. 1031-1039, 2012.
HUSSAR, G. J. et al. Efeito do uso do efluente de reator anaeróbio compartimentado na fertirrigação da beterraba. Engenharia Ambiental, Espírito Santo do Pinhal, v. 2, n. 1, p. 35-45, 2005.
LOCATELLI, V. E. R. et al. Componentes de produção, produtividade e eficiência da irrigação do feijão-caupi no cerrado de Roraima. Revista Brasileira de Engenharia Agrícola e Ambiental, Campina Grande, v. 18, n. 6, p. 574-580, 2014.
MANTOVANI, E. C. et al. Estimativa de produtividade da cultura do feijão irrigado em Cristalina-GO, para diferentes lâminas de irrigação como função da uniformidade de aplicação. Engenharia Agrícola, Jaboticabal, v. 32, n. 1, p. 110 -120, 2012.
OLIVEIRA, A. P. et al. Rendimento de feijão vagem em função de doses de K2O. Horticultura
Brasileira, Brasília, v. 25, n. 1, p. 29-33, 2007. PELEGRIN, R. et al. Resposta da cultura do feijoeiro à adubação nitrogenada e à inoculação com rizóbio. Revista Brasileira de Ciência do Solo, Viçosa, v. 33, n. 1, p. 219-226, 2009.
RAMOS JUNIOR, E. U.; LEMOS, L. B.; SILVA, T. R. B. Componentes da produção, produtividade de grãos e características tecnológicas de cultivares de feijão. Bragantia, Campinas, v. 64, n. 1, p. 75-82, 2005.
REBOUÇAS, L. et al. Crescimento do feijão-caupi irrigado com água residuária de esgoto doméstico tratado. Revista Caatinga, Mossoró, v. 23, n. 1, p. 97-102, 2010.
SANTANA, M. J. et al. Coeficiente de cultura e análise do rendimento do feijoeiro sob regime de irrigação. Irriga, Botucatu, v. 13, n. 1, p. 92-112, 2008.
SANTOS, K. D. et al. Utilização de esgoto tratado na fertirrigação agrícola. Revista de Biologia e Ciências da Terra, São Cristovão, v. 1, n. 1, p. 1-8, 2006.
SILVA, A. J. et al. Resposta do feijão-caupi à doses e formas de aplicação de fósforo em latossolo Amarelo do Estado de Roraima. Acta Amazônica, Manaus, v.
40, n. 1, p. 31-36, 2010.
SOUSA NETO, O. N. et al. Fertigação do algodoeiro utilizando efluente doméstico tratado. Revista Brasileira de Engenharia Agrícola e Ambiental, Campina Grande, v. 16 n. 2, p. 200-208, 2012.
TEIXEIRA, I. R. et al. Desempenho agronômico e qualidade de sementes de cultivares de feijão-caupi na região do cerrado. Revista Ciência Agronômica, Fortaleza, v. 41, n. 2, p. 300-307, 2010.