Original Article
SILVICULTURE
Creative Commons License. All the contents of this journal, except where otherwise noted, is licensed under a Creative Commons Attribution License.
Elastic and Osmotic Adjustment of Talipariti elatum (Sw) Frixell
Grown in Organic Substrates
Yasiel Arteaga-Crespo
1, Gretel Geada-López
2, Yudel García-Quintana
1,
Jessy Guerrero-Rubio
1, Julio Vargas-Burgos
11Universidad Estatal Amazónica – UEA, Puyo/Pastaza, Ecuador 2Universidad de Pinar del Río – UPR, Pinar del Río, Cuba
ABSTRACT
The aim of the present study was to evaluate the water response of Talipariti elatum cultivated
in different substrates. Sugarcane straw, peat, biochar and mixtures of sugarcane straw and biochar, and peat and biochar were used. The physical properties of each substrate and the water parameters of the species were determined based on the pressure-volume curve. The osmotic potential at maximum saturation and the turgor loss point presented a similar behaviour with a decreasing tendency. We found significant differences between the beginning and end of the period. The values ranged from -1.17MPa to -1.36MPa and -1.49MPa to -1.74MPa, which indicated the development of osmotic adjustment mechanisms. The modulus of elasticity values ranged between 8.10MPa and 11.20MPa at the start and between 6.65MPa and 9.39MPa at the end, indicating elastic adjustment. The plants in the substrates with lower moisture retention showed lower values of solute potentials and cell wall elasticity modulus.
1. INTRODUCTION
The study of the water status of plants is important to understand their adaptation to stressful environments (Kramer, 1974; Azcón & Talón, 2008), as well as to evaluate plant-soil relationships. Water parameters are closely related to specific responses to the environmental stresses under which they develop (Taiz & Zeiger, 2006). Plants that tolerate water deficit conditions have morpho-physiological responses that allow them to survive in adverse conditions. For example, as water availability decreases, the ability of a plant to maintain its water status is reflected by the osmotic adjustment capacity determined by the osmotic potential of the tissues and/or the elastic adjustment through elasticity (Turner, 1986). Changes in cellular water balance are one of the main causes of alterations in photosynthesis and growth (Kozlowski et al., 1991; Kramer & Boyer, 1995; Lawlor & Cornic, 2002; Villaseñor et al., 2012).
One way to study the development capacity of acclimatization mechanisms is to study seedlings in the initial stages in forest nurseries where the different physical conditions of the substrate are those that induce the stages, since the remaining factors are controlled. This approach can also help to explain why some species present greater plasticity than others in the same restrictive environments (Azcón & Talón, 2008).
The technique of free transpiration developed by Tyree & Hammel (1972) for the construction of pressure-volume curves is a simple method to quantify water parameters. This tool is widely used for studies of plant water relations (Azcón & Talón, 2008). Interpretations of these curves could allow for the selection of forest species with greater expected survival and acclimatization for the promotion of forest plantations, which is relatively empirical knowledge in tropical native species.
Cuba’s forestry policy presents guidelines up to 2020 for the use of native species of economic interest and ecological plasticity in its economic development programme.
T. elatum, locally known as ‘majagua’ belongs to the family Malvaceae. It is one of the most attractive options due to its rapid growth and the great commercial value of its wood (Herrero et al., 2004). Studies analyzing the morpho-physiological plasticity of this species are limited. Therefore, the study of changes in water relations in leaves in response to cultivation in substrates with
different physical characteristics in nurseries could offer information about the necessary elements for management of the species in the nursery. This analysis could also help to predict subsequent performance in forest sites, which are generally heterogeneous and subject to water restrictions, limiting the productivity of the species. That is, the study of plant water parameters in nurseries is an instrument for the management and evaluation of the species’ behaviour. The present study is based on the hypothesis that the osmotic potential and the cell wall elasticity modulus of the species studied vary according to the substrate used for cultivation. Thus, the objective was to evaluate the water response of the species T. elatum grown in nurseries in different organic substrates.
2. METHODS
The trial was carried out in an experimental nursery located in Pinar del Río, north latitude 22° 24`00``, west longitude 83° 41`00`` and an altitude of 196 m asl, with average monthly temperature of 26.8°C, 25% relative humidity, and 26.7mm rainfall. We used T. elatum seedlings grown in 90 cm3 capacity plastic tubes with
a completely randomized design with seeds collected from 10 trees in the Viñales Agroforestry Experimental Station. The treatments consisted of different substrates (sugarcane straw, peat, biochar, and the volumetric mixtures of sugarcane straw and biochar and of peat and biochar) in proportions of 4:1; 1:1; 1:4 (Table 1), maintaining the same environmental conditions and irrigation frequency throughout the evaluation period, which began 42 days after sowing and ended at 85 days. Physical analyses of the substrates were carried out in the local soil laboratory of the Ministry of Agriculture in Pinar del Río, based on the methodologies described by Ansorena (1994). Bulk density (g mL-1) and moisture
retention (% weight/weight) were determined, as well as the average diameter of the particles (mm), from the granulometric analysis, by means of the screening method, with the series of ASTM screens √2 (ASTM, 1972).
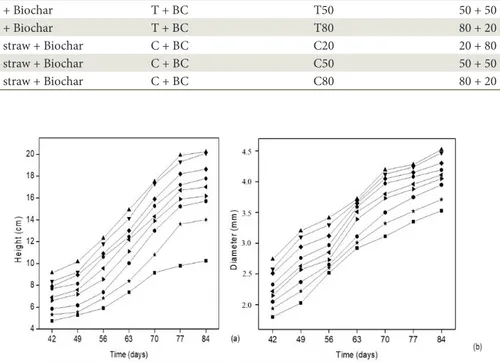
with similar morphometric characteristics (height and diameter of the root neck) (Figure 1 a and b).
Pressure-volume curves were developed following the technique developed by Tyree & Hammel (1972) and Turner (1986). Water potential components (Ψw) were
determined according to the methodology described by Azcón & Talón (2008): relative water content at the point of turgor loss (WRCo), osmotic potential at zero
turgor ( 0
s
Ψ), osmotic potential at full turgor ( 100
s
Ψ ) and cell wall elasticity modulus (ε).
For the construction of the curves, the upper two-thirds of the plant canopy were subjected to a rehydration period with distilled water and left in the dark for 24 hours after cutting. After weighing the samples, successive measurements of Ψw were realized with a pressure chamber (Model 1000, PMS Instruments, Corvallis, USA). Measurements of Ψw were performed until a sufficient number of points were obtained in the flat area of the curve. Finally, the dry weight was
determined in an oven at 80oC until constant weight
was achieved. A Sartorius AG GOTTINGEN SP61S analytical scale with 0.0001g precision was used for weighing.
The relative water content was calculated by Equation 1:
*100
f s
t s
P P
CHR
P P
− =
− (1)
where:
Pf: fresh weight, Ps: dry weight, Pt: turgid weight.
Turgid weight was estimated from the linearity between Ψw and fresh weight by taking the data corresponding to the first measurements that offered a greater degree of correlation, according to the criteria of Kubiske & Abrams (1991).
Table 1. Composition of the substrates used in the experiment.
Substrate Abbreviation Variant Composition
(volume/volume)
Biochar BC BC 100
Peat T T 100
Sugarcane straw C C 100
Peat + Biochar T + BC T20 20 + 80
Peat + Biochar T + BC T50 50 + 50
Peat + Biochar T + BC T80 80 + 20
Sugarcane straw + Biochar C + BC C20 20 + 80
Sugarcane straw + Biochar C + BC C50 50 + 50
Sugarcane straw + Biochar C + BC C80 80 + 20
The turgor loss point was determined graphically, for which Ψ = Ψw s
(
Ψ =p o)
. This corresponds to the point at which the curve becomes linear.The osmotic potential at full turgor ( 100
s
Ψ ) was
determined by extrapolating the linear zone of the pressure-volume curve from the turgor loss point to the value of 1
w
Ψ corresponding to 100% of the water content of the tissue (abscissa axis), and the value of the osmotic potential at zero turgor ( 0
s
Ψ) corresponds to the inverse value of the water potential at the point of initial plasmolysis.
In addition, the modulus of cell wall elasticity (ε) expressed in units of MPa was determined by the equation proposed by Robichaux (1984), applied to the first five or six points of the P-V curve until wilting was reached and determined using Equation 2:
( m a)
dP
CHR CHR
dCHR
ε = − (2)
where: dP
dCHR is the relationship between the variation of the pressure potential and the relative water content between the point of maximum turgor and zero turgor.
m
CHR : average water content,
a
CHR: apoplastic water content.
For data processing, a simple variance analysis was performed with a post hoc Tukey test at 95% probability, for determination of differences between substrates and water parameters. Analyses were performed using the SPSS version 15.0 for Windows. A Pearson correlation
matrix was used for variables related to the hydric parameters of the species and the physical properties of the substrates.
3. RESULTS
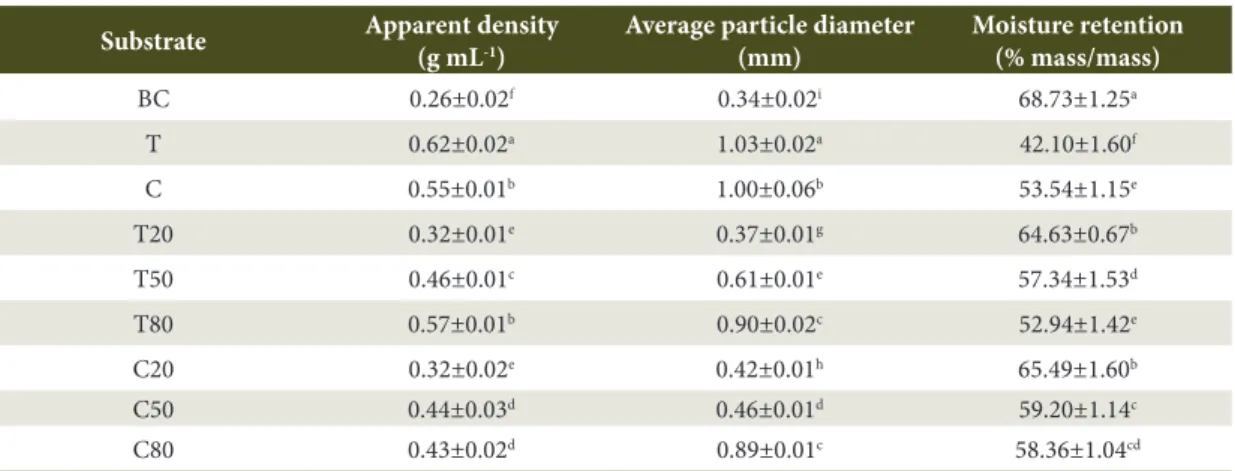
The lowest values of apparent density and average particle diameter corresponded to biochar, whilst the highest values were represented by sugarcane straw and peat (Table 2). The volumetric mixtures showed intermediate values in comparison with those of the individual constituents. This meant, for example, that an increase in biochar decreased density.
Moisture retention was higher in biochar, followed by mixtures where this component was predominantly present, giving evidence of its influence on greater moisture retention (Table 2).
Highly significant correlations (P ≤ 0.01) were observed between the physical properties of the substrates, especially bulk density and moisture retention. Bulk density could therefore serve as an indicator of water retention of a substrate in practice (Table 3).
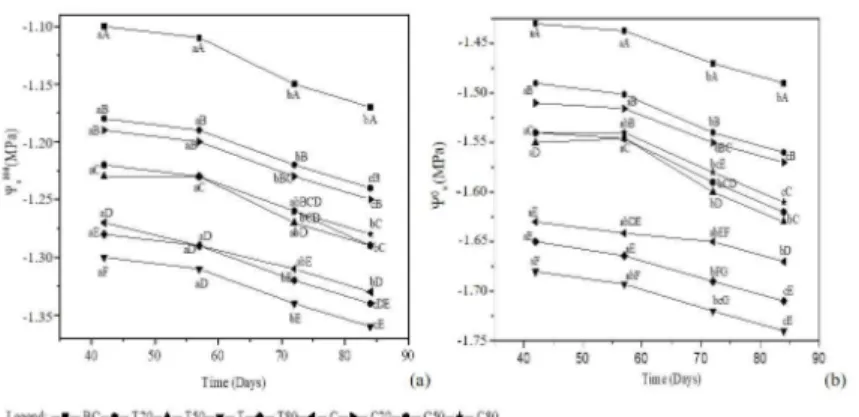
Both the osmotic potential at maximum saturation ( 100
s
Ψ ) and the turgor loss point ( 0
s
Ψ) estimated for each substrate decreased over time (Figure 2). Significant differences were observed between the water parameters at the beginning (42 days) and at the end (85 days) of the experiment, all of which indicates the development of osmotic adjustment mechanisms.
Different uppercase letters correspond to significant differences between substrates for the same measurement.
Table 2. Mean and standard deviation of the physical characteristics of the substrates.
Substrate Apparent density (g mL-1)
Average particle diameter (mm)
Moisture retention (% mass/mass)
BC 0.26±0.02f 0.34±0.02i 68.73±1.25a
T 0.62±0.02a 1.03±0.02a 42.10±1.60f
C 0.55±0.01b 1.00±0.06b 53.54±1.15e
T20 0.32±0.01e 0.37±0.01g 64.63±0.67b
T50 0.46±0.01c 0.61±0.01e 57.34±1.53d
T80 0.57±0.01b 0.90±0.02c 52.94±1.42e
C20 0.32±0.02e 0.42±0.01h 65.49±1.60b
C50 0.44±0.03d 0.46±0.01d 59.20±1.14c
C80 0.43±0.02d 0.89±0.01c 58.36±1.04cd
Lowercase letters correspond to significant differences within substrates (P ≤ 0.05).
The analysis of the different substrates showed significant differences between the groups C50, C80, T50 and the groups C20, T20; and between T80, C20 and the groups BC and T. In general, the C50, C80, T50 group showed intermediate potential values between BC (extreme high potential) and T (less extreme). The substrates with equal proportions of biochar (see C20, T20 and T50, C50) presented similar behaviour, without significant differences between them. Therefore, the differences between BC proportions determined the development of these mechanisms along the variation of physical properties of the substrates (See Figure 2). The values of cell wall elasticity modulus (Figure 3) were significantly different between most of the substrates, the highest being obtained in BC and the lowest in T. In the mixtures, variation was found in relation to the individual constituents, which proved the influence of substrates on cell wall elasticity.
Different uppercase letters correspond to significant differences between substrates for the same measurement. Lowercase letters correspond to significant differences within substrates (P ≤ 0.05).
Table 3. Correlation matrix between the physical variables.
Average particle diameter Moisture retention Apparent density
Average particle diameter 1.000 -0.884 (**) 0.931 (**)
Moisture retention 1.000 -0.943 (**)
Apparent density 1.000
** The correlation is significant for P ≤ 0.01.
Figure 2. Solute potential at full turgor (a) and solute potential at turgor loss point (b) in T. elatum over time for all
substrates.
Figure 3. Cell wall elasticity modulus in T. elatum over
time for all substrates. A tendency for RWCo to decrease
was observed throughout the study period (Figure 4) with statistically significant differences for most of the substrates, the highest being observed in BC and the lowest in T.
Different uppercase letters correspond to significant differences between substrates for the same measurement. Lowercase letters correspond to significant differences within substrates (P ≤ 0.05).
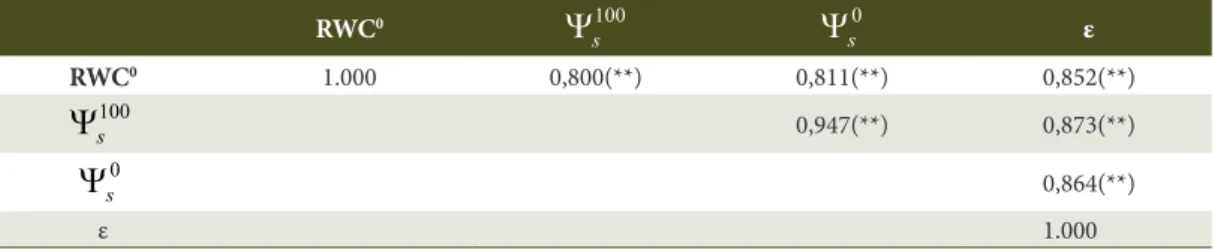
A positive correlation was observed between water parameters (Table 4), indicating that the species adapts to changes in water availability, which explains its high ecological plasticity.
A correlation was also observed between the water parameters of the species and the physical properties of the substrates (Table 5). Positive correlations were found between moisture retention and the water parameters evaluated, which indicated that in those substrates with higher moisture retention, the species developed cell walls with a greater modulus of elasticity and higher solute potentials as an adaptive outcome or tolerance mechanism.
4. DISCUSSION
Bulk density and average diameter values of the lowest particles corresponded to the biochar, which determined the highest values in moisture retention. This is due to the presence of small particles that decrease the total porosity and increase water retention capacity by decreasing the size of the interparticle pores (Ansorena, 1994). The mixtures, on the other hand, showed intermediate values in comparison to
those of the individual constituents, and showed that the combinations with biochar influenced all physical properties. Regarding bulk density, Guzmán (2003) and Ansorena (1994) argue that optimal values occur between 0.2 to 0.4g mL-1, respectively. In general, ideal
levels are achieved when the substrates have a biochar content above 50%.
With regards to moisture retention, Guzmán (2003), Castillo et al. (2006) and Zumkeller et al. (2009) stated that substrates that retain at least 50% moisture are suitable for the development of seedlings in tubes. In general, all substrates satisfied the stated conditions except for peat. Moreover, this property was positively modified in substrates composed of combinations with biochar.
Osmotic adjustment can be understood as the plant’s ability to maintain cellular turgor at low water potential (Azcón & Talón 2008), which is a measure of the possibility of development under conditions of low water content. However, in this case, since the substrates did not have the same physical and chemical characteristics, it is not possible to infer relationships between water and morphological parameters. Nonetheless, the analysis of whether or not the species developed such acclimatization mechanisms for survival in planting sites with low water content was crucial, as it has been possible to hardening irrigation studies
Table 4. Correlation matrix between water relations.
RWC0 100
s
Ψ
0s
Ψ
εRWC0 1.000 0,800(**) 0,811(**) 0,852(**)
100
s
Ψ
0,947(**) 0,873(**)0
s
Ψ
0,864(**)ε 1.000
** The correlation is significant for P ≤ 0.01; Legend: RWC0: relative water content at turgor loss point; 100 s
Ψ : osmotic potential at maximum saturation; 0
s
Ψ: osmotic potential at turgor loss point; ε: modulus of cell wall elasticity.
Table 5. Correlation matrix between physical variables of the substrate and water relations.
Relative water content at turgor
loss point
Osmotic potential at full turgor
Osmotic potential
at turgor loss point modulus of elasticity
Apparent density -0.771 (**) -0.865 (**) -0.887 (**) -0.935 (**)
Average particle
diameter -0.818 (**) -0.824 (**) -0.831 (**) -0.913 (**)
Moisture retention 0.703 (**) 0.874 (**) 0.876 (**) 0.917 (**)
and to gain understanding about the different habitats in which the species grow.
In general, in all substrates, individuals showed a change in osmotic potential with a decrease of both 100
s
Ψ and 0
s
Ψ during the evaluated period. Osmotic adjustment, as a tolerance mechanism, has been reported to relate to the active accumulation of solutes such as soluble sugars, organic acids and proline (Castellarin et al., 2007; Szabados & Savouré 2010). This allows cellular turgor to be maintained at low water potentials and at the same time favours physiological processes such as cell growth, stomatal opening and photosynthesis (Bavestrello-Riquelme et al., 2013).
Elastic adjustment is a property of plant cell walls described using the modulus of elasticity that manifests changes in turgor potential as a function of variations in cellular water content (Herralde, 2000). Therefore, low modulus of elasticity values indicate greater cell wall elasticity, which in turn allows for cell integrity (Ruiz, 1999; Lenz, et al. 2006). Despite this being an aspect little studied in forest species, Lenz et al. (2006) notes that Prosopis pallida Benth. has cell wall elasticity moduli of around 16-24 MPa, while Corcuera et al. (2002) reported moduli of 11-20 MPa for the Quercus genus and with these values both authors report elastic cell appearances. The variations in the modulus of elasticity can be explained by factors such as cell size, chemical composition of the walls (reflected in the proportion of the different components), and leaf age (Salleo & Lo Gullo, 1990; Herralde, 2000).
In all substrates, the species studied developed elastic walls, guaranteeing greater resistance to water stress, with a tendency toward elastic adjustment.
Relative water content at turgor loss point (point of initial plasmolysis) values indicate how much water the cell contains and can be interpreted as the water lost before plasmolysis. Low WRCo values imply greater water
loss without affecting cellular processes. WRCo values
can be attributed to the species’ own biology in terms of mechanisms that prevent water loss. The values found are similar to those reported by Donoso et al. (2011) of relative water content of 83 and 90% for Cryptocarya saponaria Mol. Looser and 81.8 and 88.6% for Quillaja saponaria Mol. On the other hand, the variations observed between the substrates are attributed to their physical characteristics, which can be verified using the correlation presented between the variables.
5. CONCLUSION
The species Talipariti elatum presented different hydric responses in the substrates used, depending on moisture retention with induction of development of osmotic and elastic adjustment mechanisms that enable the maintenance of cellular turgor at low water potentials. This demonstrated the capacity of populations of this species to survive varied water availability conditions. T. elatum showed the lowest water parameter values in the peat substrate, with lower moisture retention, demonstrating the development of acclimatization mechanisms for water deficiency in nursery conditions.
SUBMISSION STATUS
Received: 5 june., 2017 Accepted: 21 nov., 2017
CORRESPONDENCE TO
Yasiel Arteaga-Crespo
Universidad Estatal Amazónica – UEA, Km 2, 1/2 vía Puyo a Tena (Paso Lateral), 160150, Puyo, Pastaza, Ecuador
e-mail: yarteaga@uea.edu.ec
FINANCIAL SUPPORT
Universidad de Pinar del Río and Universidad Estatal Amazónica.
REFERENCES
American Society for Testing Materials – ASTM. ASTM E-29: guidelines for establishing sieve analysis procedures. West Conshohocken: ASTM; 1972. 50 p.
Ansorena MJ. Sustratos, propiedades y caracterización.
España: Ediciones Mundi-Prensa; 1994. 172 p.
Azcón B, Talón J. Fundamentos de fisiología vegetal.
Barcelona: Interamericana McGraw-Hill; 2008. Bavestrello-Riquelme C, Cavieres L, Gallardo J, Ibacache A, Franck N, Zurita-Silva A. Evaluación de la tolerancia a estrés por sequía en cuatro genotipos naturalizados de vid (Vitis vinifera) provenientes del norte de Chile. Idesia 2013; 30(3): 83-92. http://dx.doi.org/10.4067/
S0718-34292012000300011.
biosynthesis in ripening fruits of grapevine under seasonal water deficit. Plant, Cell & Environment 2007; 30(11):
1381-1399. http://dx.doi.org/10.1111/j.1365-3040.2007.01716.x. PMid:17897409.
Castillo MIC, Medina MR, González IE, Cobas López M, Bonilla VM. Evaluación de diferentes sustratos compuestos por cachaza como elemento principal en la producción de plantas de Eucaliptus grandis en contenedores. Revista Forestal Baracoa 2006; 25(2): 75-85.
Corcuera L, Camarero JJ, Gil-Pelegrín E. Functional groups in Quercus species derived from the analysis of pressure volume curves. Trees (Berlin) 2002; 16(7): 465-472. http://
dx.doi.org/10.1007/s00468-002-0187-1.
Donoso S, Peña K, Pacheco C, Luna G, Aguirre A. Respuesta fisiológica y de crecimiento en plantas de Quillaja saponaria
y Cryptocarya alba sometidas a restricción hídrica. Bosque (Valdivia) 2011; 32(2): 187-195. http://dx.doi.org/10.4067/
S0717-92002011000200009.
Guzmán JM. Sustratos y tecnología de almácigo. In: UCR-CYTED. Memoria de cursos de producción en ambientes protegidos. San José, Costa Rica: UCR-CYTED; 2003. p. 25.
Herralde F. Estudio integral de las respuestas ecofisiológicas al estrés hídrico: caracterización de variedades de almendro
[tesis]. Barcelona: Facultad de Biología, Universidad de Barcelona; 2000.
Herrero JA, Linares E, Palenzuela L, Diago I. Tendencias y perspectivas del sector forestal hasta el año 2020. Revista Forestal Baracoa. 2004. Número especial.
Kozlowski TT, Kramer PJ, Pallady SG. The physiological ecology of woody plants. San Diego: Academic Press;
1991. 345 p.
Kramer PJ, Boyer JS. Water relations of plants and soils.
San Diego: Academic Press; 1995. 495 p.
Kramer PJ. Relaciones hídricas de Suelos y Plantas. México: Edutex, S. A.; 1974. 376 p.
Kubiske ME, Abrams MD. Seasonal, diurnal and rehydration-induced variation of curves pressure-volume relation in
Pseudotsuga menziesii.Physiologia Plantarum 1991; 83(1): 107-116. http://dx.doi.org/10.1111/j.1399-3054.1991. tb01288.x.
Lawlor DW, Cornic G. Photosynthetic carbon assimilation and associated metabolism in relation to water deficits in higher plants. Plant, Cell & Environment 2002; 25(2):
275-294. http://dx.doi.org/10.1046/j.0016-8025.2001.00814.x. PMid:11841670.
Lenz T, Wright I, Westoby M. Interrelations among pressure– volume curve traits across species and water availability gradients. Physiologia Plantarum 2006; 127(3): 423-433.
http://dx.doi.org/10.1111/j.1399-3054.2006.00680.x. Robichaux RH. Variation in the tissue water relations of two sympatric Hawaiian Dubautia species and their natural hybrid. Oecologia 1984; 65(1): 75-81. http://dx.doi.
org/10.1007/BF00384465. PMid:28312112.
Ruiz J. Potencial hídrico y curva presión volumen en Chachafruto (Erythrina edulis). Palmira: Universidad
Nacional de Colombia; 1999. 60 p.
Salleo S, Lo Gullo M. Sclerophylly and plant water relations in three mediterranean Quercus species. Annals of Botany 1990; 65(3): 259-270. http://dx.doi.org/10.1093/
oxfordjournals.aob.a087932.
Szabados L, Savouré A. Proline: a multifunctional amino acid. Trends in Plant Science 2010; 15(2): 89-97. http://
dx.doi.org/10.1016/j.tplants.2009.11.009. PMid:20036181. Taiz L, Zeiger E. Fisiología vegetal. Vol. 2. Los Angeles:
Universidad de California; 2006. 1130 p.
Turner N. Measurement of plant water status by the pressure chamber technique. Irrigation Science 1986; 9: 289-308.
Tyree M, Hammel H. The measurement of the turgor pressure and the water relations of plants by the pressure bomb-technique. Journal of Experimental Botany 1972;
23(1): 267-282. http://dx.doi.org/10.1093/jxb/23.1.267. Villaseñor OA, García Y, Tamayo LM, Bonilla M, Fernández JA. Parámetros hídricos de Cedrela odorata L. cultivada en la zona semiárida del Valle del Yaqui, Sonora, México.
Revista Latinoamericana de Recursos Naturales 2012;
8(2): 56-62.