Yield components and reproductive, physiological, and root
traits used in early selection for nitrogen use efficiency in corn
Pedro Patric Pinho Morais(1), Massaine Bandeira e Sousa(2), Giovanni Galli(2), Luciano Rogério Braatz e Andrade(1), Roberto Fritsche-Neto(2) and Aluízio Borém de Oliveira(1)
(1)Universidade Federal de Viçosa, Departamento de Biologia Geral, Avenida P.H. Rolfs, s/no, Campus Universitário, CEP 36570-900 Viçosa, MG, Brazil. E-mail: [email protected], [email protected], [email protected] (2)Universidade de São Paulo, Escola Superior de Agricultura Luiz de Queiroz, Departamento de Genética, Avenida Pádua Dias, no 11, Caixa Postal 9, CEP 13418-900 Piracicaba, SP, Brazil. E-mail: [email protected], [email protected], [email protected]
Abstract – The objective of this work was to examine the possibility of using yield components and reproductive, physiological, and root traits in early selection for nitrogen use efficiency (NUE) in corn. Sixty-four inbred lines were evaluated under two nitrogen fertilization levels: ideal and low. The evaluations were performed at three phenological stages: eight fully-expanded leaves, tasseling stage, and physiological maturity. It is possible to select superior lines for NUE, but the yield components did not show differential behavior under the different nitrogen levels evaluated. Root, reproductive, and physiological traits are not promising for early selection of corn lines with high NUE. Likewise, the eight-leaves and tasseling stages were not promising for this purpose, since NUE should be estimated taking grain yield into account. However, indirect selection for NUE can be performed via number of ears or using the selection index considering number and weight of ears. Index terms: Zea mays, abiotic stress, GBlup, indirect selection, path analysis, selection index.
Componentes de produção e caracteres reprodutivos, fisiológicos e de raiz
usados na seleção precoce para eficiência do uso de nitrogênio em milho
Resumo–O objetivo deste trabalho foi examinar a possibilidade de usar componentes de produção e caracteres reprodutivos, fisiológicos e de raiz na seleção precoce para eficiência de uso de nitrogênio (EUN) em milho. Foram avaliadas 64 linhagens em dois regimes de adubação nitrogenada: ideal e baixo. As avaliações foram feitas em três estádios fenológicos: oito folhas completamente expandidas, florescimento masculino e maturação fisiológica. É possível selecionar linhagens superiores quanto à EUN, mas os componentes de produção não tiveram comportamento diferencial sob os diferentes níveis de nitrogênio avaliados. Os caracteres radiculares, reprodutivos e fisiológicos não se mostraram confiáveis para seleção precoce de linhagens de milho com elevada EUN. De forma semelhante, os estádios de oito folhas e de florescimento masculino não se mostraram promissores para esse propósito, uma vez que, para a estimação da EUN, deve-se levar em consideração a produção de grãos. Entretanto, a deve-seleção indireta para EUN pode deve-ser feita via número de espigas ou com o uso de índice de seleção que considere número e peso de espigas.
Termos para indexação:Zea mays, estresse abiótico, GBlup, seleção indireta, análise de trilha, índice de
seleção.
Introduction
Plant breeding enabled the development of corn (Zea mays L.) cultivars more efficient in nitrogen use, i.e., of
genotypes with greater or at least similar grain yield,
but with lower nitrogen demand (Caixeta et al., 2015). Moll et al. (1982) defined nitrogen use efficiency (NUE) as the relationship between yield and the amount of available N to the plants (N in the soil + N provided by fertilizers). However, when new leaves
are put forth, part of the photoassimilates is directed
to the development of the new tissue (Vessey et al., 1990), and there is a decrease in the translocation rate
of these compounds toward the root system, reducing energy availability, which, consequently, reduces the
N uptake rate. This certainly increases the relevance of identifying the ideal stage for NUE inferences,
preferably with the possibility of estimating this trait in the early stages of the corn crop.
conditions (DoVale et al., 2012). In this context, Melo et al. (2010) found that it is possible to estimate the photosynthetic efficiency of photosystem II through
carbon assimilation by plants, which can aid in the further development of the root system. This might have potential implications for indirect selection aiming at
NUE. Reproductive traits, such as the anthesis-silking interval (ASI), have shown negative correlation with yield under water scarcity conditions (Teixeira et al., 2010). However, the combination of these traits with the possible increase of the ASI in low N environments (Jacobs & Pearson, 1991) has a negative impact on
yield components.
In a general sense, these traits may be relevant for examining the feasibility of early selection methods or
indirect selection for increasing NUE, in order to speed
up the selection process by immediately discarding
inferior genotypes (DoVale & Fritsche-Neto, 2013).
The objective of this work was to examine the possibility of using yield components and reproductive,
physiological, and root traits in early selection for NUE
in corn.
Materials and Methods
Six trials were carried out with 64 tropical corn inbred lines in a simple lattice experimental design
(8x8), with two replicates, during the second crop (off-season) of 2014 and 2015. A triple factorial design
was used, which considered the following factors of
variation: genotypes (64 lines) x N levels (ideal and low N availability) x environments (three). A total of
100 kg ha-1 N were applied for ideal N (IN), 12 kg ha-1
during sowing and the remainder in the V4 and V6 growing stages. For low N (LN), 30 kg ha-1 N were
applied, with the same management as in IN.
The three environments consisted of different sites and planting seasons. The sites were experimental
areas belonging to Escola Superior de Agricultura Luiz de Queiroz of Universidade de São Paulo, in the
municipalities of Anhembi and Piracicaba, in the state
of São Paulo, Brazil. The first was located at 22°42'23"S, 47°38'14"W, at 546 m altitude, with a clayey soil, and
was used only in the 2014/2015 off-season; the second
was located at 22°50'54"S, 48°01'07"W, at 450 m
altitude, with a sandy soil, and was used in both the 2013/2014 and 2014/2015 off-seasons. Plots consisted of a single 4 m-length row in 2014 or a 5-m one in
2015. The difference in the length of the rows was due to the need for more plants for the assessment of root traits. In both cases, a spacing of 0.85 m between rows and 0.20 m between plants was used, with a total of 20 and 25 plants in each row, respectively.
NUE inferences were made at different stages
throughout the crop cycle, with plants sampled in
the eight fully-expanded leaf stage (V8) and in the tasseling stage (VT). The samples consisted of shoots
of two plants in each plot. The shoots were dried in a kiln, at 60oC, for 120 hours, until constant weight
was reached. Shoot dry weight (SDW, g) was then measured. The last estimation of NUE was carried out after physiological maturity (PM), when the yield
for each inbred line was calculated. To determine
NUE at these three stages, the methodology proposed by Moll et al. (1982) was used: NUE in V8 and in VT = SDW (gram per plot)/applied N (kilogram per plot); and NUE in PM = yield (gram per plot)/applied N (kilogram per plot).
Root traits were assessed at the V8 stage by sampling two plants per plot. Lateral root length (LatRL) and axial root length (AxiRL), in centimeters, and lateral root volume (LatRV) and axial root volume (AxiRV), in cubic centimeters, were evaluated with the WinRhizo Arabidopsis software coupled to a LA2400 scanner with 2,400 dpi (Regent Instruments Inc., Quebec, Canada). The ten classes of root diameter provided by the software were simplified to only two, according to Trachsel et al. (2009): for LatRL and LatRV, only
fragments with a diameter less than or equal to 0.5
mm were considered; and for AxiRL and AxiRV, only
those with a diameter greater than 0.5 mm.
The photosynthetic efficiency of photosystem II (PEPSII) and ASI were the physiological traits evaluated. The PEPSII was estimated by using a Junior-Pan compact portable fluorometer (Heinz Walz GmbH, Effeltrich, Germany). To evaluate this trait, the equation described by Matta et al. (1997) was used: PEPSIIf = Fv/Fm, where Fv is the variable fluorescence,
Fv = Fm - F0, with F0 being the initial fluorescence and Fm, the maximum fluorescence.
The ASI was estimated in days, according to the dates on which 50% of the plants in the plots were in
the anthesis stage (AS) or later on in the silking stage (SS), as: ASI = AS50% - SS50%.
ear diameter, in cubic centimeters; EW, ear weight, in grams; NRE, number of rows per ear; and NKR,
number of kernels per row. Five plants per plot were
analyzed. Total yield (TY), in kg ha-1, was estimated
by extrapolating the yield per plot to hectare, at 13% moisture.
The data were analyzed by restricted maximum
likelihood (REML) and best linear unbiased prediction (Blup) to obtain the variance components and the
genetic values, considering the genomic relationship
matrix (GBlup). In the joint and individual analyses, depending on the N levels, the following model was
considered: y=Xβ+Zu+ε. In this model, X is the
matrix of fixed effects of block within replicates (Bl/ Rep), N levels (N), environments (Env), and N x Env interaction; β is the vector of fixed effects;
Z is the matrix of random effects, i.e., genotypes
(Gen) and Gen x N, Gen x Env, and Gen x N x Env
interactions; u are the genetic additive effects of genotypes, with u∼N0G a
2
, σ , and ε is the residual
vector, with ε∼N0Iσ2
, . In these last descriptions, G is the genomic relationship matrix; I is the identity
matrix; αa2 is the additive genetic variance; and α2 is
the residual variance. The Wald and likelihood ratio (LRT) tests were used for testing fixed and random
effects, respectively.
Genomic estimated breeding values (GEBVs)
were obtained according to the following expression:
µ=
(
Z R Z G' −1 + −1)
−1Z R' −1(
y−Xβ)
, wherey−X
(
β)
arethe individual observations corrected for fixed effects.
This same model was considered for the individual
models within each N level. However, sources of variation were discarded, such as N levels and their
simple and triple interactions with genotype and environment.
In order to determine the relationship between
performance of inbred lines under LN and IN, the
Spearman correlation index was applied:
ρ = − −
(
∑
)
1 6 1 2 2 d n n iwhere d
i 2
is the difference between the ranks of each
inbred line in the two N levels and n is the number of
pairs considered.
The broad-sense heritability was estimated for each
trait inside of each N level by
h g
f
2 2 2
=
σ σ
where σg 2
is the genetic variance and σf2 is the phenotypic variance.
The linear correlation matrix was also estimated
based on Pearson coefficients (r) between traits and on NUE estimates both in the V8 and VT corn growing stages and based on yield (NUEV8, NUEVT, and NUEY, respectively), taking N levels into account.
Subsequently, the phenotypic correlation matrix
was divided into two groups: the first was based on
yield components; and the second considered root, reproductive, and physiological traits. For each group, the multicollinearity diagnosis described by
Montgomery & Peck (1992) was carried out.
The correlations between the groups (explanatory variables) and NUEV8, NUEVT, and NUEY (dependent variables) were split into direct and indirect effects through the path analysis (Wright, 1921),
establishing cause and effect relationships between
traits (Cruz et al., 2012).
Joint and individual analyses were performed
through the ASReml package in the R software
(Gilmour et al., 2009), and the Genes software was used for obtaining path coefficients (Cruz, 2013).
Graphical analyses for interactions among the factors
genotype, environment, and N level were performed via the GGE biplot software (Yan & Tinker, 2005).
Results and Discussion
The coefficients of variation (CVs, %) differed between LN and IN conditions only for NUEVT (Tables 1 and 2). Studies have shown that higher CVs are normal in nutrient-deficient conditions, because the
trait means are generally lower under stress, and square
means and standard deviations are higher (Soares et al., 2011). However, in general, the CV estimates were
high. One of the main reasons for this is the wide data variability observed due to the environment effect. This
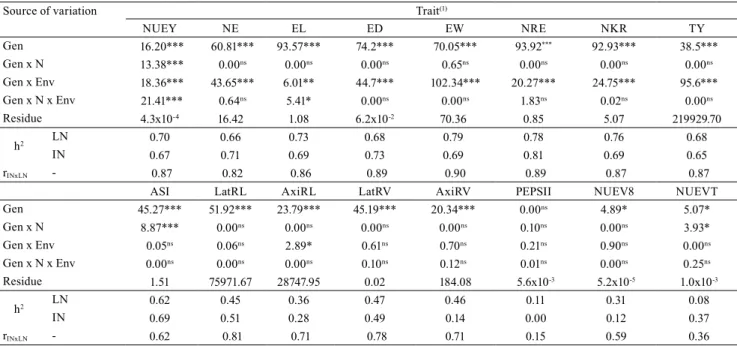
is endorsed by the significant effects of the environment (Env) factor and N x Env interaction. The highest means under LN and IN were obtained in the municipality of Anhembi in 2013/2014 (Figure 1).
LN. At this N level, variables were 4.8, 6.3, 6.8, 6.9, and 175% higher for LatRV, AxiRL, AxiRV, LatRL, and NUEY, respectively. Studies have indicated that
the extent and nature of the genetic variation of the root system have considerable implications for water and nutrient absorption by plants, as well as for plant
yield under water or nutrient stress, especially in the
case of N (Dawson et al., 2008). This is due to the
spatial growth of the root system, which determines the plant’s ability for exploiting resources, since there is a positive relation between root length, root area,
and exploited soil volume (Rich & Watt, 2013).
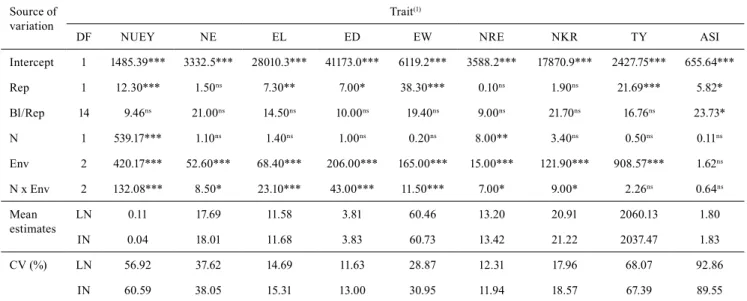
Table 1. Wald test, as well as mean estimates and coefficient of variation (CV), for fixed effects of intercept, replicates (Rep),
block within replicates (Bl/Rep), nitrogen levels (N), environments (Env), and nitrogen levels x environments (N x Env) on traits related to yield components in tropical corn (Zea mays) inbred lines under low (LN) and ideal (IN) nitrogen conditions.
Source of variation
Trait(1)
DF NUEY NE EL ED EW NRE NKR TY ASI
Intercept 1 1485.39*** 3332.5*** 28010.3*** 41173.0*** 6119.2*** 3588.2*** 17870.9*** 2427.75*** 655.64***
Rep 1 12.30*** 1.50ns 7.30** 7.00* 38.30*** 0.10ns 1.90ns 21.69*** 5.82*
Bl/Rep 14 9.46ns 21.00ns 14.50ns 10.00ns 19.40ns 9.00ns 21.70ns 16.76ns 23.73*
N 1 539.17*** 1.10ns 1.40ns 1.00ns 0.20ns 8.00** 3.40ns 0.50ns 0.11ns
Env 2 420.17*** 52.60*** 68.40*** 206.00*** 165.00*** 15.00*** 121.90*** 908.57*** 1.62ns
N x Env 2 132.08*** 8.50* 23.10*** 43.00*** 11.50*** 7.00* 9.00* 2.26ns 0.64ns
Mean estimates
LN 0.11 17.69 11.58 3.81 60.46 13.20 20.91 2060.13 1.80
IN 0.04 18.01 11.68 3.83 60.73 13.42 21.22 2037.47 1.83
CV (%) LN 56.92 37.62 14.69 11.63 28.87 12.31 17.96 68.07 92.86
IN 60.59 38.05 15.31 13.00 30.95 11.94 18.57 67.39 89.55
(1)NUEY, nitrogen use efficiency based on yield; NE, number of ears; EL, ear length; ED, ear diameter; EW, ear weight; NRE, number of rows per ear;
NKR, number of kernels per row; TY, total yield; and ASI, anthesis-silking interval. DF, degrees of freedom. ***, **, and *Significant at 0.1, 1.0, and
5.0% probability, respectively. nsNonsignificant.
Table 2. Wald test, as well as mean estimates and coefficient of variation (CV), for fixed effects of intercept, replicates
(Rep), block within replicates (Bl/Rep), nitrogen levels (N), environments (Env), and nitrogen levels x environments (N x Env) on root traits of tropical corn (Zea mays) inbred lines under low (LN) and ideal (IN) nitrogen conditions.
Source of variation
Trait(1)
DF LatRL AxiRL LatRV AxiRV PEPSII NUEV8 NUEVT Intercept 1 3501.30*** 4240.40*** 2859.04*** 3165.60*** 37178.00*** 5077.90*** 5852.10***
Rep 1 4.50* 5.20* 4.24* 0.20ns 7.00** 7.80** 1.50ns
Bl/Rep 14 17.20ns 12.40ns 10.65ns 12.70ns 26.00* 14.00ns 23.30ns
N 1 5.00* 6.10* 2.83ns 4.80* 129.00*** 1282.10*** 1678.50***
Env 1 63.10*** 37.80*** 61.41*** 77.40*** 5.00* 305.20*** 26.30***
N x Env 1 1.10ns 3.80* 1.19ns 2.00ns 1.00ns 126.10*** 18.00***
Mean estimates LN 878.28 645.08 0.43 42.43 0.66 0.01 0.07
IN 821.15 606.69 0.41 39.70 0.74 0.03 0.22
Coefficient of
variation (%) LNIN 43.2841.37 32.5534.36 43.4642.21 40.3341.91 12.509.81 37.4135.06 22.5930.74
(1)LatRL, lateral root length; AxiRL, axial root length; LatRV, lateral root volume; AxiRV, axial root volume; PEPSII, photosynthetic efficiency of
In contrast, PEPSII, NUEV8, and NUEVT had higher estimates under IN, which achieved increases
of 12.2, 300, and 314.3%, respectively, compared
with LN conditions. For the other traits, there was no significant difference among inbred lines between the two N levels. Presterl et al. (2003) and Soares et al. (2011) found that NE, EW, and TY have their expression reduced when assessed under low N conditions. However, some studies showed that the application of
contrasting N levels - even when the amounts differed greatly - had no effect on corn yield (Cruz et al., 2015). The inbred lines showed no significant differences for the ASI, under the different N availabilities evaluated. Therefore, the LN condition had no negative effects (delay, malformation, or asynchronism) on
the development and growth of male and female
inflorescences. This provides the conditions necessary for the grain to develop under both N levels.
Figure 1. Estimated means for corn (Zea mays) traits under low (LN) and ideal (IN) nitrogen conditions in the environments
PEPSII had higher mean estimates when evaluated in IN. However, the greater efficiency of the photosystem did not cause higher yield or increased SDW. The higher estimates for SDW observed under IN were due
to the amount of nutrient applied, which promoted high
vegetative growth. This can be verified by the high values obtained for NUEV8 and NUEVT under IN, which are dependent on SDW. Therefore, the increased vegetative volume under IN may have allowed greater
nutrient translocation from stem and leaves to ears,
which typically occurs in the R2 (blister) stage, and
does not necessarily result in an increased capacity for
EW or, for that matter, for TY. Previous studies have shown that nutrient translocation, mainly for N, has either the same patterns under LN and IN, or a higher translocation rate under LN (Gallais & Coque, 2005).
The joint analysis of random effects indicates
significant differences among the inbred lines (Gen) for all evaluated traits, except for PEPSII (Table 3).
This result is an evidence of the presence of genetic variability in this population, which indicates the
Table 3. Maximum likelihood ratio test (LRT) for random effects of genotypes (Gen), genotypes x nitrogen levels (Gen x N),
genotypes x environments (Gen x Env), and genotypes x nitrogen levels x environments (Gen x N x Env) on tropical corn (Zea mays) inbred lines under low (LN) and ideal (IN) nitrogen conditions, as well as residue estimates, heritabilities (h2),
and Spearman correlation (rINxLN) between genotypes.
Source of variation Trait(1)
NUEY NE EL ED EW NRE NKR TY
Gen 16.20*** 60.81*** 93.57*** 74.2*** 70.05*** 93.92*** 92.93*** 38.5***
Gen x N 13.38*** 0.00ns 0.00ns 0.00ns 0.65ns 0.00ns 0.00ns 0.00ns
Gen x Env 18.36*** 43.65*** 6.01** 44.7*** 102.34*** 20.27*** 24.75*** 95.6***
Gen x N x Env 21.41*** 0.64ns 5.41* 0.00ns 0.00ns 1.83ns 0.02ns 0.00ns
Residue 4.3x10⁻⁴ 16.42 1.08 6.2x10⁻² 70.36 0.85 5.07 219929.70
h2 LN 0.70 0.66 0.73 0.68 0.79 0.78 0.76 0.68
IN 0.67 0.71 0.69 0.73 0.69 0.81 0.69 0.65
rINxLN - 0.87 0.82 0.86 0.89 0.90 0.89 0.87 0.87
ASI LatRL AxiRL LatRV AxiRV PEPSII NUEV8 NUEVT
Gen 45.27*** 51.92*** 23.79*** 45.19*** 20.34*** 0.00ns 4.89* 5.07*
Gen x N 8.87*** 0.00ns 0.00ns 0.00ns 0.00ns 0.10ns 0.00ns 3.93*
Gen x Env 0.05ns 0.06ns 2.89* 0.61ns 0.70ns 0.21ns 0.90ns 0.00ns
Gen x N x Env 0.00ns 0.00ns 0.00ns 0.10ns 0.12ns 0.01ns 0.00ns 0.25ns
Residue 1.51 75971.67 28747.95 0.02 184.08 5.6x10⁻³ 5.2x10⁻⁵ 1.0x10⁻³
h2 LN 0.62 0.45 0.36 0.47 0.46 0.11 0.31 0.08
IN 0.69 0.51 0.28 0.49 0.14 0.00 0.12 0.37
rINxLN - 0.62 0.81 0.71 0.78 0.71 0.15 0.59 0.36
(1)NUEY, nitrogen use efficiency based on yield; NE, number of ears; EL, ear length; ED, ear diameter; EW, ear weight; NRE, number of rows per ear;
NKR, number of kernels per row; TY, total yield; ASI, anthesis-silking interval; LatRL, lateral root length; AxiRL, axial root length; LatRV, lateral root volume; AxiRV, axial root volume; PEPSII, photosynthetic efficiency of photosystem II; NUEV8, nitrogen use efficiency in the V8 stage; and NUEVT, nitrogen use efficiency in the VT stage. ***, **, and *Significant at 0.1, 1.0, and 5.0% probability, respectively. nsNonsignificant.
possibility of genetic gains from selection. Significant effects were also observed for Gen x N for NUEY, ASI, and NUEVT, indicating that some inbred lines respond differently when subjected to LN and IN
conditions. Since there was no interaction for the other traits, they can be tested in a single environment with this set of inbred lines. This way, the inferences made for one environment will hold true for a second one
(DoVale & Fritsche-Neto, 2013).
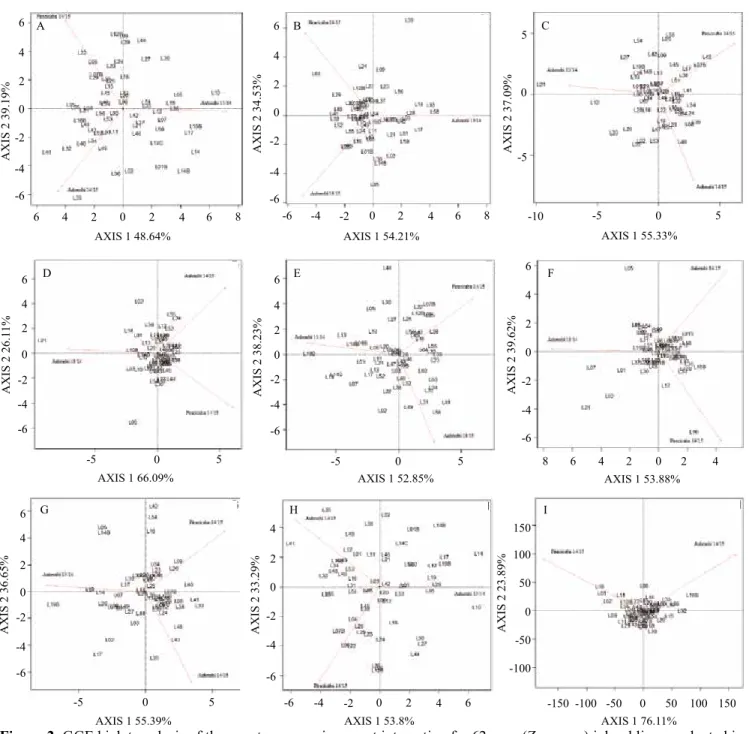
The environments had a considerable effect on the performances of the inbred lines, presenting a
significant Gen x Env interaction. The GGE biplot graphical representations (Figure 2) showed a large dispersion among the inbred lines for NUEY, EW, NKR, and TY, in the three environments, with intermediate dispersions for NE and EL. For ED, NKR, and AxiRL, the inbred lines tend to exhibit
fewer differences between the environments, i.e., they
were more stable. Larger distances from the center of
Figure 2. GGE biplot analysis of the genotype x environment interaction for 62 corn (Zea mays) inbred lines evaluated in
the municipalities of Anhembi in 2013/2014, of Anhembi in 2014/2015, and of Piracicaba in 2014/2015, in the state of São Paulo, Brazil, as to: nitrogen use efficiency based on yield (A); number of ears (B); ear length (C); ear diameter (D); ear weight (E); number of rows per ear (F); number of kernels per row (G); total yield (H); and axial root length, which was only evaluated in Anhembi in 2014/2015 and in Piracicaba in 2014/2015 (I). LN, low nitrogen; and IN, ideal nitrogen.
distance from the chart center and by the angle between the environment and genotype. Therefore, the further from the chart center and the more acute the angle, the more adapted the genotype is to the environment.
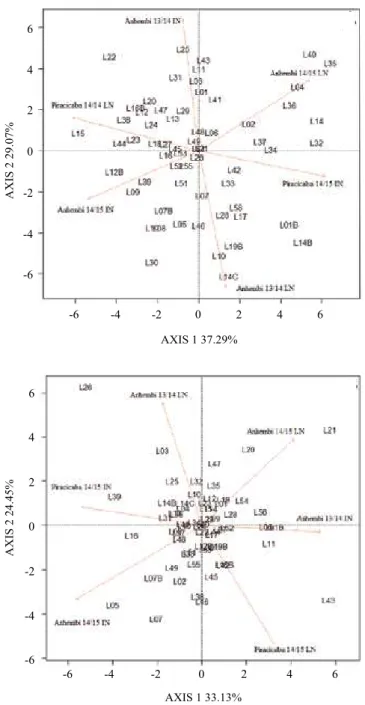
For Gen x N x Env, only NUEY and EL were significant (Table 3). When these two traits were
analyzed graphically, the genotypes revealed
considerable variability for NUEY and less dispersion for EL (Figure 3). Presterl et al. (2003) reported that
variances for genotypes x locations and years are generally greater than variances between genotypes
over crop seasons seem necessary for the assessment and the estimation of these factors of variation and of
their effects on traits. When the interaction between these factors is significant, it is possible to classify and
to indicate inbred lines according to their NUE under LN and IN environments.
The heritability estimates for most of the traits were intermediate to high, indicating a balance between
LN and IN conditions. However, Coque & Gallais (2006) explained that genetic variability is reduced under N stress condition, with a consequent reduction
in heritability; this way, the genotypes tend to show
similar performance. However, in the present study, LN did not restrict genetic variability, and the lower
heritability estimates were due to the similar inbred
line performance within the two N levels.
Most of the Spearman correlation estimates had
medium to high magnitude, under both N levels (Table 3), which is in alignment with Presterl et al. (2003). According to DoVale & Fritsche-Neto (2013), this condition reflects consistency for eventual genotype superiority, or a Gen x N simple type
interaction. For this reason, inbred lines with superior
performance in IN tend to respond in a similar way in LN. Furthermore, PEPSII and NUEVT, which had the lowest estimates of the Pearson correlation coefficient, cannot be predicted as a function of N availability for
the inbred lines.
Multicollinearity diagnosis was first carried out
before the implementation of the path analysis. The
number of conditions (NC) for yield component traits under LN and IN was between weak and moderate, respectively (Montgomery & Peck, 1992). Based on these results, TY was excluded from the analysis because the NUE index and TY have the same origin,
with an almost perfect correlation between them. For
reproductive, physiological, and roots traits, the NC was considered weak for both N levels. Therefore, in
general, yield components showed satisfactory path
coefficients for NUEY in LN, R2 = 0.93 and P
ɛ = 0.25,
and in IN, R2 = 0.87 and P
ɛ = 0.36 (Table 4). NUEV8
and NUEVT did not exhibit any direct or indirect effects on the remaining traits (explanatory variables)
that could overcome the residual estimates. This
indicates the inefficiency of these traits in determining variations in NUEV8 and NUEVT, impeding indirect and early selection for NUE in the V8 and VT growth stages. In addition, gains for TY via NUEV8 and NUEVT did not tend to show promising results, due
to the low heritability and intermediate or almost null
correlation of these traits with TY.
Figure 3. GGE biplot analysis of the genotype x environment
x nitrogen level interaction, under low (LN) and ideal (IN) nitrogen conditions, for 62 inbred corn (Zea mays) lines
Table 4. Direct and indirect effects of low and ideal nitrogen levels on yield components, according to nitrogen use efficiency
based on yield (NUEY), nitrogen use efficiency in the V8 stage (NUEV8), and nitrogen use efficiency in the VT stage (NUEVT), for tropical corn (Zea mays) inbred lines.
Effect(1) Low N Ideal N
NUEY NUEV8 NUEVT NUEY NUEV8 NUEVT
Number of ears (NE)
Direct 0.77 0.07 0.10 0.77 0.11 -0.34
Indirect
EL 0.01 0.01 0.03 0.00 0.00 -0.03
ED 0.00 -0.01 0.00 0.02 0.05 0.06
EW -0.08 0.02 0.02 -0.05 0.00 0.02
NRE 0.00 0.00 0.02 0.00 -0.01 0.01
NKR -0.02 0.02 -0.01 -0.02 -0.02 0.30
TY - 0.03 -0.06 - 0.04 0.16
Total 0.68 0.14 0.10 0.72 0.17 0.18
Ear length (EL)
Direct 0.07 0.05 0.21 -0.02 -0.03 -0.14
Indirect
NE 0.13 0.01 0.01 0.17 0.02 -0.07
ED 0.02 0.18 0.11 0.07 0.20 0.22
EW 0.33 -0.07 -0.06 0.24 0.01 -0.09
NRE 0.00 0.00 0.01 0.00 0.00 0.01
NKR -0.03 0.03 -0.01 -0.02 -0.02 0.31
TY - 0.02 -0.05 - 0.02 0.11
Total 0.52 0.22 0.22 0.44 0.20 0.35
Ear diameter (ED)
Direct 0.07 0.53 0.32 0.13 0.38 0.41
Indirect
NE -0.02 0.00 0.00 0.12 0.02 -0.05
EL 0.02 0.01 0.07 -0.01 -0.02 -0.07
EW 0.46 -0.10 -0.09 0.32 0.01 -0.11
NRE 0.00 -0.01 -0.07 0.01 0.05 -0.04
NKR -0.01 0.01 -0.01 -0.01 -0.01 0.20
TY - 0.02 -0.05 - 0.03 0.13
Total 0.52 0.46 0.17 0.56 0.46 0.47
Ear weight (EW)
Direct 0.62 -0.14 -0.13 0.54 0.02 -0.19
Indirect - - -
-NE -0.10 -0.01 -0.01 -0.08 -0.01 0.03
EL 0.03 0.02 0.11 -0.01 -0.01 -0.06
ED 0.05 0.39 0.24 0.08 0.23 0.25
NRE 0.00 0.00 -0.04 0.01 0.04 -0.03
NKR -0.02 0.02 -0.01 -0.02 -0.02 0.21
TY - 0.02 -0.05 - 0.03 0.12
Total 0.58 0.30 0.11 0.52 0.28 0.33
Number of rows per ear (NRE)
Direct 0.00 -0.03 -0.20 0.03 0.17 -0.14
Indirect
NE -0.08 0.00 -0.01 -0.06 -0.01 0.02
EL 0.00 0.00 -0.01 0.00 0.00 0.00
ED 0.03 0.20 0.12 0.04 0.11 0.12
EW 0.11 -0.03 -0.02 0.14 0.01 -0.05
NKR 0.00 0.00 0.00 -0.01 -0.01 0.09
TY - 0.00 0.00 - 0.01 0.03
Total 0.04 0.14 -0.12 0.14 0.28 0.07
For NUEY (Table 4), the explanatory variable estimates exceed the residual effect. The two N levels
assessed have similar patterns in the path analysis, so
that NE and EW are the traits that most affect NUEY, allowing indirect selection. NRE and NKR had low or
negative direct effects, besides demanding more time
and resources to be measured than NE, EW, and even than the main trait NUE. Another important issue is that indirect selection for NUEY, via NE, tends to be more advantageous than via EW, because it has greater direct and total effects on NUEY under LN and IN. In this regard, Moll et al. (1982) showed that NE is relevant for gains in NUE, with correlation above 70%. However, in the selection via NE, the prolificacy,
lodging index, and stem breakage of inbred lines must
also be taken into account, which can significantly
change the stand and the number of ears per plot
and, consequently, yield. However, it should be noted that NE and EW had opposite directions in the path coefficient; therefore, selecting for NE tends to decrease EW, and vice versa.
More precisely, the sharp contrast between these two traits may hinder the use of a selection index based
on them. However, according to Rangel et al. (2011),
selection indexes allow simultaneous gains even for traits with opposite effects. There are also other studies that show success in using selection indexes in
this scenario (Freitas et al., 2013).
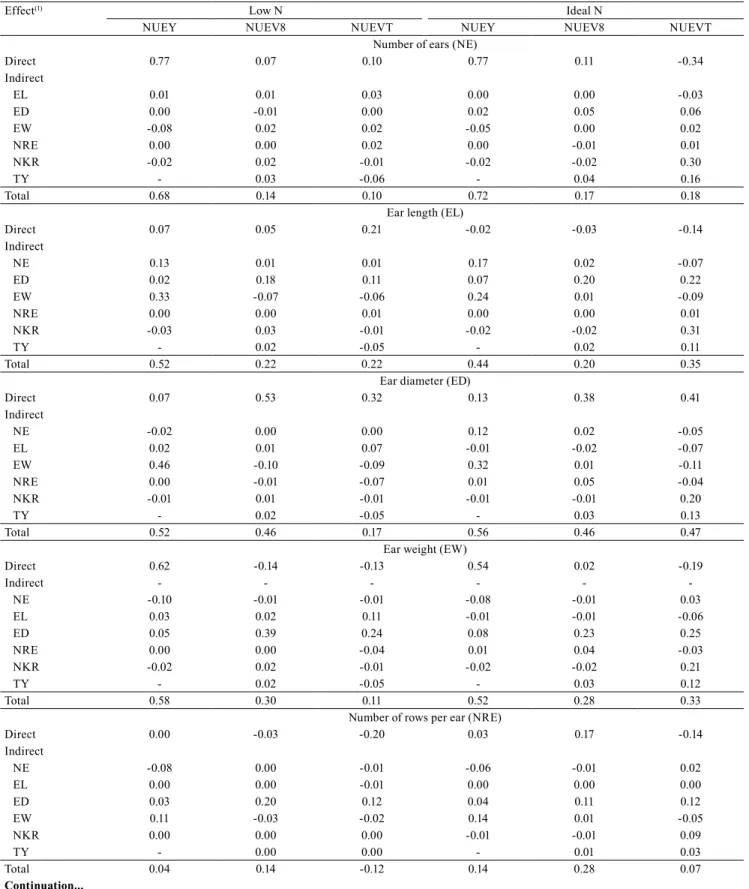
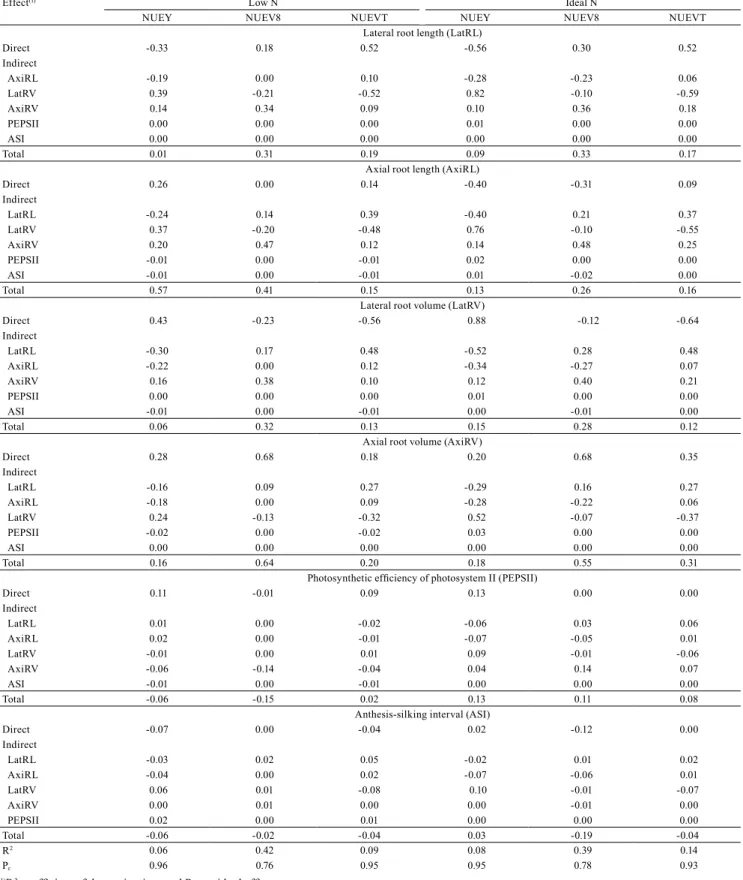
The analysis considering root, reproductive, and physiological traits did not explain the variations found
in NUEV8, NUEVT, and NUEY (Table 5). Another
interesting result is that root traits do not have a direct or total effect that could outperform the estimated residual
effect for N levels, although increases were observed under LN in some of these traits, which were presented as a viable option for NUE selection because of their
capability of increasing water and nutrient uptake
capacity (Lynch, 2013) and of allowing the exploitation of deeper and compacted soil layers (Peng et al., 2012). Similarly, Abdel-Ghani et al. (2013), researching
inbred lines under the same conditions evaluated here, concluded that root system traits are not correlated with yield. Other studies reported that this correlation even
tends to be negative (Garnett et al., 2009), due to the fact
that vigorous roots come at the cost of the carbon that could be allocated to the shoots.
Continuation...
Effect(1) Low N Ideal N
NUEY NUEV8 NUEVT NUEY NUEV8 NUEVT
Number of kernels per row (NKR)
Direct -0.04 0.05 -0.03 -0.04 -0.04 0.52
Indirect - - -
-NE 0.34 0.03 0.04 0.44 0.06 -0.19
EL 0.04 0.03 0.13 -0.01 -0.02 -0.08
ED 0.02 0.13 0.08 0.05 0.15 0.16
EW 0.25 -0.05 -0.05 0.21 0.01 -0.08
NRE 0.00 0.00 0.00 0.01 0.03 -0.02
TY - 0.02 -0.05 - 0.04 0.15
Total 0.61 0.21 0.12 0.66 0.23 0.46
Total yield (TY)
Direct - 0.04 -0.08 - 0.06 0.22
Indirect - - -
-NE - 0.05 0.07 - 0.08 -0.24
EL - 0.03 0.11 - -0.02 -0.06
ED - 0.27 0.17 - 0.22 0.23
EW - -0.08 -0.08 - 0.01 -0.10
NRE - 0.00 0.00 - 0.02 -0.02
NKR - 0.03 -0.02 - -0.02 0.36
Total - 0.33 0.17 - 0.35 0.39
R2 0.93 0.24 0.11 0.87 0.25 0.33
Pɛ 0.25 0.87 0.95 0.36 0.86 0.81
Table 5. Direct and indirect effects of low and ideal nitrogen levels on root, physiological, and reproductive traits, according to nitrogen use efficiency based on yield (NUEY), nitrogen use efficiency in the V8 stage (NUEV8), and nitrogen use efficiency in the VT stage (NUEVT), for tropical corn (Zea mays) inbred lines.
Effect(1) Low N Ideal N
NUEY NUEV8 NUEVT NUEY NUEV8 NUEVT
Lateral root length (LatRL)
Direct -0.33 0.18 0.52 -0.56 0.30 0.52
Indirect
AxiRL -0.19 0.00 0.10 -0.28 -0.23 0.06
LatRV 0.39 -0.21 -0.52 0.82 -0.10 -0.59
AxiRV 0.14 0.34 0.09 0.10 0.36 0.18
PEPSII 0.00 0.00 0.00 0.01 0.00 0.00
ASI 0.00 0.00 0.00 0.00 0.00 0.00
Total 0.01 0.31 0.19 0.09 0.33 0.17
Axial root length (AxiRL)
Direct 0.26 0.00 0.14 -0.40 -0.31 0.09
Indirect
LatRL -0.24 0.14 0.39 -0.40 0.21 0.37
LatRV 0.37 -0.20 -0.48 0.76 -0.10 -0.55
AxiRV 0.20 0.47 0.12 0.14 0.48 0.25
PEPSII -0.01 0.00 -0.01 0.02 0.00 0.00
ASI -0.01 0.00 -0.01 0.01 -0.02 0.00
Total 0.57 0.41 0.15 0.13 0.26 0.16
Lateral root volume (LatRV)
Direct 0.43 -0.23 -0.56 0.88 -0.12 -0.64
Indirect
LatRL -0.30 0.17 0.48 -0.52 0.28 0.48
AxiRL -0.22 0.00 0.12 -0.34 -0.27 0.07
AxiRV 0.16 0.38 0.10 0.12 0.40 0.21
PEPSII 0.00 0.00 0.00 0.01 0.00 0.00
ASI -0.01 0.00 -0.01 0.00 -0.01 0.00
Total 0.06 0.32 0.13 0.15 0.28 0.12
Axial root volume (AxiRV)
Direct 0.28 0.68 0.18 0.20 0.68 0.35
Indirect
LatRL -0.16 0.09 0.27 -0.29 0.16 0.27
AxiRL -0.18 0.00 0.09 -0.28 -0.22 0.06
LatRV 0.24 -0.13 -0.32 0.52 -0.07 -0.37
PEPSII -0.02 0.00 -0.02 0.03 0.00 0.00
ASI 0.00 0.00 0.00 0.00 0.00 0.00
Total 0.16 0.64 0.20 0.18 0.55 0.31
Photosynthetic efficiency of photosystem II (PEPSII)
Direct 0.11 -0.01 0.09 0.13 0.00 0.00
Indirect
LatRL 0.01 0.00 -0.02 -0.06 0.03 0.06
AxiRL 0.02 0.00 -0.01 -0.07 -0.05 0.01
LatRV -0.01 0.00 0.01 0.09 -0.01 -0.06
AxiRV -0.06 -0.14 -0.04 0.04 0.14 0.07
ASI -0.01 0.00 -0.01 0.00 0.00 0.00
Total -0.06 -0.15 0.02 0.13 0.11 0.08
Anthesis-silking interval (ASI)
Direct -0.07 0.00 -0.04 0.02 -0.12 0.00
Indirect
LatRL -0.03 0.02 0.05 -0.02 0.01 0.02
AxiRL -0.04 0.00 0.02 -0.07 -0.06 0.01
LatRV 0.06 0.01 -0.08 0.10 -0.01 -0.07
AxiRV 0.00 0.01 0.00 0.00 -0.01 0.00
PEPSII 0.02 0.00 0.01 0.00 0.00 0.00
Total -0.06 -0.02 -0.04 0.03 -0.19 -0.04
R2 0.06 0.42 0.09 0.08 0.39 0.14
Pɛ 0.96 0.76 0.95 0.95 0.78 0.93
Conclusions
1. Corn (Zea mays) inbred lines efficient in nitrogen
use can be obtained through selection, especially in environments with low nitrogen availability.
2. Root, reproductive, and physiological traits are not promising for early selection of corn inbred lines
efficient in nitrogen use, nor is the selection in the V8 and VT growth stages, which should also take yield
into account.
Acknowledgments
To Pioneer Hi-bred International, Inc., for the
supporting this research; to Fundação de Amparo
à Pesquisa do Estado de São Paulo (Fapesp), for grant (number 2013/24135-2); and to Coordenação de Aperfeiçoamento de Pessoal de Nível Superior (Capes), for financial support (process number 99999.002429/2015-02).
References
ABDEL-GHANI, A.H.; KUMAR, B.; REYES-MATAMOROS, J.; GONZALEZ-PORTILLA, P.J.; JANSEN, C.; SAN MARTIN, J.P.; LEE, M.; LÜBBERSTEDT, T. Genotypic variation and
relationships between seedling and adult plant traits in maize
(Zea mays L.) inbred lines grown under contrasting nitrogen
levels. Euphytica, v.189, p.123-133, 2013. DOI: 10.1007/s10681-012-0759-0.
CAIXETA, D.S.; FRITSCHE-NETO, R.; GRANATO, I.S.C.; OLIVEIRA, L.R. de; GALVÃO, J.C.C. Early indirect selection for nitrogen use efficiency in maize. Revista Ciência Agronômica, v.46, p.369-378, 2015. DOI: 10.5935/1806-6690.20150016.
COQUE, M.; GALLAIS, A. Genomic regions involved in response
to grain yield selection at high and low nitrogen fertilization in maize. Theoretical and Applied Genetics, v.112, p.1205-1220, 2006. DOI: 10.1007/s00122-006-0222-5.
CRUZ, C.A.; CECÍLIO FILHO, A.B.; MENESES, N.B.; CUNHA, T.P.L. da; NOWAKI, R.H.D.; BARBOSA, J.C. Influence of amount
and parceling of nitrogen fertilizer on productivity and industrial
revenue of sweet corn (Zea mays L.). Australian Journal of Crop Science, v.9, p.895-900, 2015.
CRUZ, C.D. GENES: a software package for analysis in
experimental statistics and quantitative genetics. Acta Scientiarum. Agronomy, v.35, p.271-276, 2013. DOI: 10.4025/ actasciagron.v35i3.21251.
CRUZ, C.D.; REGAZZI, A.J.; CARNEIRO, P.C.S. Modelos biométricos aplicados ao melhoramento genético. 4.ed. Viçosa:
Ed. da UFV, 2012. 514p.
DAWSON, J.C.; HUGGINS, D.R.; JONES, S.S. Characterizing nitrogen use efficiency in natural and agricultural ecosystems to
improve the performance of cereal crops in low-input and organic agricultural systems. Field Crops Research, v.107, p.89-101, 2008. DOI: 10.1016/j.fcr.2008.01.001.
DOVALE, J.C.; FRITSCHE-NETO, R. Genetic control of traits associated with phosphorus use efficiency in maize by REML/ BLUP. Revista Ciência Agronômica, v.44, p.554-563, 2013. DOI: 10.1590/S1806-66902013000300018.
DOVALE, J.C.; FRITSCHE-NETO, R.; BERMUDEZ, F.P.; MIRANDA, G.V. Efeitos gênicos de caracteres associados à eficiência no uso de nitrogênio em milho. Pesquisa Agropecuária Brasileira, v.47, p.385-392, 2012. DOI: 10.1590/S0100-204X2012000300010.
FREITAS, I.L. de J.; AMARAL JUNIOR, A.T. do; VIANA, A.P.; PENA, G.F.; CABRAL, P. da S.; VITTORAZZI, C.; SILVA, T.R. da C. Ganho genético avaliado com índices de seleção e com REML/Blup em milho-pipoca. Pesquisa Agropecuária Brasileira, v.48, p.1464-1471, 2013. DOI: 10.1590/S0100-204X2013001100007.
GALLAIS, A.; COQUE, M. Genetic variation and selection for nitrogen use efficiency in maize: a synthesis. Maydica, v.50, p.531-547, 2005.
GARNETT, T.; CONN, V.; KAISER, B.N. Root based approaches to improving nitrogen use efficiency in plants. Plant, Cell and Environment, v.32, p.1272-1283, 2009. DOI: 10.1111/j.1365-3040.2009.02011.x.
GILMOUR, A.R.; GOGEL, B.J.; CULLIS, B.R. THOMPSON, R.
ASReml user guide: release 3.0. Hemel Hempstead: VSN International,
2009. 372p. Available at: ˂http://www.vsni.co.uk/downloads/asreml/ release3/UserGuide.pdf˃. Accessed on: Jan. 1 2016.
JACOBS, B.C.; PEARSON, C.J. Potential yield of maize
determined by rates of growth and development of ears. Field Crops Research, v.27, p.281-298, 1991. DOI:
10.1016/0378-4290(91)90067-6.
LYNCH, J.P. Steep, cheap and deep: an ideotype to optimize water and N acquisition by maize root systems. Annals of Botany, v.112, p.347-357, 2013. DOI: 10.1093/aob/mcs293.
MATTA, F.M. da; MAESTRI, M.; MOSQUIM, P.R.; BARROS, R.S. Photosynthesis in coffee (Coffea arabica and C. canephora)
as affected by winter and summer conditions. Plant Science,
v.128, p.43-50, 1997. DOI: 10.1016/S0168-9452(97)00142-8. MELO, A.S. de; SUASSUNA, J.F.; FERNANDES, P.D.; BRITO, M.E.B.; SUASSUNA, A.F.; AGUIAR NETTO, A. de O. Crescimento vegetativo, resistência estomática, eficiência fotossintética e rendimento do fruto da melancieira em diferentes níveis de água. Acta Scientiarum. Agronomy, v.32, p.73-79, 2010.
MOLL, R.H.; KAMPRATH, E.J.; JACKSON, W.A. Analysis and interpretation of factors which contribute to efficiency of nitrogen
utilization. Agronomy Journal, v.74, p.562-564, 1982. DOI: 10.2134/agronj1982.00021962007400030037x.
MONTGOMERY, D.C.; PECK, E.A. Introduction to linear regression analysis. 2nd ed. Hoboken: John Wiley & Sons, 1992. 544p.
PENG, Y.; LI, X.; LI, C. Temporal and spatial profiling of root
nitrogen supplies in the field. PLoS ONE, v.7, e37726, 2012. DOI: 10.1371/journal.pone.0037726.
PRESTERL, T.; SEITZ, G.; LANDBECK, M.; THIEMT, E.M.; SCHMIDT, W.; GEIGER, H.H. Improving nitrogen use efficiency in European maize: estimation of quantitative genetic
parameters. Crop Science, v.43, p.1259-1265, 2003. DOI: 10.2135/ cropsci2003.1259.
RANGEL, R.M.; AMARAL JÚNIOR, A.T. do; GONÇALVES, L.S.A.; FREITAS JÚNIOR, S. de P.; CANDIDO, L.S. Análise biométrica de ganhos por seleção em população de milho
pipoca de quinto ciclo de seleção recorrente. Revista Ciência Agronômica, v.42, p.473-481, 2011.
RICH, S.M.; WATT, M. Soil conditions and cereal root system
architecture: review and considerations for linking Darwin and
Weaver. Journal of Experimental Botany, v.64, p.1193-1208, 2013. DOI: 10.1093/jxb/ert043.
SOARES, M.O.; MIRANDA, G.V.; GUIMARÃES, L.J.M.; MARRIEL, I.E.; GUIMARÃES C.T. Parâmetros genéticos de uma população de milho em níveis contrastantes de nitrogênio.
Revista Ciência Agronômica, v.42, p.168-174, 2011.
TEIXEIRA, F.F.; GOMIDE, R.L.; ALBUQUERQUE, P.E.P. de; ANDRADE, C.L.T. de; LEITE, C.E.P.; PARENTONI, S.N.; GUIMARÃES, P.E. de O.; GUIMARÃES, L.J.M.; SILVA, A.R.; BASTOS, E.A.; CARDOSO, M.J. Evaluation of maize core
collection for drought tolerance. Crop Breeding and Applied Biotechnology, v.10, p.312-320, 2010. DOI: 10.1590/S1984-70332010000400005.
TRACHSEL, S.; MESSMER, R.; STAMP, P.; HUND, A. Mapping of QTLs for lateral and axile root growth of tropical
maize. Theoretical and Applied Genetics, v.119, p.1413-1424, 2009. DOI: 10.1007/s00122-009-1144-9.
VESSEY, J.K.; RAPER JUNIOR, C.D.; HENRY, L.T. Cyclic
variations in nitrogen uptake rate in soybean plants: uptake during reproductive growth. Journal of Experimental Botany, v.41, p.1579-1584, 1990. DOI: 10.1093/jxb/41.12.1579.
WRIGHT, S. Correlation and causation. Journal of Agricultural Research, v.20, p.557-585, 1921.
YAN, W.; TINKER, N.A. An integrated biplot analysis system for
displaying, interpreting, and exploring genotype x environment interaction. Crop Science, v.45, p.1004-1016, 2005. DOI: 10.2135/ cropsci2004.0076.