Comparison of serum PCT and CRP levels in patients
infected by different pathogenic microorganisms:
a systematic review and meta-analysis
Jun-Hua Tang
1, Dong-Ping Gao
2and Peng-Fei Zou
3,4 1Department of Respiration, The First People’s Hospital of Fuyang Hangzhou, Hangzhou, China 2
Department of Pharmacy, Hangzhou Cancer Hospital, Hangzhou, China 3
Department of Infectious Disease, Zhejiang University International Hospital, Hangzhou, China 4
Department of Infectious Disease, Shulan (Hangzhou) Hospital, Hangzhou, China
Abstract
To avoid the abuse and misuse of antibiotics, procalcitonin (PCT) and C-reactive protein (CRP) have been used as new approaches to identify different types of infection. Multiple databases were adopted to search relevant studies, and the articles that satisfied the inclusion criteria were included. Meta-analyses were conducted with Review Manager 5.0, and to estimate the quality of each article, risk of bias was assessed. Eight articles satisfied the inclusion criteria. The concentrations of both PCT and CRP in patients with bacterial infection were higher than those with non-bacterial infection. Both PCT and CRP levels in patients with G–bacterial infection were higher than in those with G+bacterial infection and
fungus infection. In the G+bacterial infection group, a higher concentration of CRP was observed compared with fungus infection group, while the difference of PCT between G+ bacterial infection and fungus infection was not significant. Our study suggested that both PCT and CRP are helpful to a certain extent in detecting pneumonia caused by different types of infection.
Key words: Pulmonary infection; PCT; CRP; Bacteria; Fungus
Introduction
Pulmonary infection is commonly treated by antibiotic therapy in primary care, and has high morbidity and mortality (1,2). Excessive use of antibiotics is the main cause of increased antibiotic resistance. It has been reported that inadequate antimicrobial treatment affects morbidity and mortality (3–5). Therefore, an appropriate disease assessment is a vital early step in the judicious use of antibiotics and management of patients (6,7). More-over, a sensitive and specific marker that could recognize bacterial infections early is needed.
The identification of pulmonary infection in adults should be conducted to enable appropriate investigation and prompt treatment (8,9). Several methods have been applied to detect pulmonary infection, including clinical symp-tomatology, radiological examination, inflammatory mar-kers, blood culture, cytology, and microbiology (1). Serum biomarkers such as white cell count, lactate dehydrogen-ase, leukocyte count, and glucose have also been shown as effective detection methods (10). Ideal indices require accurate identification of infectious and non-infectious disease, and easy and rapid application and detection.
As clinical signs and symptoms of infection and laboratory parameters are often inconclusive and some serum bio-markers are elevated in non-infective inflammatory pro-cesses, procalcitonin (PCT) and C-reactive protein (CRP) have been studied as novel biomarkers in infectious and inflammatory diseases (11).
PCT and CRP are new approaches used to guide antibiotic therapy and have been researched as markers of infection in serum and pleural fluid. Normally, the concentration of serum PCT is negligible or relatively low with a viral infection, and after a bacterial infection, the levels increase significantly (12). Previous studies have reported that PCT in pleural fluid have no clinical use in diagnosis or prognosis, while serum PCT may have a role in differentiating pulmonary infection (13,14). Serum levels of PCT are increased with a bacterial infection, while levels are unchanged or only moderately increase in a non-infection condition (5,15). CRP, secreted by the liver in response to bacterial infections, is another parameter used to diagnose infection (15). It is synthesized within 4–6 h after the occurrence of inflammation and could peak
Correspondence: Peng-Fei Zou:<mxg6gu@163.com>
after around 36 h (16,17). This study sought to assess the difference of serum PCT and CRP concentrations in patients infected by different microorganisms, including G+bacteria, G–bacteria, and fungus.
Material and Methods
Search strategy
To search the relevant published citations, multiple electronic databases including PubMed, Springer, EMBASE, OVID, and China Full-text Journal Database were used without language restrictions. To maximize the search accuracy, the following MeSH terms were assembled with the Boolean operator‘‘OR’’: 1) pulmonary infection OR lung infection OR respiratory infection; 2) procalcitonin OR PCT OR C-reactive protein OR CRP. Related articles with any publication status (published, unpublished, in press, and in progress) published from January 2000 to January 2016 were systematically searched and reviewed. Two authors (J-H Tang and D-P Gao) of our team searched the literature independently and examined the reference lists to obtain additional relevant studies that were not identified.
Study selection
Two authors (J-H Tang and D-P Gao) selected the citations independently with the following inclusion criteria: 1) adult patients with pulmonary infection; 2) sample size more than 50; 3) a randomized control trial or controlled clinical trial; 4) comparison of PCT or CRP between patients with pulmonary infection and control; and 5) availability of full text. The exclusion criteria were: 1) non-randomized studies; 2) studies on other diseases rather than pulmo-nary infection; and 3) studies lacking outcome parameters or comparable results. They screened the titles and abstracts
Table 1.Characteristics of the included studies.
Author Year Year of
onset
Age range
Gender distribution (male/female)
Sample size (infection/control)
Pathogenic microorganism
Parameters
Chen YJ (18) 2016 Apr 2012 to Apr 2015
19–79 57/43 100 (50/50) G+bacteria,
G–bacteria, Fungus
PCT, CRP
Du HS (19) 2011 Jan 2013 to Dec 2013
18–82 105/104 210 (131/79) G+bacteria, G–bacteria, Fungus
PCT, CRP
Porfyridis (20) 2014 Nov 2010 to Jan 2012
Infection: 79.6±15.4;
Control: 79.8±6.3
54/33 87 (58/29) Bacteria PCT, CRP
Sun WF (21) 2011 Dec 2008 to Dec 2010
13–78 36/33 69 (39/30) Bacteria PCT, CRP
Wang XD (22) 2016 May 2014 to Dec 2015
37–79 207/131 338 (280/58) G+bacteria, G–bacteria, Fungus
PCT
Xiao L (23) 2015 Jan 2014 to Jan 2015
17–80 86/74 160 (120/40) G+bacteria, G–bacteria, Fungus
PCT, CRP
Yang AL (24) 2014 Jun 2011 to Aug 2012
38–69 88/68 156 (78/78) Bacteria PCT, CRP
Zhang JY (25) 2015 Jul 2013 to Aug 2014
19–78 100/100 200 (120/80) G+bacteria, G–bacteria, Fungus
PCT, CRP
PCT: procalcitonin; CRP: C-reactive protein.
of the articles, and subsequently, the full text of the studies that potentially met the criteria was obtained. The two investigators determined the included articles together, and disagreements were resolved by consultation with a third investigator, if necessary.
Data extraction
After reading the full text of the articles, the character-istics from each study were extracted using a standard data extraction: thefirst author’s name, year of publication, year of onset, age range of patients, gender distribution (male/female), sample size (infection/control), pathogenic microorganism, and parameters. Pathogenic microorgan-ism in this study included bacteria and fungus, and in some articles, bacteria were subdivided into G+ and G–. The parameters included PCT, CRP or both.
Statistical analysis
Meta-analyses were conduct with the software Review Manager 5.0 (Cochrane Collaboration, 2011) to estimate the serum concentration of PCT and CRP in patients with or without pulmonary infection among selected articles. For continuous outcomes, standard mean difference (SMD) with 95% confidence intervals (CIs) of serum PCT and CRP were calculated. Po0.05 was considered statisti-cally significant. Heterogeneities in this study were assessed using the I2index. We chose the random-effect model when the I2statistic was450%, otherwise thefixed-effect model
was applied.
In addition, the quality of the studies was assessed with sensitivity analysis and bias analysis. Risk of bias was independently assessed according to the Cochrane Handbook for Systematic Reviews of Interventions by two members of our team. In case of disagreement, a third investigator was the adjudicator. To estimate possible publication bias, funnel plot and Egger’s test was con-ducted with STATA 10.0 software.
Results
Search results
As shown in theflow diagram of Figure 1, 856 relevant studies were initially found, and 848 articles were excluded for duplication, irrelevant studies, incomplete data, incom-plete comparison, other diseases, and not a full-text. Finally, 8 articles (18–25) satisfied the inclusion criteria. Among these, 3 studies assessed only bacterial infection, and the other 5 included G+bacteria, G–bacteria, and fungus infection.
Characteristics of included studies
Detailed characteristics of the included studies are reported in Table 1. All studies were published from 2011 to 2016. The sample size ranged from 69 to 338. In total, 876 patients with pulmonary infection and 443 without pulmonary infection were included in the analyses.
Quality assessment
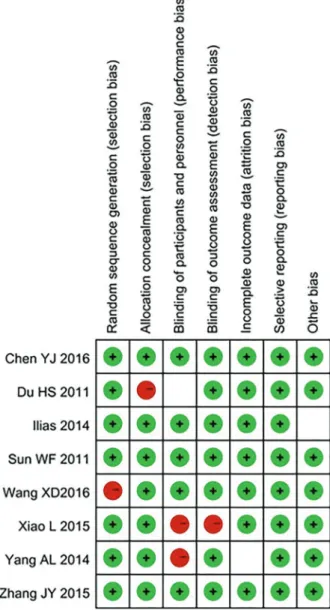
The results for risk of bias are shown in Figure 2.
Meta-analysis of the detection indices
PCT. Forest plots for the concentration of PCT between different groups are presented in Figures 3 and 4. The meta-analyses results showed that the concentration of PCT in patients with bacterial infection was much higher than that of control. When bacterial infection was sub-divided into G+and G–bacterial infection, the concentra-tion of PCT of these two group were significantly above the concentration of the control group. Besides, the concentra-tion of PCT in patients with fungus infecconcentra-tion exceeded that of the control group.
The concentration of PCT in patients with G– bacterial infection was much higher than that of G+bacterial infec-tion and fungus infecinfec-tion group, while the difference between G+bacterial infection and fungus infection was not significant. CRP. Figures 5 and 6 show the comparisons of CRP concentrations between different groups. The result sug-gested that the concentration of CRP in patients with bacterial infection was much higher than that of control. Four of the 8 included studies assessed the concentration
of CRP in patients infected by different pathogenic micro-organism. All patients with G+bacterial, G–bacterial, and fungus infections had higher concentration compared with the control group.
The concentration of CRP in patients infected by G–bacteria was much higher than that of G+bacterial infection and fungus infection groups, and the G+bacterial infection also had higher concentrations than the fungus infection group.
Bias analysis
Despite the high heterogeneities of the included studies, we were not concerned about publication bias as only 8 articles were included (26).
Discussion
The use of PCT and CRP as biomarkers for discrimi-nating bacterial infection has been discussed in various studies, but this is the first meta-analysis that involved comparing the difference of PCT and CRP in patients infected by different pathogens.
Decisions about antibiotic treatment for infections are made by physicians based on detection results (27,28). In recent years, PCT and CRP are the two most common markers, which are easy to assess and have high sensitivity and specificity (29,30). It is known that serum PCT levels are higher in bacterial, fungal, and parasitic infections than in viral infections or non-infected patients, which has made PCT a guide to antibiotic treatment in
pneumonia (31,32). The results of this study showed that serum PCT concentration was significantly higher in patients with bacterial pneumonia than patients without pneumonia. The level was the highest in patients infected by G–bacteria, while the concentration in G+ bacterial infection was as high as that in fungus infection. All these results suggested that PCT levels could be useful in discriminating between these conditions, could help physi-cians’decisions on using antibiotics or not.
group was different, which means that physicians could identify the infection by measuring CRP levels.
Though the concentrations of PCT and CRP in different infections were different, it is necessary to establish a cut-off value. Unfortunately, the criteria used for thresholds establishment in the included studies were heterogeneous, perhaps due to the different profile of subjects or inclusion and exclusion criteria. Porfyridis et al. (20) reported that serum PCT levels o1.1 ng/mL were considered normal. We could not differentiate G+ bacterial infection from
fungus infection using PCT, as the concentrations were similar. From index comprehensive results, we think that 10 ng/mL could be the cut-off value to distinguish G–bacterial infection from G+bacterial infection or fungus infection. For CRP, if the concentration is o10 mg/L, we could discard bacterial infection (18,19). As the concentra-tion of CRP in G+bacterial infection is about 48 mg/L and in G–bacterial infection the value is about two times higher, we think 70B80 could be the cut-off value to distinguish between them.
According to the above results, we suggest that to a certain extent both PCT and CRP are helpful in differentiat-ing different types of infections, and the levels could aid clinicians in identifying those patients who do not need antibiotics as a supplementary means. By reducing the number of less reliable tests such as leukocyte count and white cell count, and consequently the unnecessary use of antibiotics, the cost-effectiveness of detection is also increased.
Although this study suggested that PCT and CRP could be the markers to diagnose pulmonary infection, there are some potential biases and limitations in our study. First, the increase of antibiotic therapy may reduce the levels of PCT and affect the results. In addition, some studies that were included in our meta-analysis enrolled
patients with high willingness to participate and interested in improving treatment and physicians with high motiva-tion, which may have caused selection biases. As high heterogeneities were observed in the meta-analyses, we selected random effect models. The reasons for high heterogeneity are complex and we believe that different test technologies and the limited number of included articles may be the main causes. Thus, in-depth and high-quality research is required to reduce heterogeneities and potential biases.
With the abuse of antibiotics for pulmonary infection, the diagnosis needs to be more sensitive and specific to help the decision-making process. We suggest that both PCT and CRP levels may be helpful in diagnosing infections and distinguishing between different pathogens.
References
1. Davies HE, Davies RJ, Davies CW, Group BTSPDG. Management of pleural infection in adults: British Thoracic Society Pleural Disease Guideline 2010. Thorax 2010; 65(Suppl 2): ii41–ii53, doi: 10.1136/thx.2010.137000.
2. Gonzales R, Malone DC, Maselli JH, Sande MA. Excessive antibiotic use for acute respiratory infections in the United States.Clin infect Dis 2001; 33: 757–762, doi: 10.1086/ 322627.
3. Luna CM, Vujacich P, Niederman MS, Vay C, Gherardi C, Matera J, et al. Impact of BAL data on the therapy and outcome of ventilator-associated pneumonia.Chest1997; 111: 676–685, doi: 10.1378/chest.111.3.676.
4. Rello J, Gallego M, Mariscal D, Sonora R, Valles J. The value of routine microbial investigation in ventilator-associated pneumonia.Am J Respir Crit Care Med1997; 156: 196– 200, doi: 10.1164/ajrccm.156.1.9607030.
5. Kollef MH, Sherman G, Ward S, Fraser VJ. Inadequate antimicrobial treatment of infections: a risk factor for hospital mortality among critically ill patients. Chest 1999; 115: 462–474, doi: 10.1378/chest.115.2.462.
6. Little P, Gould C, Williamson I, Warner G, Gantley M, Kinmonth AL. Reattendance and complications in a rando-mised trial of prescribing strategies for sore throat: the medicalising effect of prescribing antibiotics.BMJ1997; 315: 350–352, doi: 10.1136/bmj.315.7104.350.
7. Mainous AG 3rd, Hueston WJ. The cost of antibiotics in treating upper respiratory tract infections in a medicaid population.Arch Fam Med1998; 7: 45–49, doi: 10.1001/ archfami.7.1.45.
8. Maskell NA, Batt S, Hedley EL, Davies CW, Gillespie SH, Davies RJ. The bacteriology of pleural infection by genetic and standard methods and its mortality significance.Am J
Respir Crit Care Med 2006; 174: 817–823, doi: 10.1164/
rccm.200601-074OC.
9. Ferguson AD, Prescott RJ, Selkon JB, Watson D, Swinburn CR. The clinical course and management of thoracic empyema. QJM 1996; 89: 285–289, doi: 10.1093/qjmed/ 89.4.285.
10. Tobin CL, Lee YC. Pleural infection: what we need to know but don’t. CurrOpin Pulm Med 2012; 18: 321–325, doi: 10.1097/MCP.0b013e328352c673.
11. McCann FJ, Chapman SJ, Yu WC, Maskell NA, Davies RJ, Lee YC. Ability of procalcitonin to discriminate infection from non-infective inflammation using two pleural disease set-tings.PloS One2012; 7: e49894, doi: 10.1371/journal.pone. 0049894.
12. Muller B, Becker KL, Schachinger H, Rickenbacher PR, Huber PR, Zimmerli W, et al. Calcitonin precursors are reliable markers of sepsis in a medical intensive care unit.
Crit Care Med2000; 28: 977–983, doi:
10.1097/00003246-200004000-00011.
13. Porcel JM, Vives M, Cao G, Bielsa S, Ruiz-Gonzalez A, Martinez-Iribarren A, et al. Biomarkers of infection for the differential diagnosis of pleural effusions.Eur Respir J 2009; 34:1383–1389, doi: 10.1183/09031936.00197208. 14. Lee SH, Lee EJ, Min KH, Hur GY, Lee SY, Kim JH, et al. Procalcitonin as a diagnostic marker in differentiating para-pneumonic effusion from tuberculous pleurisy or malignant effusion.Clin Biochem2013; 46: 1484–1488, doi: 10.1016/j. clinbiochem.2013.03.018.
15. Ugarte H, Silva E, Mercan D, De Mendonca A, Vincent JL. Procalcitonin used as a marker of infection in the intensive care unit.Crit Care Med1999; 27: 498–504, doi: 10.1097/ 00003246-199903000-00024.
16. Jaye DL, Waites KB. Clinical applications of C-reactive protein in pediatrics.Pediatr Infect Dis J1997; 16: 735–746; quiz 46–47, doi: 10.1097/00006454-199708000-00003. 17. Du Clos TW. Function of C-reactive protein.Ann Med2000;
32: 274–278, doi: 10.3109/07853890009011772.
18. Chen YJ. Clinical value of combined detection of PCT and CRP in patients with pulmonary infection.Clin Med2016; 36: 112-113.
19. Du HS, Wang ZG, Wang LJ. The value of the C-reactive protein and procalcitonin detection in patients with pulmon-ary infection.Lab Immunoassay Clin Med2015; 22: 23–24. 20. Porfyridis I, Georgiadis G, Vogazianos P, Mitis G, Georgiou A. C-reactive protein, procalcitonin, clinical pulmonary infection score, and pneumonia severity scores in nursing home acquired pneumonia.Respir Care2014; 59: 574–581, doi: 10.4187/respcare.02741.
21. Sun WF, Guo YH, Du XT. Clinical difference and value of serum procalcitonin in peripheral blood of patients with different pathogens pulmonary infection.Chin J Diffic Compl Cas2011; 10: 940–941.
22. Wang XD, Wang R, Li FH. Value of procalcitonin detection in diagnosis and treatment of severe pulmonary infection.Int J
Lab Med2016; 37: 2621–2623.
23. Xiao L. Analysis and value evaluation of C reactive protein and procalcitonin in patients with pulmonary infection.Cap Med2015; 22: 150.
24. Yang AL, Chen X, Liu DJ. Diagnostic value of serum procalcitonin detection in patients with pneumonia.Modern J
Integr Trad Chinese Western Med2014; 23: 2824–2826.
25. Zhang JY. Clinical significance of C reactive protein and calcitonin proto detection in patients with pulmonary infec-tion.China Foreign Med Treat2015; 26: 186–187. 26. Song F, Eastwood AJ, Gilbody S, Duley L, Sutton AJ.
Publication and related biases. Health Technol Assess 2000; 4: 1–115.
27. Briel M, Young J, Tschudi P, Hersberger KE, Hugenschmidt C, Langewitz W, et al. Prevalence and influence of diagnostic tests for acute respiratory tract infections in primary care.Swiss Med Weekly2006; 136: 248–253. 28. Winkens R, Dinant GJ. Evidence base of clinical diagnosis:
Rational, cost effective use of investigations in clinical practice. BMJ2002; 324: 783, doi: 10.1136/bmj.324.7340.783. 29. Carcillo JA, Planquois JS, Goldstein B. Early markers of
infection and sepsis in newborns and children.Adv Sepsis 2006; 5: 118–125.
30. Altunhan H, Annagur A, Ors R, Mehmetoglu I. Procalcitonin measurement at 24 hours of age may be helpful in the prompt diagnosis of early-onset neonatal sepsis. Interna-tional journal of infectious diseases.IJID2011; 15: e854– e858, doi: 10.1016/j.ijid.2011.09.007.
31. Stolz D, Christ-Crain M, Bingisser R, Leuppi J, Miedinger D, Muller C, et al. Antibiotic treatment of exacerbations of COPD: a randomized, controlled trial comparing procalcitonin-guidance with standard therapy.Chest2007; 131: 9–19, doi: 10.1378/chest.06-1500.
32. Christ-Crain M, Jaccard-Stolz D, Bingisser R, Gencay MM, Huber PR, Tamm M, et al. Effect of procalcitonin-guided treatment on antibiotic use and outcome in lower respiratory tract infections: cluster-randomised, single-blinded intervention trial.Lancet2004; 363: 600–607, doi: 10.1016/S0140-6736(04) 15591-8.