Revista Brasileira de Agricultura Irrigada v.5, nº. 3, p.202-213, 2011 ISSN 1982-7679 (On-line)
Fortaleza, CE, INOVAGRI – http://www.inovagri.org.br Protocolo 058 11 – 31/05/2011 Aprovado em 20/09/2011
DESIGN AND UNCERTAINTY ANALYSIS OF A WEIGHING SYSTEM FOR CONTINUOUS MEASUREMENT OF CROP EVAPOTRANSPIRATION
Aureo Silva de Oliveira1, Lucas Melo Vellame2, Jorge Luiz Copquer dos Santos Junior3, Júlio Melo Vellame4
1 Núcleo de Engenharia de Água e Solo (NEAS), Universidade Federal do Recôncavo da Bahia (UFRB), Rua
Rui Barbosa 710, 44380-000 Cruz das Almas, BA. E-mail: [email protected]
2
NEAS/UFRB, 44380-000. Cruz das Almas, BA.
3 Departamento de Engenharia de Biossistemas, ESALQ/USP, 13418-900 Piracicaba, SP.
4
Graduando em Física, Universidade Federal da Bahia, 40170-110 Salvador, BA
ABSTRACT
Electronic systems for collecting crop evapotranspiration data use load cells as the sensing element. The present work aimed at developing and evaluating a load cell-based weighing system for use with small to medium size continuous weighing lysimeters. It was used a single 300-kg capacity load cell whose signal was conditioned through a differential amplifier to an analogical signal varying from 1 to 5 V. The signal was then converted to digital number through an A/D converter working in the 0 to 10 V range. The A/D circuit allowed reading up to four analogical signals by means of a computer program developed for that purpose. To assess the performance of the weighing system the uncertainty parameters repeatability, hysteresis, linearity and overall accuracy were considered. The overall accuracy, which combines the effects of the other errors, was lower than 1 mm suggesting the suitability of the system for daily ET measurement with low-volume continuous weighing lysimeters. The final cost of the weighing system was less than a thousand dollars and all the components, from load cells to personal computer, can be found in local retail stores.Key
words: Weighing lysimeters, repeatability error, load cell
MONTAGEM E ANÁLISE DE ERRO DE UM SISTEMA DE PESAGEM CONTÍNUA PARA MEDIÇÃO DA EVAPOTRANSPIRAÇÃO DE CULTURAS AGRÍCOLAS
RESUMO
Sistemas eletrônicos de coleta contínua de dados de evapotranspiração de culturas agrícolas (ET) utilizam células de carga como elemento sensível. O presente trabalho teve como objetivo desenvolver e avaliar um sistema de pesagem com célula de carga para uso em lisímetros de pesagem contínua e de pequeno porte. Utilizou-se uma única célula de carga de 300 kg de capacidade cujo sinal era condicionado por um amplificador diferencial em um sinal analógico variando de 1 a 5 V. O sinal posteriormente era convertido em um número digital por um circuito conversor analógico/digital (A/D) operando na faixa de 0 a 10 V. O circuito A/D possibilitava a leitura de até quatro sinais analógicos através de um simples programa de computador desenvolvido para esse fim. Para se acessar o desempenho do sistema consideraram-se os erros de repetibilidade, histerese, linearidade e acurácia, bem como a estabilidade temporal do conversor A/D em relação aos efeitos da temperatura. Com uma acurácia global menor que 1 mm, o sistema mostrou-se adequado para medição da ET
desde a célula de carga ao computador, foi inferior a mil dólares e os componentes eletrônicos utilizados podem ser facilmente encontrados no mercado
nacional.Palavras-chave: Lisímetros de pesagem, erro de repetibilidade, célula de carga
INTRODUCTION
In agricultural fields, the evapotranspiration (ET) represents the water used by the crop to be supplied by precipitation or irrigation. Among the methods currently available for measuring or estimating ET, the continuous weighing lysimeter is one of the most practical (BURMAN and POCHOP, 1994) and perhaps the most accurate for short-term ET measurements (DUGAS et al., 1985; HOWELL et al., 1995; CLAWSON et al., 2009). Campeche et al. (2011) has recently described the development and calibration of large weighing lysimeters for crop water demand studies in Sergipe, Brazil.
The accuracy of ET measurement depends on the lysimeter design (area, shape, and mass), the type of scale (floating, mechanical, or electronic) (HOWELL et al., 1991; ALLEN et al., 2011) and the uncertainty in obtaining the other components of the water balance, as changes in soil moisture, runoff, percolation and precipitation or irrigation (MALONE et al., 2000). Therefore, the main sources for uncertainty in lysimeter-computed ET are: measurement uncertainty and representativeness of the lysimeter data (MALONE et al., 2000).
The use of load cells as part of the weighing mechanism in continuous and intermittent weighing lysimeters has become very common. Along with instrumentation for recording and data processing, load cells dictate the overall accuracy of the system. According to Howell et al. (1995), the load cell-based lysimeters at Bushland, Texas, have ET measurement accuracy necessary to determine ET rates as small as 0.05 to 0.10 mm h-1 over time periods of 30-min or greater. Malone et al. (2000) obtained significant improvements in the weighing
lysimeters at Coshocton, Ohio, after installation of 22.7-kg load cells to measure weight changes. Load cells can measure the total mass of the lysimeter or only a fraction of it sufficiently to encompass the lysimeter daily mass variation due to ET, in which case the scale is equipped with a counter balance mechanism, as mentioned by Wright (1991). The number of load cells to be used depends upon the capacity of a single load cell and the lysimeter dimensions.
The size of a lysimeter not only defines its accuracy but also its total cost, which includes the cost of the weighing system. Most weighing lysimeters have been constructed in rectangular in shape and with surface area that varies from 1 to 20 m2 (HOWELL et al., 1991) and depth up to 2.5 m. The final cost of a large weighing lysimeter can be as high as US$ 30,000 (ALLEN and FISHER, 1990; TOLK et al., 2005) and is directly related to the hardware (material for construction, weighing system type, and data acquisition equipment) and labor costs for fabrication and installation. On the other hand, small lysimeters with weighing and non-weighing mechanisms have been extensively used in soil-plant-atmosphere studies to provide information on soil evaporation (LASCANO and VAN BAVEL, 1986; LIU et al., 2002) or crop ET, in this case, as an alternative to large and expensive lysimeters (WAUGH et al., 1991; MARTIN et al., 2001). Small lysimeters, on the other hand, are limited to shallow-rooted crops (MARTIN et al., 2001).
In order to work properly, the weighing system of lysimeters has to be periodically checked through proper calibration. Parameters like linearity, repeatability, creep, hysteresis, thermal
shift, and overall accuracy of the system should be assessed. Procedures for quantifying such parameters can be found in Wheeler and Ganji (1994). Allen and Fisher (1990), Howell et al. (1995) and Martin et al. (2001) have shown the application of such procedures in lysimetry. The purpose of this paper is to describe in detail the design, construction, and the performance of a load-cell weighing system for use with small lysimeters for measurement of crop water demand. The equipment herein described can be used in both open field and protect environments.
MATERIAL AND METHODS
This work was carried out at the Laboratório de Irrigação e Drenagem do Centro de Ciências Agrárias, Ambientais e Biológicas da Universidade Federal do Recôncavo da Bahia, at Cruz das Almas (12o40´S, 39o30´W), State of Bahia, Brazil.
Overview of the weighing system
The weighing system consisted of a 300-kg strain gage load cell bolted underneath of a weighing platform and a data acquisition system (DAS). The DAS by its turn consisted of a signal modifier unit (SMU), for standardization of the analogical signal from the load cell by means of a differential amplifier working in the range of 1.000 to 5.000 V. The second component of the DAS was the signal converter unit (SCU), which converted the signal from analogical to digital through an A/D converter circuit operating in the 0.000 to 9.999-V range. With this configuration, up to four analogical signals could be read by a program code running in a laptop computer. A diagram of the weighing system is shown in Figure 1. Electronic simulation software was used to draw the electrical circuits for the whole system after which they were assembled in solderless breadboards.
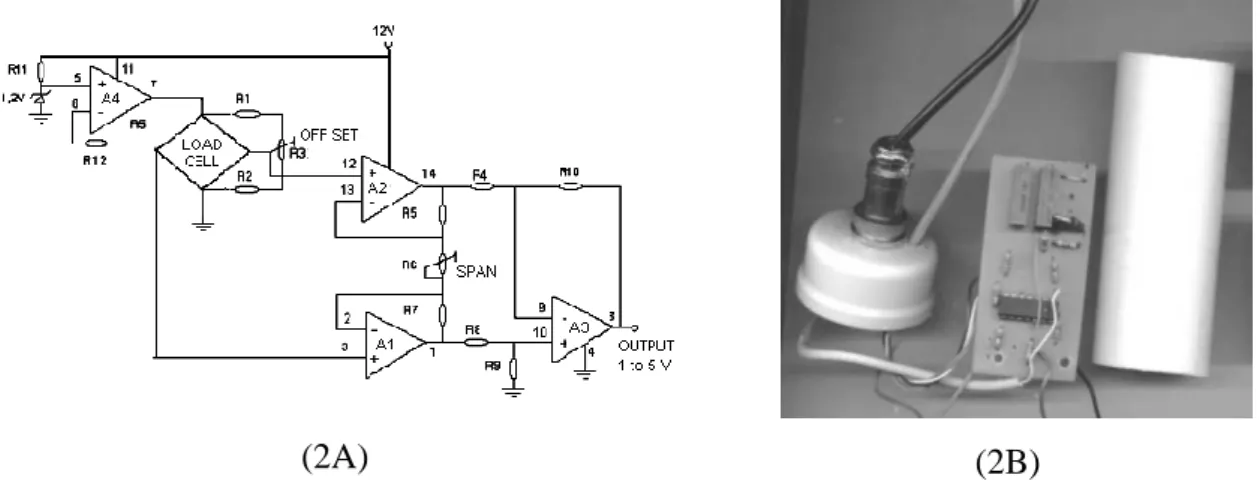
Figure 1. A sketch of the main components of the weighing system
Assembling and calibration of the SMU
A strain gage load cell is an electrical output-sensing device that generates an electrical signal proportional to the force applied on it. This kind of device is suitable for computerized weighing systems and its use is very common in lysimetry (HOWELL et al., 1995; CAMPECHE et al., 2011). The signal generated by an applied mass causes
disequilibrium of a Wheatstone bridge made of extensometers (varying-shape resistors) adhered to the sensor surface. Since the cost of a single load cell is not proportional to its capacity, for this work the best cost/benefit ratio was obtained by using a single 300-kg capacity, temperature-compensated, flexion-type load cell, with a 2-mV/V sensibility on full scale (FS).
Weighing system Data acquisition system
Load cell Signal modifier unit Laptop computer Weighing platform Signal converter unit
The SMU (Figure 2) was designed to amplify the load cell analogical signal in the 1.000 to 5.000-V range, through a differential amplifier (BOYLESTED and NASHELSKY, 1994). This added to the system the advantage of making mass measurements in the field with the three-wire type transmission. The circuit formed
by the operational amplifier A4 (Figure 2A) was used for supplying tension for the load cell. The electronic components were assembled in a circuit board for testing (Figure 2B) and then mounted with pieces of PVC tubes, an option for protecting the system from wetting and other injuries when operating under field conditions.
Figure 2. Electronic circuit of the signal modification unit (SMU) before (A) and after (B) assembling Tests were performed to check the
stability of the circuit when operating under two types of tension supply (constant current and constant tension) over a 24-h period. Supplying the load cell with a constant tension allowed for more stable readings of the analogical signal.
To calibrate the SMU, the circuit was adjusted through the R3 and R6 adjustable resistors (Figure 2A) by placing standard weights on an iron platform with the load cell attached underneath as to simulate a lysimeter. The output voltage was adjusted to 1.000 V with a 100-kg load on the platform and to 5.000 V with a 300-kg load. Defined the two points, intermediate loads were put on the platform in incrementing and decrementing cycles and the voltmeter readings recorded by using a simple computer program developed for that purpose. These data were then used for the accuracy analysis.
Assembling and calibration of the SCU
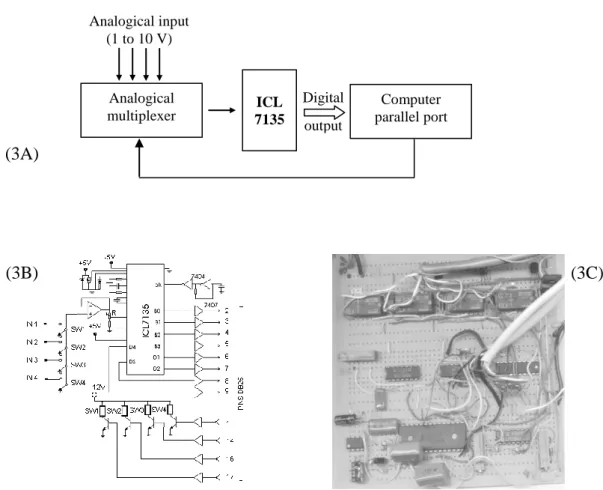
The block diagram of the SCU is shown in Figure 3A with the main components, i.e., the analogical multiplexer and the A/D converter (model
ICL7135, Intersil Corp.)1. The circuit allowed sequential readings of up to four analogical signals through the parallel port of a computer. The choice of the analogical signal was made by activating the relays through pins 1, 14, 16, and 17 of the DB25 connector of the parallel port (address 37A or 27A, port LPT1 or LPT2).
1
Mention of a trade name does not imply endorsement or recommendation of a specific product or maker by the authors
Figure 3. Block (A) and electronic diagram (B) of the signal converter unit (SCU) after assembling (C)
The ICL7135 is an analog-to-digital converter that operates in the 1.999-V range. A tension divisor was wired to it so the circuit could be operated in the 0.000 to 9.999-V range. The digital signal was transmitted to the computer through pins 2 to 9 of the parallel port connector (address 37C or 27C, port LPT1 or LPT2). In order to simplify both the circuit and computer programming only four digits of the A/D converter were used.
The calibration of the SCU required adjustments in the A/D converter. Initially, the tension was adjusted to the reference value (1.000 V) as recommended by the ICL7135 manufacturer. A 9.000 V tension from an external source was applied at the analogical input of the circuit. Then, the R resistor (Figure 3B) was adjusted so that the same tension could also be read in the computer program. Tensions between 0.000 and 9.000 V were applied in
incrementing and decrementing cycles and the values recorded for the uncertainty analysis, following procedures presented by Wheeler and Ganji (1996).
In order to verify the effects of temperature on the stability of the A/D converter, a thermistor was connected to one of the analogical inputs for temperature measurement while a 5.130-V constant tension was applied. Then, the SCU was submitted to a range of temperature from 18 to 34oC and readings at every minute over a 24-h period were recorded.
RESULTS AND DISCUSSIONS
The results of the tests performed on the signal modifier unit (SMU) and signal converter unit (SCU) of the weighing system are graphically shown in Figure 5 and Figure 6, respectively. In both cases, a very high correlation (r2 0.99) was found (3A) (3B) (3C) Computer parallel port ICL 7135 Analogical multiplexer Analogical input (1 to 10 V) Digital output
between the input and output signal, which suggests that both components were not only correctly assembled but that worked properly during the tests. Several authors (MARTIN et al., 2001; MAREK et al., 2006; PAYERO and IRMAK, 2008; CLAWSON et al., 2009) have also reported strong linear relationships between input (changes in mass) and
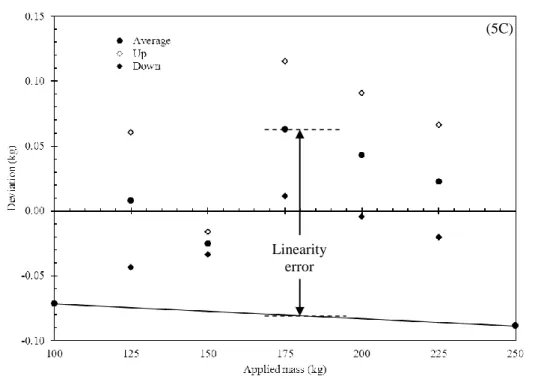
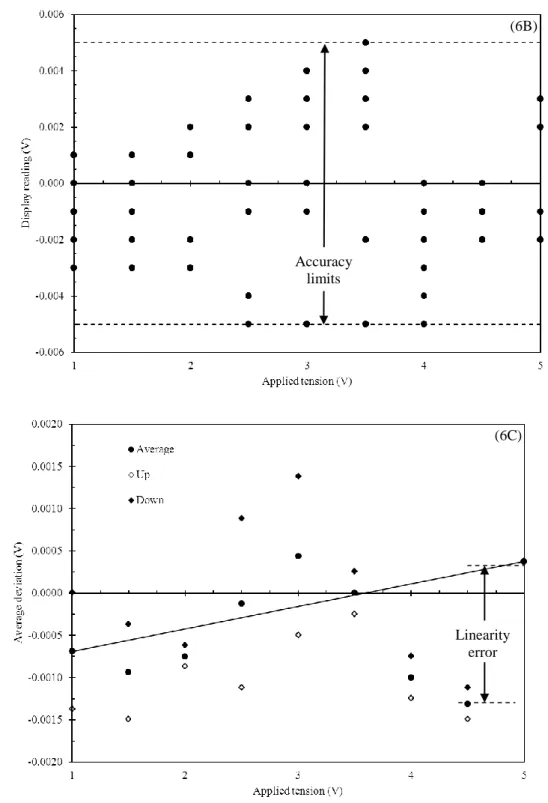
output signals (load cell signals) of commercial weighing systems during calibration of field lysimeters. From the residual plots, the linearity error and the accuracy limits for the SMU (Figure 5B and 5C, respectively) and SCU (Figure 6B and 6C, respectively) components were drawn.
(5A)
(5B)
Accuracy limits
Figure 5. Signal modification unit (SMU) calibration curve (A) and deviation plots with indication of the accuracy limits (B) and the linearity error (C)
(6A) (5C)
Linearity error
Figure 6. Signal converter unit (SCU) calibration curve (A) and deviation plots showing the accuracy limits (B) and linearity error (C).
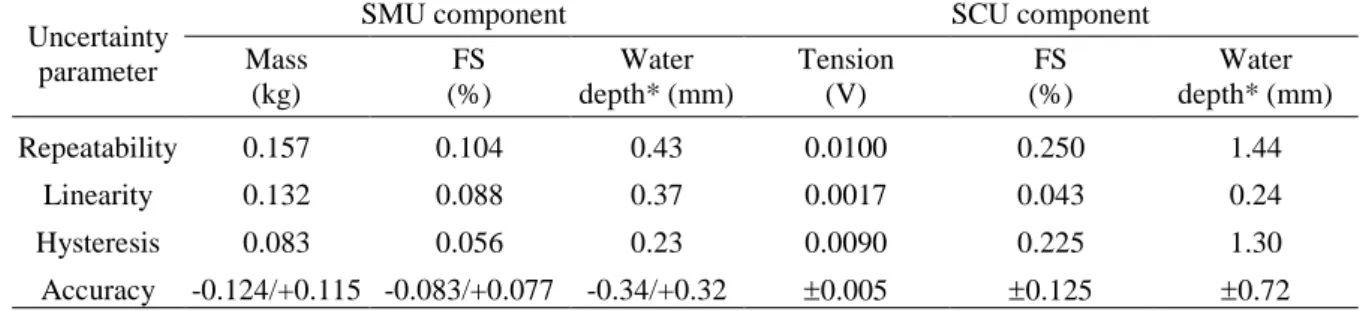
Table 1 shows the parameter values for the SMU performance, in units of mass, percent of full scale, and water
depth. To express these values in equivalent of water depth, a small lysimeter with a hypothetical internal area
(6B) Accuracy limits (6C) Linearity error
of 0.36 m2 (0.6 m x 0.6 m) and 0.4 m depth has been assumed. Error due to repeatability was the highest among the uncertainty parameters in Table 1, which indicates that this parameter was the most important affecting the overall accuracy of the readings. With electronic data acquisition systems, repeatability errors
are minimized because the frequent measurements that can be made at short time intervals as low as 1 s. Table 1 shows that the linearity error was higher than the hysteresis error for the SMU but lower than that for the SCU. Therefore, besides repeatability, the hysteresis error strongly affected the SCU accuracy limits. Table 1. Repeatability, linearity, hysteresis, and accuracy limits for the signal modifier and converter units (SMU and SCU) in terms of mass (kg), percentage of full scale (FS), and water depth (mm).
Uncertainty parameter
SMU component SCU component
Mass (kg) FS (%) Water depth* (mm) Tension (V) FS (%) Water depth* (mm) Repeatability 0.157 0.104 0.43 0.0100 0.250 1.44 Linearity 0.132 0.088 0.37 0.0017 0.043 0.24 Hysteresis 0.083 0.056 0.23 0.0090 0.225 1.30 Accuracy -0.124/+0.115 -0.083/+0.077 -0.34/+0.32 0.005 0.125 0.72 * For a lysimeter with 0.36-m2 internal area (0.6 m x 0.6 m) and 0.4 m depth.
As mentioned before, a lysimeter with an internal area of 0.36 m2 was used to convert the errors in Table 1 from mass unit (kg) to water depth unit (mm). The selected dimensions are in the range of those commonly recommended for small and medium-size weighing lysimeters (MARTIN et al., 2001). The accuracy, which combines the effects of all errors on the measurement process (WHEELER and GANJI, 1996), set the interval within which the true value can be found. Therefore, with a weighing system as designed and evaluated in the present work, the true value of a single reading (R) was expected to fall between (R-0.32) and (R+0.34) mm based on the SMU and to fall between (R-0.72) and (R+0.72) mm based on the SCU, being this component
the source of larger errors. With an overall accuracy lower than 1 mm, the weighing system as designed can be satisfactorily used for daily ET measurements, which is in the range reported by other authors (MARTIN et al., 2001; MAREK et al., 2006; PAYERO and IRMAK, 2008).
Results on the effects of temperature variation on the A/D converter are presented in Figure 7. In the temperature range tested (18 to 34oC), typically found under field conditions, the signal of the A/D converter varied at the rate of 0.0016 V/ºC, which is acceptable for practical applications. This means that, under typical operating conditions temperature is not expected to affect significantly the performance of the system.
Figure 7. Signal converter unit (SCU) sensibility to temperature variation. Advantages of the weighing system
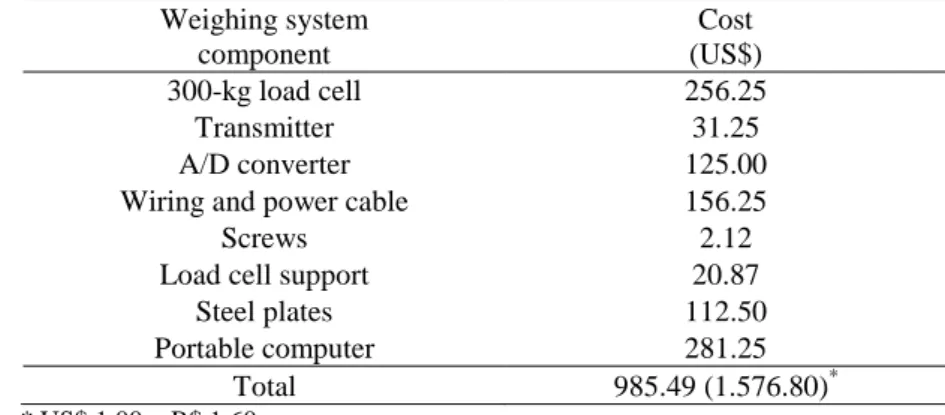
herein presented are the low cost (Table 2) and the availability of the components in local retail stores. The system was designed and constructed with components easily found in hardware stores. Besides the computer requirements do not have to
be demanding in terms of operational system, memory and hard disc capacity. A 10-year old laptop computer with Windows 98 operational system was used for collecting and storing the data during the tests. As shown in Table 2 the final cost was less than US$ 1,000.00.
Table 2. Final cost of the weighing system Weighing system component Cost (US$) 300-kg load cell 256.25 Transmitter 31.25 A/D converter 125.00
Wiring and power cable 156.25
Screws 2.12
Load cell support 20.87
Steel plates 112.50
Portable computer 281.25
Total 985.49 (1.576.80)* * US$ 1.00 = R$ 1,60
The comparison of this system with other reported in the literature cannot be strictly done since reported values usually include the costs of lysimeter construction and installation as well. Additionally, weighing systems for crop ET studies are frequently equipped with commercial dataloggers. Although the price of such
equipment has going down the total cost of a facility for ET measurement that includes labor and all necessary hardware can dramatically increase well above the price of a single component (MESHKAT et al., 1999; PAYERO and IRMAK, 2008). In the study, due to the weighing capacity of the system the use of a single load cell greatly reduced the final cost.
CONCLUSIONS
Low cost and accurate weighing systems can be designed and constructed for measurement of mass variation of small lysimeters used in evapotranspiration studies of shallow-rooted crops. The final cost of the weighing system was less than US$ 1,000.00 with an overall accuracy lower than 1 mm, suitable for daily measurements of ET. All the system components can be found in local retail stores.
ACKNOWLEDGEMENTS
The authors appreciate the financial support from FAPESBState of Bahia Agency for Scientific Research and from CNPqNational Council for Scientific Research and Development. We are also grateful to the company Toledo do Brasil
S.A. for their support with the standard
weights.
REFERENCES
ALLEN, R. G.; FISHER, D.K. Low-cost electronic weighing lysimeter.
Transactions of the ASAE, St. Joseph, v.
77, n. 6, p. 1823-1832, 1990.
ALLEN, R.G.; PEREIRA, L.S.; HOWELL, T.A.; JENSEN, M.E. Evapotranspiration information reporting: I. Factors governing measurement accuracy. Agricultural Water Management, Amsterdam, v. 98, n. 6, p.
899-920, 2011.
BURMAN, R. D.; POCHOP, L. O.
Evaporation, evapotranspiration, and climatic data. Amsterdam: Elsevier, 1994.
(Developments in Atmospheric Science, 22). 302p.
BOYLESTED, R.; NASHELSKY, L.
Dispositivos eletrônicos e teoria de circuitos. Rio de Janeiro: Prentice-Hall do
Brasil, 1994. 670p.
CAMPECHE, L.F.M. de S.; AGUIAR NETTO, A. de O.; SOUSA, I.F.;
FACCIOLI, G.G.; SILVA, V. de P.R. da; AZEVEDO, P.V. de. Lisímetro de pesagem de grande porte. Parte I: Desenvolvimento e calibração. Revista
Brasileira de Engenharia Agrícola e Ambiental, Campina Grande, v. 15, n. 5,
p. 519-525, 2011.
CLAWSON, E.L.; HRIBAL, S.A.; PICCINI, G.; HUTCHINSON, R.L.; ROHLI, R.V.; THOMAS, D.L. Weighing lysimeters for evapotranspiration research on clay soil. Agronomy Journal,
Madison, v.101, n.2, p.836-840. 2009. DUGAS, W.A.; UPCHURCH, D.R.; RITCHIE, J.T. A weighing lysimeter for evapotranspiration and root measurements.
Agronomy Journal, Madison, v. 77, n. 5,
p. 821-825, 1985.
HOWELL, T.A.; SCHNEIDER, A.D.; DUSEK, D.A.; MAREK, T.H.; STEINER, J.L. Calibration and scale performance of Bushland weighing lysimeters.
Transactions of the ASAE, St. Joseph, v.
38, n. 4, p. 1019-1024, 1995.
HOWELL, T.A.; SCHNEIDER, A.D.; JENSEN, M.E. History of lysimeter design and use for evapotranspiration measurements. In: Allen, R.G.; Howell, T.A.; Pruitt, W.O.; Walter, I.; Jensen, M.E.
(eds.) Lysimeters for
Evapotranspiration and Environmental Measurements, International Symposium
on Lysimetry, 1., 1991. Honolulu.
Proceedings… Honolulu: American
Society of Civil Engineering, 1991. p. 1-9. LASCANO, R. J.; van BAVEL, C. H. M. Simulation and measurement of
evaporation from a bare soil. Soil Science
Society of America Journal, Madison, v.
50, n. 5, p. 1127-1133, 1986.
LIU, C.; ZHANG, X.; ZHANG, Y. Determination of daily evaporation and evapotranspiration of winter wheat and
maize by large-scale weighing lysimeter and micro-lysimeter. Agricultural and
Forest Meteorology, Amsterdam, v. 111,
p. 109-120, 2002.
MALONE, R.W.; BONTA, J.V.; STEWARDSON, D.J.; NELSEN, T. Error analysis and quality improvement of the Coshocton weighing lysimeters.
Transactions of the ASABE, St. Joseph,
v. 43, n. 2, p. 271-280, 2000.
MAREK, T.; PICCINNI, G.; SCHENEIDER, A.; HOWELL, T.A.; JETT, M.; DUSEK, D. Weighing lysimeters for the determination of crop water requirements and crop coefficients.
Applied Engineering in Agriculture, St.
Joseph, v. 22, n. 6, p. 851-856, 2006. MARTIN, E.C.; OLIVEIRA, A.S. de; FOLTA, A.D.; PEGELOW, E.J.; SLACK, D.C. Development and testing of a small weighable lysimeter system to assess water use by shallow-rooted crops. Transactions
of the ASAE, St. Joseph, v. 44, n. 1, p.
71-78, 2001.
MESHKAT, M.; WARNER, R.C.; WALTON, L.R. Lysimeter design, construction, and instrumentation for assessing evaporation from large undisturbed soil monolith. Applied Engineering in Agriculture, St. Joseph,
v. 15, n. 4, p. 303-308, 1999.
PAYERO, J.O.; IRMAK, S. Construction, installation, and performance of two repacked weighing lysimeters. Irrigation
Science, Heidelberg, v. 26, p. 191-202,
2008.
TOLK, J.A., HOWELL, T.A.; EVETT, S.R. An evapotranspiration research facility for soil-plant-environment interactions. Applied Engineering in
Agriculture, St. Joseph, v. 21, n. 6, p.
993-998, 2005.
WAUGH, W.J., THIEDE, M. E., CADWELL, L. L., GEE, G. W., FREEMAN, H. D., SACKSCHEWSKY, M. R., RELYEA, J. F. Small lysimeters for documenting arid site water balance. In: Allen, R.G.; Howell, T.A.; Pruitt, W.O.; Walter, I.; Jensen, M.E. (eds.) Lysimeters
for Evapotranspiration and
Environmental Measurements,
International Symposium on Lysimetry, 1., 1991. Honolulu. Proceedings… Honolulu: American Society of Civil Engineering, 1991. p. 151-159.
WHEELER, A. J.; GANJI, A. R.
Introduction to engineering
experimentation. New Jersey: Prentice
Hall, 1996.
WRIGHT, J. L. Using weighing lysimeters to develop evapotranspiration crop coefficients. In: Allen, R.G.; Howell, T.A.; Pruitt, W.O.; Walter, I.; Jensen, M.E.
(eds.) Lysimeters for
Evapotranspiration and Environmental Measurements, International Symposium
on Lysimetry, 1., 1991. Honolulu.
Proceedings… Honolulu: American
Society of Civil Engineering, 1991. p. 191-199.