BRAZILIAN JOURNAL OF INTRUMENTATION AND CONTROL
DOI: 10.3895/S2318-45312013000100002 ISSN: 2318-4531
Abstract — This work focuses basically on the design and analysis of simple and low cost hardware systems efficiency for temperature measurement in agricultural area. The main objective is to prove quantitatively, through statistical data analysis, to what extent a simple hardware designed with inexpensive components can be used safely in the indoor temperature measurement in farm buildings, such as greenhouses, warehouse or silos. To verify the of simple hardware efficiency, its data were compared with data from measurements with a high performance LabVIEW platform. This work proved that a simple hardware based on a microcontroller and the LM35 sensor can perform well. It presented a good accuracy but a relatively low precision that can be improved when performed some consecutive signal sampling and then used its average value. Although there are many papers that explain these components, this work has the distinction of presenting a data analysis in numerical form and using high performance systems to ensure critical data comparison.
Index Terms — Temperature measurement, sensor, Microcontroller.
I. INTRODUCTION
EMPERATURE is a physical factor that influences directly the agriculture, with effects on several parameters such as the planting time and growth, soil nutrients absorption,
J. E. M. Perea Martins, São Paulo State University (UNESP), Computer Science Department, College of Sciences, Bauru-SP, Brazil ([email protected]).
D. S. Voltan, São Paulo State University (UNESP), Rural Engineering Department, College of Agricultural Sciences, Botucatu-SP, Brazil ([email protected]).
R. Z. Barbosa, São Paulo State University (UNESP), Rural Engineering Department, College of Agricultural Sciences, Botucatu-SP, Brazil ([email protected]).
irrigation, greenhouse design, storing, and power consumption. All these factors justify efforts to determine the real efficiency of temperature measurement techniques for applications in the agricultural area. There are different ways to measure the temperature, as thermocouples, resistance temperature and integrated (solid-state) temperature sensor. However this work focuses on the LM35 sensor that is integrated sensor and has important advantages over other sensor types, as low cost, high accuracy, linear output signal, small size, calibration, reliability, easy interfacing with data loggers, and low power consumption. Basic LM35 versions measures temperature up to 100°C that is satisfactory for usual measurements in agriculture [1] and [2]. Currently there are sensors integrated with better performance, as the DS18B20 that has a resolution capable of performing sensing in increments of 0.0625°C; however the LM35 is still cheaper and easier to find on the market. In fact, the literature review shows that the temperature sensor LM35 and microcontrollers are widely used in projects in agricultural and environmental areas, which justifies a more detailed analysis of these devices. [3] and [4] analyzed different temperature sensors, as thermistor, thermocouple and LM35 and highlighted the LM35 efficiency. [5] studied the LM35 and microcontrollers for development of devices related to energy consumption monitoring and shoed their potential for management energy systems in agriculture. This focus is also highlighted by [6] which show an application based on the LM35 and a PIC in irrigation area. Another LM35 interesting agricultural application is in the monitoring of soil temperature shown by [7] and [8] which proves that the sensor does not lose its performance due to external protections and connections. Note that, in spite of the microcontrollers efficiency, there are works that seek alternative solutions, such as [9] that uses the LM35 but replace the microcontroller by the ADT14 that is a programmable integrated circuit for temperature control,
Analysis of Simple Hardware Efficiency for
Temperature Measurement in Agriculture and
Environment
João E. M. Perea Martins, Diego S. Voltan, Rogério Z. Barbosa
____________________________________________________________________________
BRAZILIAN JOURNAL OF INTRUMENTATION AND CONTROL however the microcontrollers remain inexpensive, efficient and flexible to improvements in specific project.
[10] Investigated the LM35 for temperature measurement and control in fluid flow experiments and verified that it has a very good linearity. They also verified a higher accuracy that might be achieved with additional calibrations. Besides, [11] and [1] emphasize that the LM35 calibration is not complex and [4] verified that different LM35 sensor devices presented a similar operational behavior with good stability. [12] used the LM35 with a microcontroller to control a solar heating water system of a tank with 300 liters that can be useful for urban agriculture irrigation. [2] Prove the efficiency of a microcontroller to sensing and recording of several parameters in cropped fields, whose temperature measurement used the LM35.
An important factor in research about temperature measurement is the distance between the sensor and the data acquisition device. Some studies use technologies as GSM for this purpose [8] and [13], but [14] presents an analysis about these technologies and emphasize the use of simpler and cheaper modules of radio transmission.
The scenario above proves the LM35 and microcontrollers are a concrete option for temperature measurement systems in agriculture; however, there is a lack of detailed studies about the LM35 sensor behavior and its interfacing with analog to digital converters of microcontrollers, which is the focus of the present work. Based on these discussions, this paper presents an analysis of temperature measurement using a microcontroller for data acquisition and sensor connections with long metal cable and wireless system.
II. MATERIALS AND METHODS
This work methodology can be summarized as the analysis of the LM35 temperature sensor output signal and the analysis of a low cost data acquisition system designed with the microcontroller PIC16F873. Both are electronic components very popular and known, and, besides, they present a theoretical good performance, low cost and easily to be found on the market. Despite technological advances associated with other electronics devices, the facts above justify designs with these components, and, besides, they also have motivated research to verify more critically their real performance and potential for use in projects that require low cost and reliability.
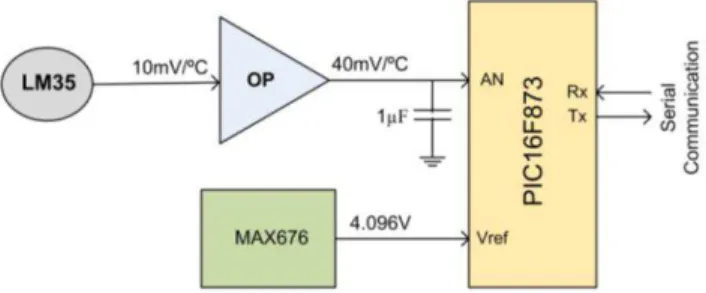
Fig. 1 shows the generic architecture of the simple and low cost hardware systems designed in this work for temperature measurement. It is based on a microcontroller PIC16F873, a LM35 sensor, a reference voltage source model MAX676 and a commercial TTL/USB converter for data serial transference to a computer, which is used only in the period of data transference. In this work, this hardware is called “hardware for temperature measurement” or simply “HTM”.
The LM35 works in centigrade degrees with a linear output signal. Its resolution is 10mV/°C and it does not require any external calibration to provide an accuracy of 0.5°C at +25°C. In fact, the accuracy is ±¾°C, over a full temperature range
from -55 to +150; however its typical value is ±¼°C at room temperature. It operates with a power source from 4 to 30 Volts with 60uA of current drain and self-heating less than 0.1°C in still air. Note that the maximum operational LM35 range varies from 100ºC to 150ºC, according to the sensor model.
Fig. 1. Architecture of the system designed for temperature measurement based on simple and low cost devices. It is called HTM, in this work.
The microcontroller PIC16F873 has interesting features, such as low power consumption smaller than 1 µA for typical standby operation. watchdog timer with its own on-chip oscillator for reliable operation, low power and high speed Flash/EEPROM internal memories and data communication with Universal Synchronous Asynchronous Receiver Transmitter (USART) standard. In fact, this work chooses this device because it is inexpensive and has Analog-to-Digital (ADC) converter with 10 bits of resolution (Rb) which includes four input channels with one input for external voltage reference input. This work used an positive external reference voltage (Vref) provided by the MAX676 integrated circuit that provides a precise output voltage of 4.096V from a power source of 5V (±5%) with typical output voltage drift smaller than 1ppm/°C. It means that the ADC input voltage resolution (R) is 4mV, computed from the equation:
R = Vref / 2Rb (1)
The smallest input voltage measured by the ADC is 4mv and it corresponds to 0.4ºC due to the LM35 resolution of 10mV/ºC. However, to provide a better relation between the sensor output signal and the ADC input resolution, the LM35 output signal was amplified four times and it means that the amplifier output signal represents a sensing resolution of 40mV/°C. The ADC input resolution is 4mV and, therefore, it can recognize signals proportional to thermal variations of 0,1°C into a range from 0°C to 102,4°C. The amplifier design is a simple electronic circuit designed with the traditional LM324 operational amplifier.
Firstly, this work analyzed the LM35 output signal with a LabVIEW platform with a data acquisition hardware systems (DAQ) model USB-6221 that has a 16 bits ADC. This experiment goal was to verify the LM35 behavior, including its stability, precision and accuracy. Later, this work verified the MAX676 performance with the LabVIEW and finally it verified the PIC16F628 ADC conversion performance for temperature measurement.
BRAZILIAN JOURNAL OF INTRUMENTATION AND CONTROL
DOI: 10.3895/S2318-45312013000100002 ISSN: 2318-4531
statistical analyses that include the mean value (µ), standard deviation (), coefficient of variation (Cv) expressed as percentage, maximum value (Max), and the minimum value (Min). Thus, the LM35 output signal analysis was based on a statistical analysis. Note that a coefficient of variation can be associated with the precision and the analysis of absolute extreme values can determinate the occurrence of rare events.
III. RESULTS AND DISCUSSIONS
The USB6221 system sampled 1000 output voltage signals from the sensor with intervals of 100ms with room temperature at 21.5ºC. This period was chosen because it is too short to admit significant variations of the room temperature and, besides, it is coherent for successive data conversions when the measurement is done with microcontroller and the average value may be desirable in some cases.
Table 1 shows the statistical values computed with the experiment. The coefficient of variation was smaller than 1.4% in all experiments, indicating that the sensor has a good precision.
TABLEI
STATISTICAL VALUES COMPUTED WITH THE LM35 OUTPUT SIGNAL (VOLTS)
FOR10 EXPERIMENTS.EACH EXPERIMENT SAMPLED 1000 SIGNALS WITH INTERVAL OF 100MS.
Experiment µ Cv (%) Max. Min. 1 0.2183 0.0026 1.1910 0.2269 0.2092 2 0.2185 0.0025 1.1442 0.2283 0.2115 3 0.2185 0.0026 1.1899 0.2275 0.2079 4 0.2186 0.0026 1.1894 0.2270 0.2102 5 0.2185 0.0027 1.2357 0.2283 0.2103 6 0.2185 0.0025 1.1442 0.2288 0.2099 7 0.2187 0.0026 1.1888 0.2275 0.2097 8 0.2187 0.0026 1.1888 0.2278 0.2107 9 0.2187 0.0026 1.1888 0.2282 0.2107 10 0.2187 0.0025 1.1431 0.2286 0.2107
Fig. 2 exemplifies details of the temperature variations in four experiments where temperature was measure with intervals of 100ms during only one second. It is important to demonstrate the output signal behavior and successive variations. The graph shows that most signals are in a range accuracy of about 0.5ºC, which is the value specified by the manufacturer; however, it is possible to observe extreme peaks of variation above the specified value. Nevertheless, the data in Table I show the use of an average value may significantly mitigate this problem.
Fig. 3 shows that, for a more detailed analysis, six LM35 sensors were conditioned into an enclosure box of Styrofoam (polystyrene foam) that exhibits characteristics of low thermal conductivity and stability. It prevents the sensors from the influence of undesired factors as unexpected movement of persons or airflow that could cause abrupt and momentary variations in the room temperature. If the room temperature is known and it is fixed or has only slight variations the sensor accuracy variation is easier to be computed. On top of the enclosure box was made a circular passage with a diameter of about 2 mm for passing only the wire connections between the LabVIEW interface and the sensor LM35 sensors.
Fig. 2. The LM35 output signal variation in four different experiments.
Fig. 3. Six LM35 sensors inside an enclosure box (left) to avoid an undesired influence of external factor on the temperature measurement.
Fig. 4 shows the output signal variation for six LM35 sensors, for a period of one hour with measurements at intervals of 100ms. The initial temperature was 18.8 °C and it was decreased to 18.5 °C at end of period. All the sensors showed the same output signal behavior during the measurement period, with an output signal proportional to the room temperature.
BRAZILIAN JOURNAL OF INTRUMENTATION AND CONTROL Table 2 shows the statistical analysis for teen repetitions of the experiment above.
TABLEII
STATISTICAL ANALYSIS RESULTS FOR 10 REPETITIONS OF THE EXPERIMENT THAT MEASURED THE LM35T OUTPUT SIGNAL DURING ONE HOUR.
S1 S2 S3 S4 S5 S6 M St CV(%)
1 0.2372 0.2344 0.2366 0.2402 0.2419 0.2389 0.238 0.00246 1.03 2 0.2373 0.2344 0.2367 0.2403 0.2420 0.2390 0.238 0.00248 1.04 3 0.2372 0.2342 0.2367 0.2403 0.2420 0.2390 0.238 0.00254 1.07 4 0.2374 0.2345 0.2367 0.2404 0.2420 0.2390 0.238 0.00246 1.03 5 0.2374 0.2346 0.2368 0.2404 0.2421 0.2390 0.238 0.00245 1.03 6 0.2375 0.2344 0.2368 0.2404 0.2421 0.2390 0.238 0.00250 1.05 7 0.2375 0.2347 0.2370 0.2403 0.2422 0.2391 0.238 0.00241 1.01 8 0.2377 0.2348 0.2368 0.2404 0.2421 0.2391 0.238 0.00239 1.00 9 0.2376 0.2346 0.2365 0.2404 0.2420 0.2390 0.238 0.00245 1.03 10 0.2378 0.2350 0.2369 0.2405 0.2420 0.2391 0.239 0.00231 0.97
The temperature decreased 0.3ºC during the experiment and it could compromise the sensor precision analysis due to a mathematical standard deviation increase. However, even so, the coefficient of variation value was about 1.0%, which demonstrates the good sensor accuracy.
In this work, the electronic circuit shown in Fig. 1 was mounted directly on a protoboard for test and performance verification. It was done intentionally on a protoboard because it is an aggressive environment of work and more susceptible to noise and grounding problems. This is the worst physical case for circuit assembling and, therefore, it is expected a performance improvement when the circuit will be mounted on a printed circuit board specially designed for this purpose.
Fig. 5 shows the reference voltage schematics based on the MAX676. This work verified that the capacitor (C2) of 10nF is a critical component, whose absence or variation affects significantly the output signal level and accuracy.
Fig. 5. The MAX676 schematics.
Table 3 shows the statistical analyses of the MAX676 output voltage variation. This analysis was based on 10.000 samples from the MAX676 output reference voltage, sampled with intervals of 100ms. The small coefficient of variation of 0.014% proves that the MAX676 has a good precision. Besides, the maximum difference between the extreme values is less than 5mV, which represents a variation of only 0.11% of the expected output value of 4.096V and it means that the voltage reference device is accurate. Therefore, this work verified and proved the good precision and accuracy level of this voltage reference source.
The operational amplifier (OP) circuit shown in Fig. 1 is a simple and traditional amplifier circuit designed with the LM324 operational amplifier that amplifies four times the
LM35 output signal to provide a sensing system resolution of 40mV/ºC.
TABLEIII
STATISTICAL ANALYSES OF THE MAX676 OUTPUT SIGNAL VALUES.
Statistic Value
µ 4.0965
0.000565
Cv(%) 0.014%
Min 4.09434
Max 4.09904
Max-Min 0.00470
The OP offset was analyzed by connecting its input pin to the ground and measuring its output signal with room temperature at 21ºC. The operational amplifier circuit also was intentionally mounted on a protoboard to force a critical environment of operation that could introduce more error than the expected. Table 4 shows the statistical analyses of this experiment, where the amplifier circuit was designed without any offset compensation. The analysis was based on the measurement of 1000 voltage with intervals of 100ms. In this case, the output signal varied into a range from 0V to 12mV with a mean value of 2.5mV. The statistical analyses showed a large standard deviation when compared to the mean value and it indicates an imprecise behavior that was expected due to the intentional aggressive environment with a protoboard and without offset compensation.
TABLEIV
STATISTICAL ANALYSIS OF THE OPERATIONAL AMPLIFIER OFFSET VOLTAGE.
Statistic Offset
µ 0.0025
0.0039
Cv(%) 156
Min 0
Max 0.0120
Fig. 6 shows the offset voltage values histogram. Note that, in spite of the maximum relative high offset voltage of 12mV, the measured output signals histogram concentrates 70% of the voltage values into a range smaller than 1mV, however, these values could still be reduced with offset adjusts circuit and the circuit assembling on a printed circuit board (PCB).
BRAZILIAN JOURNAL OF INTRUMENTATION AND CONTROL
DOI: 10.3895/S2318-45312013000100002 ISSN: 2318-4531
The first ADC analysis was based on a voltage divider whose output voltage was connected to the PI16F873 ADC. The voltage signal was measured simultaneously with the PIC and the LabVIEW hardware and both values were later compared as a way to verify the microcontroller ADC performance. The microcontroller ADC resolution is 10 bit and the LabVIEW resolution is 16 bits and it ensures to the LabVIEW a more precise measurement that will be represented by a small coefficient of variation. In this experiment the reference voltage was 4.096V from the MAX676, but the input signal was not amplified.
Table 5 shows the statistical analyses for six input voltage levels. Each was measured 1000 times sequentially with intervals of 100ms. The coefficient of variation of the ADC is up to 42 times greater than the coefficient of variation of the LabVIEW data that was expected due to the higher resolution of the LabVIEW converter.
The microcontroller ADC has a good precision that is proved with the coefficient of variation whose value is 4.0% for an input voltage of 0.1V but decreases to 0.13% for 4.0V of input voltage. Note that, for an input voltage from 0.4V to 1.6V the Cv varies from 1.3% to 0.33%. It is equivalent to the measurement of a temperature from 10ºC to 40ºC due to the sensing system resolution of 40mV/ºC and it means that the system is satisfactory for usual measurement of environmental temperature in tropical countries.
TABLEV
STATISTICAL ANALYSIS OF SIX INPUT VOLTAGE LEVELS
D
value PIC Measurement LABVIEW Measurement Input (V) µp Cv(%) µb Cv(%)
0.1 0.1013 0.0041 4.0474 0.1018 0.000399 0.392 0.4 0.4015 0.0053 1.3200 0.4005 0.000183 0.046 0.8 0.8022 0.0047 0.5859 0.7997 0.000124 0.016 1.6 1.5966 0.0053 0.3320 1.5923 0.000125 0.008 3.2 3.1961 0.0044 0.1377 3.1840 0.001310 0.041 4.0 3.9931 0.0053 0.1327 3.9873 0.001649 0.041
Table 6 shows the absolute difference (Af) between both mean values for each input voltage level, computed with variables from Table 5 as |µb-µp|, and the relative difference (Rd) that is the percentage of Af in relation to the LabView measurement. The Rd value is smaller than 0.5% for all cases and it proves that the microcontroller ADC has a very good accuracy.
TABLEVI
COMPARISON BETWEEN THE MEAN VALUES OF THE MEASUREMENTS WITH THE PC AND LABVIEW.
Input (V) Af (V) Rd (%)
0.1 0.0005 0.4912
0.4 0.0010 0.2497
0.8 0.0025 0.3126
1.6 0.0043 0.2700
3.2 0.0121 0.3800
4.0 0.0058 0.1455
A. Data acquisition with a long cable
Fig. 7 shows that , in this work, the LM35 sensor was also connected to a 10m cable length and its signal was sent simultaneously to the PIC and the LabVIEW. The objective was to analyze the long cable influence over the temperature measurement, which can be very useful for measurements inside greenhouses.
Fig. 7. The LM35 connection through a 10m cable length.
Table 7 shows the statistical analysis 1000 consecutive measurements simultaneously at intervals of 100ms with the HTM and the LabVIEW. The mean value difference is very small, however the coefficient of variation is greater and it suggest a more detailed analysis.
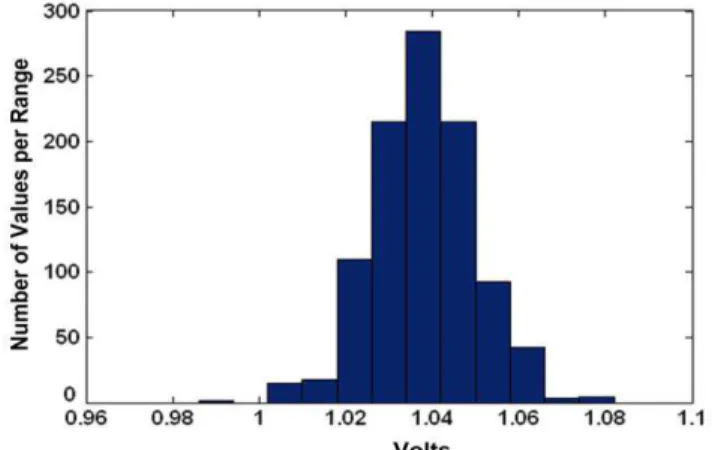
Fig. 8 shows the measurement values of the HTM and the LabVIEW through a 10 meter cable connected to the LM35. In spite of the small difference between the mean values that is about 0.17%. Fig. 8 shows that the LM35 presents a worst precision. In this case, the HTM measurement values are always in a range between 0.9880V and 1.0800V, which may represent a difference up to 0.0502V relative to medium value, which represents a possible error up to 1.3ºC. Note that, in spite of this problem, the mean value is very good when compared to the LabVIEW mean value. Therefore, this error level can occurs if there will be only one input data acquisition, but this problem can be decreased if instead of a single signal measurement, there will be measured some consecutive signals and used the average value. Fig. 9 shows distribution computed with the signals level measured with HTM. It composes a Normal distribution and proves that a means value for some samples can be an interesting way to improve the measurement. Assuming the first interval of confidence as a maximum acceptable variation and the sensing system resolution is 40mV/ºC, it means that there will be about 31.7% of probability to occur an error greater than 0.62ºC for only measurement, but the probability to have four connectives measurement in this greatness is only 1.0%.
TABLEVII
MEASUREMENT OF 1000 VOLTAGE SIGNALS FROM THE
LM35 THROUGH A 10M CABLE LENGTH.
Statistic PIC LabView
µ 1.0382 1.036489
0.0124 0.002204
Cv(%) 1.20 0.21
Min 0.9880 1.032625
BRAZILIAN JOURNAL OF INTRUMENTATION AND CONTROL
Fig. 8. HTM and LabView measurements variation. The HTM measurements show a lager variation range.
Fig. 9. Histogram of the voltage values measured with the HTM. Each 0.02V represents a temperature variation of 0.5ºC.
This work also analyzed the use of telemetry to thermal measurement. Fig. 10 shows the electric schematic of the transmission module comprising a temperature sensor LM35, an operational amplifier, a PIC microcontroller 16F873A, and a module of radio transceiver model BIM2 433-160. The radio module can be configured to operate as either transmitter or receiver by simply connecting of two control pins to Vcc or ground.
Fig. 10. Telemetry schematic circuit based on the radio module model BIM2-433-160.
To evaluate the data transmission system has been developed software that can be configured to operate as either a transmitter or receiver. It was developed to verify the radio module performance. As a transmitter, the software sends
1000 data packets via the radio module. The receiver module performs the reception and then checked if there were transmission errors. Each data packet has a fixed contend with size of 38 bytes that would be enough to compose more complex information, including information such as date, time and location of the measurement. The test was performed with a transmission data rate of 14,400 bits per second (bps), that is a intermediate bps value. The test shown that radio module presented, in this experiment, a range of 120 meters. The test experiment was repeated 10 times to enable a statistical analysis. Fig. 11 shows the number of packets transited with errors in each experiment repetition. The maximum relative number of transmitted packet with errors was 0.8% that can be considered satisfactory.
Fig. 11. Number of packet with transmission errors in 10 experiments of data packet transmission.
IV. CONCLUSION
This article has shown the development and analysis of a simple and low-cost temperature monitoring hardware system. It proved that the sensor LM35 and the PIC16F628 analog to digital converter have good accuracy and the measurement of these components can be done safely through a 10m cable length. The work also shows that thermal measurement can become very efficient if done some consecutives data acquisition and then used the average value of sampling. The wireless system showed a small level of errors and proved its potential for data transmission in agricultural area.
REFERENCES
[1] C. Liu, W. Ren, B. Zhang, C. Lv, “The application of soil temperature
measurement by LM35 temperature sensors” in Proceedings of the IEEE
International Conference on Electronic & Mechanical Engineering and Information Technology, Harbin, China, pp. 1825-1828, Aug. 2011.
[2] D. K. Fisher and H. Kebene, “A low-cost microcontroller-based system to
monitor crop temperature and water status” in Computers and Electronics
in Agriculture, vol. 1, no. 74, pp.168-173, jul. 2010.
[3] A. Balraj, A. Patvardhan, V. Renuka Devi, R. Aiswarya, V. Prasen,
“Embedded temperature monitoring and control unit” Proceedings of the
IEEE International Conference on Recent Trends in Information, Telecommunication and Computing, Kochi, India, pp. 293-297, Mar.
2010.
[4] J. Liu, L. Ma and J. Yang, “Methods and techniques of temperature
BRAZILIAN JOURNAL OF INTRUMENTATION AND CONTROL
DOI: 10.3895/S2318-45312013000100002 ISSN: 2318-4531
Electrical and Control Engineering (ICECE), Yichang, China, pp.
5332-5334, Sept. 2011.
[5] S. M. M. R. A.l-Arif, K. M. Kadir, M. A. Morshed, A. H. M. I. Ferdous,
M. M. Alam, M. S. Haque, “Energy saving by limiting standby power
loss and using smart power control” Proceedings of the IEEE
International Conference on Information Management, Innovation Management and Industrial Engineering, Shenzhen, China, pp. 496-499,
Nov. 2011.
[6] M. L. Luciana, B. Ramya, A. Srimathi, “Automatic drip irrigation unit
using Pic controller” in International Journal of Latest Trends in
Engineering and Technology, vol. 2, no.3, pp. 108-114, may 2013.
[7] A. V. Cracium, F. Sandu, G. Pana, “Monitoring of a ground source heat
pump with horizontal collectors” Proceedings of the IEEE 12th
International Conference on Optimization of Electrical and Electronic,
Basov, Romanian, pp. 1230-1235, May 2010.
[8] J. S. Sharma, G. D. Makana, “Intelligent crop management system for
greenhouse environment” in International Journal of Science and
Research, vol. 2, no. 4, pp. 205-208, apr. 2013.
[9] W. Li, Q. Luo, Z. Li, Y. Li, “The design and implementation of a low
cost temperature control system for agriculture greenhouses” Proceedings
of the IEEE International Conference on Energy and Environmental
Technology, Guilin, China, pp. 399-401, Oct. 2009
[10] A. Dumcius, V. Augutis and D. Gailius, “Control of the temperature in
the fluid flow by semiconductor sensors” in Electronics and Electrical Engeneering, vol. 87, no. 7, pp. 27-30, Feb.2008.
[11] A. Goswami, T. Bezboruah and K. C. Sarma, “An embedded design for
monitoring and controlling temperature” in Indian J. Phys., vol. 1, no. 84,
pp. 71-79, Sept. 2009.
[12] M. R. Hasan, K. Arifin, A. Rahman, A. Azad, “Design, implementation
and performance of a controller for uninterruptible solar hot water
system” Proceedings of the 18th International Conference on Industrial
Engineering and Engineering Management (IE&EM), Beijing, China, pp.
584-588, Sept. 2011.
[13] T. D. Zope, A. S. Bhide, “Crop field monitoring using GSM” in
International Journal of Advance in Science and Engineering, vol. 1, no.
2, pp. 148-156, jun. 2013.
[14] P. K. Somasundaram, D. J. Ediosn, “Monitoring water quality using RF
module” in International Journal of Application or Innovation in