http://www.uem.br/acta ISSN printed: 1679-9275 ISSN on-line: 1807-8621
Doi: 10.4025/actasciagron.v36i3.17937
Mineralogy and phosphorus adsorption in soils of south and
central-west Brazil under conventional and no-tillage systems
Jessé Rodrigo Fink1, Alberto Vasconcellos Inda1*, Cimélio Bayer1, José Torrent2 and Vidal Barrón2
1
Departamento de Solos, Universidade Federal do Rio Grande do Sul, Av. Bento Gonçalves, 7712, Cx. Postal 15100, 97105-400, Porto Alegre, Rio Grande do Sul, Brazil. 2Departamento de Agronomía, Universidad de Córdoba, Córdoba, Spain. *Author for correspondence.
E-mail: alberto.inda@ufrgs.br
ABSTRACT. The low phosphorus availability in tropical and subtropical soils, normally related to
adsorption of phosphate to the minerals surfaces, can be attenuated when organic matter (OM) accumulates in the soils. Herein, we report the results of long-term experiments (18–32 years) aimed at quantifying the maximum phosphorus adsorption capacity (MPAC) and its determinant mineralogical variables in Brazilian soils and at assessing the effect of no-tillage (NT) in mitigating the phosphorus adsorption of soils. The MPAC of soils ranged from 297 to 4,561 mg kg-1 in the 0.00–0.10 m layer and
from 285 to 4,961 mg kg-1 in the 0.10–0.20 m layer. The MPAC was correlated with the concentrations of
iron oxides, goethite and ferrihydrite, gibbsite/(gibbsite+kaolinite) ratio and the specific surface area. The OM increased in the 0.00–0.10 m layer of NT soils, which was not reflected on the decrease of MPAC for the no-tillage soils.
Keywords: iron oxides, gibbsite, organic carbon, phosphate.
Mineralogia e adsorção de fósforo em solos sob preparo convencional e plantio direto nas
regiões sul e centro-oeste do Brasil
RESUMO. A baixa disponibilidade de fósforo em solos tropicais e subtropicais, normalmente relacionada à
adsorção de fosfato pelas superfícies minerais, pode ser atenuada quando matéria orgânica (MO) é acumulada nos solos. Em experimentos de longa duração (18-32 anos) em solos brasileiros, o estudo objetivou quantificar a capacidade máxima de adsorção de fósforo (CMAP) e as variáveis mineralógicas determinantes, bem como verificar o efeito do plantio direto em mitigar a adsorção de fósforo nos solos. A CMAP dos solos variou de 297 a 4.561 mg kg-1 na camada 0,00–0,10 m e de 285 a 4.961 mg kg-1 na
camada 0,10–0,20 m. A CMAP apresentou relação com a concentração de óxidos de ferro, de goethita e de ferrihydrita, com a razão gibbsita/(gibbsita+caulinita) e com a área superficial específica do solo. O conteúdo de MO aumentou na camada 0,00–0,10 m dos solos em plantio direto e não afetou a CMAP em comparação aos solos em sistema de preparo convencional.
Palavras-chave: óxidos de ferro, gibbsita, carbono orgânico, fosfato.
Introduction
Phosphorus is an essential plant nutrient that is usually present in forms of low availability in the highly weathered soils of tropical and subtropical regions from Brazil, a phenomenon that has been suggested as one of the main limiting factors for agricultural production (NOVAIS; SMYTH, 1999). This lack of available phosphorus mainly is attributed to its strong adsorption (this term is used for all forms of retention of the element) by mineral surfaces, making a part of the total phosphorus unavailable to plants (ALMEIDA et al., 2003; CESSA et al., 2009; JOHNSON; LOEPPERT, 2006).
The main minerals related to the adsorption of P in soils are iron (Fe) and aluminum (Al) oxides, which together with kaolinite, make up the
dominant mineralogy in the clay fraction of most soils in the southern (subtropical) and central-western (tropical) regions of Brazil (NITZSCHE et al., 2008; SCHAEFER et al., 2008). Hematite and goethite are the predominant pedogenic Fe oxides, followed by maghemite and ferrihydrite, and gibbsite is Al oxide. The concentrations of these minerals in the soil and characteristics such as crystallinity and specific surface area vary with the parent material, intensity of weathering, composition of the soil solution and drainage conditions (MOTTA; KÄMPF, 1992; SCHAEFER et al., 2008) and may also be affected by soil management systems (SILVA NETO et al., 2008).
Acta Scientiarum. Agronomy Maringá, v. 36, n. 3, p. 379-387, July-Sept., 2014 phosphorus adsorption capacity (MPAC), which can
be calculated by fitting the Langmuir equation, among others (OLSEN; WATANABE, 1957). Several studies have shown significant variations in the MPAC in well-drained soils with advanced weathering that are generally correlated with the crystalline phases of Fe and Al oxides (ALMEIDA et al., 2003; BARBIERI et al., 2009; BROGGI et al., 2010; CESSA et al., 2009; CURI; FRANZMEIER, 1984; FONTES; WEED, 1996; LAIR et al., 2009). Most authors have stressed that soils rich in goethite and gibbsite adsorb more P than those rich in hematite and kaolinite. Torrent et al. (1994), however, reported that the average P adsorption capacity per unit area is similar between goethite and hematite in soils and that the increased P adsorption in goethites is determined by structural features such as a larger specific surface area (SSA). Thus, the high SSA of poorly crystalline Fe oxides such as ferrihydrite, even in small concentrations in well-drained soils, may play a crucial role in P adsorption (JOHNSON; LOEPPERT, 2006; RANNO et al., 2007).
In addition to the mineralogical composition of the soil, attention has been focused on the role of organic matter (OM) in reducing P adsorption capacity and improving the availability of P for plants grown in a soil under a long-term conservation management system such as the no-tillage system (PAVINATO et al., 2009). Organic ligands in the soil solution compete with P for adsorption sites on the surface of minerals, thus are decreasing P adsorption by these minerals (LIU et al., 1999; MIKUTTA et al., 2006; SCHWERTMANN et al., 1986). However, there is no consensus on this issue, and some studies have failed to verify the ability of increased levels of organic C to reduce P adsorption (RANNO et al., 2007; RHEINHEIMER et al., 2003).
The objective of this study was to determine the MPAC in five highly weathered soils and to establish relationships with (i) the pedogenic Fe oxides content, (ii) the concentrations of specific phases of Fe oxides (goethite, hematite, maghemite and ferrihydrite), (iii) the proportions of gibbsite and kaolinite and (iv) the specific surface area of these soils. The ability of no-tillage system to reduce soil phosphorus adsorption in comparison with conventional tillage was also evaluated.
Material and methods
Description of sites and soil sampling
The study was based on five soils from different regions of Brazil (Table 1). Long-term experiments were conducted in these soils with successions and/or rotations of crops under conventional tillage (CT) and no-tillage (NT) systems. The experiments
were set up in a randomized block design with three replicates. In each experimental replicate of both tillage systems (CT and NT), the soil was sampled as follows: (i) at depths of 0.00 to 0.10 m and 0.10 to 0.20 m, for a total 60 soil samples, and (ii) in the 0.00–0.20 m layer, for a total of 30 soil samples. Soil samples representing native grassland conditions were collected in areas adjacent to the experimental field at depths of 0.00 to 0.20 m for particle size analysis and the determination of the mineralogical composition of the soil by X-ray diffraction. After air-dried and ground, soil samples were passed through a 2-mm sieve to obtain the air-dried fine soil (ADFS) fractions.
Physical analyses
Particle size analysis was performed using the pipette method after dispersion of the particles by ultrasound. For this purpose, 20 g ADFS samples from the 0.00–0.20 m layer of each soil were added into 100 mL centrifuge tubes containing 80 mL of distilled water, which were subjected to various levels of energy according to the soil (between 200 and 2,100 J mL-1) in a Vibracel ultrasound machine equipped with a 136 mm long × 13 mm diameter probe. To each soil, the energy required for the complete dispersion of soil primary particles was estimated from a previously determined calibration curve (NORTH, 1976). Having determined the soil particle size, the total clay fraction (Ø < 0.002 mm) of each soil sample was collected by sedimentation according to Stokes’s Law. The suspended clay was flocculated with 0.1 M HCl, washed with an ethanol/water solution (1:1) and dried at 50°C.
The specific surface area (SSA) of the ADFS samples of the 0.00–0.10 m and 0.10–0.20 m layers were estimated using the water adsorption method at 20% relative humidity (QUIRK, 1955).
X-ray diffraction analysis
The mineralogical composition of the total clay and iron oxide concentrate fractions at a depth of 0.00-0.20 m of the soils under native grassland was determined by X-ray diffraction (XRD) (Siemens D5000 diffractometer with CoKα radiation and a Fe filter). Analyses were conducted on non-oriented slides for the total clay fraction (at a 2θ range of 4−52°) and the iron oxide concentrate fraction (at a 2θ range 20−70°). Iron oxides were concentrated by treating the total clay
fraction with hot 5 mol L-1 NaOH (KÄMPF;
Table 1. Soil classes, locations, environmental characteristics, duration of the experiment and cropping system/crop rotation.
Mean annual Soil1 Location Parent material
Temperature Precipitation Duration of experiment Cropping system/ crop rotation
ºC mm years
Southern region
Ultic Hapludalf Santa Maria, RS Sandstone 18.8 1686 17 Summer: Corn/Soybeans Winter: Ryegrass/clover
Rhodic Paleudult Eldorado do Sul, RS Granite 19.2 1446 25 Summer: Corn/Cowpea Winter: Oats/Vetch
Humic Hapludox Guarapuava, PR Basalt 17.1 1941 32 Winter: Wheat/Vetch/Oats Summer: Soybeans/Corn central-west
Rhodic Hapludox Dourados, MS Basalt 22.2 1409 20 Summer: Soybeans Winter: Wheat
Typic Hapludox Luziânia, GO Basalt 21.2 1553 18 Soybean/Cotton Summer: Corn/
1Soil Survey Staff (2010).
Chemical analyses
The concentrations of extractable Ca+2, Mg+2, K+, Al+3, H+Al, pH and P were determined in the ADFS samples for the 0.00–0.20 m layer according to methods described by Embrapa (1997) and served as the basis for calculating the sum of bases (S), cation exchange capacity (CECpH7), base saturation (V) and aluminum saturation (m). The total organic carbon (organic C) contents in the ADFS samples of the 0.00–0.10 m and 0.10–0.20 m layers were determined by dry combustion in a carbon analyzer (Shimadzu VCSH).
Selective dissolutions of Fe oxides were prepared in the ADFS samples of the 0.00–0.10 m and 0.10– 0.20 m layers. The Fe in pedogenic Fe oxides (Fed) was extracted with dithionite-citrate-bicarbonate at 80°C (MEHRA; JACKSON, 1960). The Fe in Fe oxides of low crystallinity (basically ferrihydrite, Feo) was extracted using 0.2 mol L-1 ammonium oxalate at pH 3.0 in darkness (SCHWERTMANN, 1964). The levels of dissolved Fe were determined by atomic absorption spectroscopy (AAS).
The proportions of the different Fe oxides phases identified in the XRD analyses of the concentrated Fe oxides fraction were estimated from the areas of the 110 reflection plane of goethite (Gt-110), the 012 plane of hematite (Hm-012) and the 220 plane of maghemite (Mh-220) that were obtained using the Siemens DIFFRAC plus-EVA computer program. The Gt-110 reflection area was multiplied by 0.30 because the intensities of the Hm-012 and MH-220 reflections are 30% of the Gt-110 reflection intensity (ALMEIDA et al., 2003). The Al3+ substitution was estimated according to the regression Al(mol mol-1)=17.30-5.72c (Å) in goethite (SCHULZE, 1984), according to the regression Al(mol mol-1)=31.09-6.17a
0 (Å) in hematite (SCHWERTMANN et al., 1979) and according to the regression Al(mol mol-1)=37.54-4.50a
0 (Å) in the maghemite (SCHWERTMANN; FECHTER, 1984). The concentration of each Fe oxide specific phase was
obtained by allocation of the Fe content relative to the crystalline Fe oxides (Fed – Feo) according to their concentration in each soil and considering their chemical formulas. The gibbsite/(gibbsite + kaolinite) ratio, Gb/(Gb + Kt), was calculated from the diffraction patterns of non-oriented slides prepared from the clay total fraction according to the relationship between the intensity of the 002 reflection plane of gibbsite (IGb-002) and the 001 plane of kaolinite (IKt-001) (MOTTA; KÄMPF, 1992).
For the evaluation of P adsorption, 3.00-g ADFS samples were used, in duplicate, and each sample was equilibrated with 30 mL of KCl (0.02 mol L-1) containing doses of 30, 60, 120, 240, 480, 960 or 1,920 mg L-1 P for the Oxisols and 15, 30, 60, 120, 240, 480 or 960 mg L-1 P for the Alfisol and Ultisol. The suspension was shaken horizontally for 5h (Oxisols) or 2h (Alfisol and Ultisol) [these times were based on the observed time course of adsorption (data not shown)], and then left to rest for 20h before measuring the P content in the supernatant according to the method of Murphy and Riley (1962). The amount of P adsorbed by the sample was estimated using the difference between the added P and the amount in the supernatant. The maximum phosphorus adsorption capacity (MPAC) was obtained from the parameters of the fitted Langmuir equation
solution
solution max
adsorbed
P K 1
P P
K P
where:
Padsorbed is the P adsorbed in the sample, Psolution is the concentration in the solution, K is a constant related to the sorption energy, and Pmax is the maximum P adsorption capacity.
Data analysis
Acta Scientiarum. Agronomy Maringá, v. 36, n. 3, p. 379-387, July-Sept., 2014 Kolmogorov-Smirnov test for normality showed that
at the 5% level the parameters follow a normal distribution only within the soil classes. In this case, comparison of means were performed with Tukey test (α= 0.05). Spearman nonparametric correlations (rs) were obtained for parameters that were not normal distributed.
Results and discussion
Soil characteristics
The Alfisol and Ultisol developed from sandstone and granite, respectively, showed lower clay contents (≤ 228 g kg-1 of soil) than the Oxisols developed from basalt (clay ≥ 596 g kg-1 of soil) (Table 2).
The soil pH ranged from 4.8 to 5.2, with the exception of the Typic Hapludox, which exhibited pH values near 6.0. The pH reflected the levels of H+Al and Al saturation (m), and the Typic Hapludox had the lowest values for these parameters. The sum of bases (S) ranged from 2.96 to 9.79 cmolc kg-1 in the Ultic Hapludalf and Rhodic Hapludox soils, respectively, and Ca+2 was the
predominant cation. The CTCpH7 values ranged
from 7.3 cmolc kg-1 in the CT of Ultic Hapludalf to 16.6 cmolc kg-1 in the NT of Rhodic Hapludox, with base saturations (V) greater than 50% only in the Typic and Rhodic Hapludox soils. The levels of available P were higher in the NT than in the CT samples in three of the five soils, ranging from
9.5 mg kg-1 in the CT of Humic Hapludox to
59 mg kg-1 in the NT of Typic Hapludox.
The organic C content differed significantly among the soils (Figure 1) as the likely result of differences in clay content (Alfisol and Ultisol < Oxisols), mineralogy and pedoclimate that are known to affect the accumulation and stabilization of OM (Table 1). The significant effect of NT on the increase of organic C relative to CT was observed only in the 0.00–0.10 m layer in the
Rhodic Paleudult and Humic Hapludox. With the exception of the Typic Hapludox, the organic C content decreased with increasing depth in all soils subjected to NT; however, this effect was not observed under CT (Figure 1).
The SSA values in the soils ranged from 9.9 to 63.4 m2 g-1 in both the NT and CT samples (Table 3). The SSA tended to be greater in the NT- than in the CT-treated soils, probably because of the increase in organic C in the no-tilled surface soil layer. The positive relationship (p < 0.0001) between SSA, estimated by the water-adsorption method, and organic C content was in sharp contrast with the inverse relationships observed in several studies in which the SSA was estimated by N2 adsorption (AFIF et al., 1995; ALMEIDA et al., 2003). This discrepancy can be attributed to a more effective hindrance of N2 to enter pores or covering the mineral surface by associated with clay fraction than the polar water molecule, thus difficulting the access and covering of the mineral surfaces (ALMEIDA et al., 2003).
Figure 1. Total organic carbon contents in the layers of each
soil under both management systems (uppercase letters refer to the comparison of management systems at the depth of 0.00– 0.10 m; lowercase letters refer to comparisons between depths with the same management system – Tukey’s test at the 5% level).
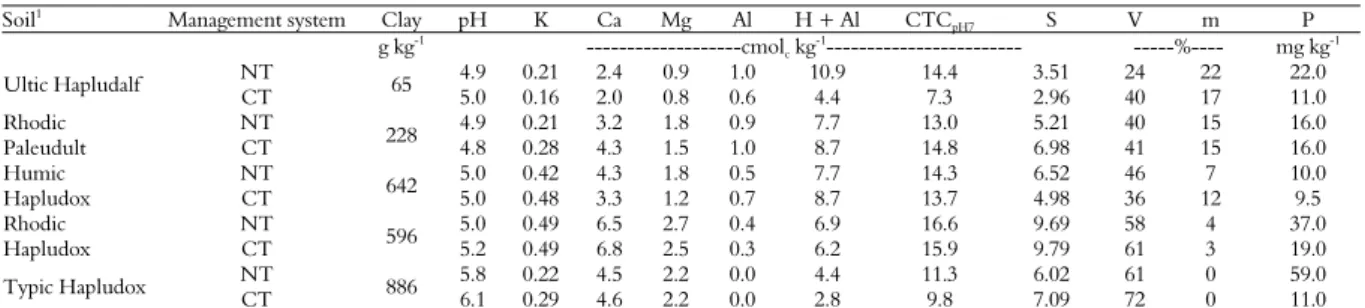
Table 2. Clay contents and characteristics of the adsorptive complexes of soils in the 0.00–0.20 m layer.
Soil1 Management system Clay pH K Ca Mg Al H + Al CTC
pH7 S V m P
g kg-1 ---cmol
c kg-1--- ---%---- mg kg-1
NT 4.9 0.21 2.4 0.9 1.0 10.9 14.4 3.51 24 22 22.0 Ultic Hapludalf CT 65 5.0 0.16 2.0 0.8 0.6 4.4 7.3 2.96 40 17 11.0 NT 4.9 0.21 3.2 1.8 0.9 7.7 13.0 5.21 40 15 16.0 Rhodic
Paleudult CT 228 4.8 0.28 4.3 1.5 1.0 8.7 14.8 6.98 41 15 16.0 NT 5.0 0.42 4.3 1.8 0.5 7.7 14.3 6.52 46 7 10.0 Humic
Hapludox CT 642 5.0 0.48 3.3 1.2 0.7 8.7 13.7 4.98 36 12 9.5 NT 5.0 0.49 6.5 2.7 0.4 6.9 16.6 9.69 58 4 37.0 Rhodic
Hapludox CT 596 5.2 0.49 6.8 2.5 0.3 6.2 15.9 9.79 61 3 19.0 NT 5.8 0.22 4.5 2.2 0.0 4.4 11.3 6.02 61 0 59.0 Typic Hapludox CT 886 6.1 0.29 4.6 2.2 0.0 2.8 9.8 7.09 72 0 11.0
Table 3. Fe contents in pedogenic Fe oxides, concentrations of Fe oxides specific phases, mineralogical attributes and specific surface area of the soils.
Fed Ferrihydrite Goethite Hematite Maghemite
Soil1 Depth
NT CT NT CT NT CT NT CT NT CT
--m-- ---g kg-1---
0.00–0.10 8.2 7.8 1.2 1.2 7.2 6.8 4.3 4.1 0.0 0.0 Ultic Hapludalf 0.10–0.20 8.2 7.6 1.2 1.1 7.2 6.6 4.3 4.0 0.0 0.0
0.00–0.10 12.1 bB 13.5 bA 2.1 2.2 4.8 bB 5.4 bA 11.2 bB 12.6 bA 0.0 0.0 Rhodic Paleudult 0.10–0.20 13.8 a 14.3 a 2.0 2.2 5.6 a 5.8 a 13.0 a 13.4 a 0.0 0.0
0.00–0.10 101.5 104.7 6.4 5.4 115.0 119.5 36.3 37.8 0.0 0.0 Humic Hapludox 0.10–0.20 101.6 106.3 6.5 5.7 115.1 121.2 36.4 38.3 0.0 0.0
0.00–0.10 115.9 120.3 3.5 B 5.5 A 5.4 5.6 97.7 100.5 60.2 62.0 Rhodic Hapludox 0.10–0.20 117.1 120.2 3.7 B 5.2 A 5.5 5.6 98.6 100.5 60.8 62.0
0.00–0.10 34.3 34.4 6.6 6.3 37.8 38.2 9.6 9.7 0.0 0.0 Typic Hapludox 0.10–0.20 36.1 33.9 6.3 6.1 40.2 37.6 10.2 9.5 0.0 0.0
Feox/Fed Gt/(Gt+Hm) Gb/(Gb+Ct) SSA
Soil1 Depth
NT CT NT CT
--m-- ---m2 g-1---
0.00–0.10 0.08 0.09 13.4 9.9
Ultic Hapludalf 0.10–0.20 0.08 0.09 0.77 0.10 11.3 10.0
0.00–0.10 0.10 a 0.09 20.1 17.6 b
Rhodic Paleudult 0.10–0.20 0.09 b 0.09 0.45 0.09 18.8 19.2 a
0.00–0.10 0.04 0.03 63.4 61.0
Humic Hapludox 0.10–0.20 0.04 0.03 0.89 0.78 61.5 60.8
0.00–0.10 0.02 0.03 43.0 44.8
Rhodic Hapludox 0.10–0.20 0.02 0.03 0.05 0.04 43.2 44.6
0.00–0.10 0.11 0.11 35.2 36.2
Typic Hapludox 0.10–0.20 0.10 0.11 0.90 0.69 33.8 33.8
1Soil Survey Staff ( 2010). Fe
d: concentration of Fe relative to the total pedogenic Fe oxides; Feo, concentration of Fe extracted by ammonium oxalate; SSA, specific surface area; NT,
no-tillage system; CT, conventional tillage system; Gb, gibbsite; Kt, kaolinite; Gt, goethite; Hm, hematite. Lowercase letters indicate the differences between the depth measurements, and the uppercase letters indicate the differences between management systems (Tukey’s test at the 5% level).
Mineralogical composition and phosphorus adsorption capacity of the soils
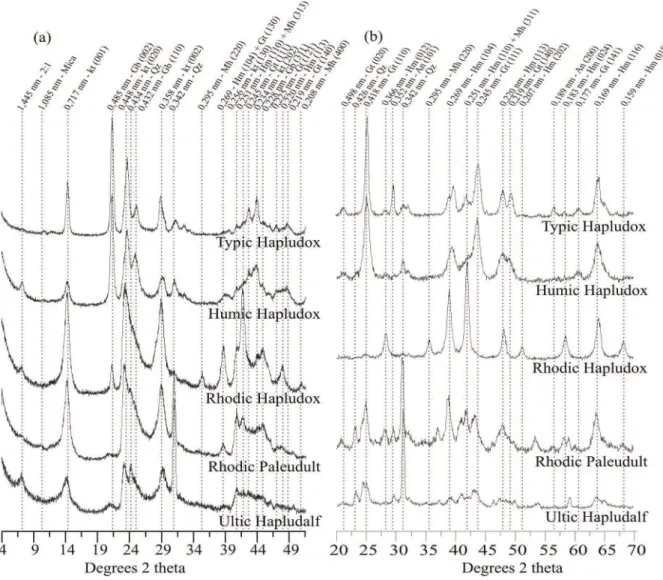
The X-ray diffraction patterns in the total clay fraction (Figure 2a) revealed the predominance of kaolinite in the Rhodic Hapludox, Rhodic
Paleudult and Ultic Hapludalf (Gb/(Gb+Kt) ≤
0.10) (Table 3) associated with 2:1 or 2:1:1 minerals (Rhodic Hapludox and Ultic Hapludalf) and quartz (Rhodic Paleudult and Ultic Hapludalf) that occurred to a less extent. The Typic and Humic Hapludox soils showed predominance of gibbsite [Gb/(Gb+Kt) ≥ 0.69] with the presence of 2:1 or 2:1:1 minerals in the Humic Hapludox. In all soils, the goethite and hematite Fe oxides were present in the fraction of concentrated Fe oxides (Figure 2b). In the Ultic Hapludalf, Humic and Typic Hapludox soils, Gt/(Gt+Hm) ≥ 0.77, i.e. goethite predominated over hematite (Table 3). The Rhodic Hapludox showed a predominance of hematite over goethite [Gt/(Gt+Hm) = 0.05], whereas the proportions of goethite and hematite were similar in the Rhodic Paleudult (Table 3). The presence of maghemite was detected only in the Rhodic Hapludox (Figure 2b), where it occurs in significant proportion according to the ratio Mh/(Mh+Gt+Hm) = 0.36.
The Fe present in pedogenic Fe oxides (Fed) and the concentrations of the various Fe oxides identified in each soil are presented in Table 3.
The Fe-for-Al substitution in the goethite, hematite and maghemite, as well as the chemical formulas considered in the allocation of Fe levels are listed in Table 4. In each soil, the Fed levels and the concentrations of Fe oxide phases were similar between the management systems and at both depths studied, whereas wide ranges were observed among the soils (Table 3). The highest Fed concentrations were observed in the Rhodic and Humic Hapludox developed from basalt (105–120 g kg-1), whereas the Ultic Hapludalf and Rhodic Paleudult, formed from sandstone and granite, respectively, exhibited lower Fed values (7–15 g kg-1). The ferrihydrite concentrations in the soil, estimated from the Fe extracted by
ammonium oxalate (Feo), also showed a
relationship with the parent material, ranging from 3.5 to 6.5 g kg-1 in the Oxisols and from 1.1 to 2.2 g kg-1 in the Alfisoil and Ultisoil. A Fe
Acta Scientiarum. Agronomy Maringá, v. 36, n. 3, p. 379-387, July-Sept., 2014 Figure 2. X-ray diffractograms of the total clay fractions of the 0.00–0.20 m layers of the evaluated soils (a), and of the concentrated iron
oxide fraction of the soils studied (b). Kt, kaolinite; Qz, quartz; Gb, gibbsite; Gt, goethite; Hm, hematite; Mh, maghemite; An, anatase.
Table 4. Isomorphic Fe by Al substitution (IS) and the chemical
formulae (CF) of Fe oxides identified in the soils.
Soil1 IS – Hematite IS – Goethite IS – Maghemite
---mol mol-1---
Ultic
Hapludalf 0.02 0.14 Nd
Rhodic
Paleudult 0.11 0.16 Nd
Humic
Hapludox nd 0.31 Nd
Rhodic
Hapludox 0.16 nd 0.16
Typic
Hapludox 0.14 0.33 nd
Soil1 CF - Hematite CF - Goethite CF - Maghemite
Ultic
Hapludalf α-Fe1.96Al0.04O3 α -Fe0.86Al0.14OOH
Rhodic
Paleudult α -Fe1.78Al0.22O3 α -Fe0.84Al0.16OOH
Humic
Hapludox α -Fe2O3 α -Fe0.69Al0.31OOH
Rhodic
Hapludox α -Fe1.68Al0.32O3 α -FeOOH -Fe1.68Al0.32O3
Typic
Hapludox α -Fe1.72Al0.28O3 α -Fe0.67Al0.33OOH
1Soil Survey Staff (2010).
MPAC varied greatly among the soils, but could be devided into three groups (Figure 3). In increasing order of MPAC, the Ultic Hapludalf and Rhodic Paleudult presented the lowest values (300 mg kg-1), followed by the Typic and Rhodic
Hapludox (1,100 mg kg-1) and the Humic
Hapludox, which showed the greatest P adsorption capacity (4,700 mg kg-1). As for the soil mineralogical attributes, the MPAC was
positively correlated with Fed and Gb/(Gb+Kt
(Table 5). The observed lower capacity of kaolinite to adsorb P compared with that of gibbsite (BARBIERI et al., 2009; BROGGI et al., 2010; CESSA et al., 2009; FONTES; WEED, 1996) has been related to the lower concentrations of OH sites on its surface (CELI et al., 2003).
such as ferrihydrite in the adsorption of P (JOHNSON; LOEPPERT, 2006; RANNO et al., 2007), even at low concentrations in the soil, and the greater P adsorption capacity of goethite compared with hematite observed in previous studies (ALMEIDA et al., 2003; CESSA et al., 2009; CURI; FRANZMEIER, 1984; FONTES; WEED, 1996). In addition, the results suggest that the higher amount of P adsorption by goethite is related to its greater specific surface area, as evidenced by the significant
relationship (p 0.0027) obtained between the
concentration of goethite and the SSA values of the soils (Table 5), thus corroborating the results of Torrent et al. (1990, 1992, 1994). It should be noted that the formation of goethite is favored in environments that promote the accumulation of OM in the soil (BIGHAM et al., 2002), which suggests that the correlation between MPAC and organic C (Table 5) is affected by the covariance between the concentrations of goethite and organic C (p < 0.0001).
Figure 3. Maximum phosphorus adsorption capacity (MPAC) in two
layers of each soil for both soil management systems (values of MPAC did not differ significantly – Tukey’s test at the 5% level – between soil depth neither between tillage system, in all soils).
Regarding the relationships between the MPAC and the influential soil parameters, the lower MPACs of the Ultic Hapludalf and Rhodic Hapludox resulted from the kaolinitic mineralogy
(Gb/(Gb+Kt) ≤ 0.10) combined with the low
concentrations of iron oxides (Fed < 15 g kg-1) and the consequently reduced SSA in these soils
(SSA < 20 m2 g-1). The Typic and Rhodic
Hapludox showed intermediate MPAC values compared with the other soils, but these soils were characterized by distinct combinations of mineralogical attributes. The greater concentration of pedogenic Fe oxides (115 < Fed < 120 g kg-1) in the Rhodic Hapludox, due to the predominance of hematite and maghemite
minerals, was compensated for in the Typic Hapludox by the concentration of goethite and the greater proportion of gibbsite [Gb/(Gb+Kt) = 0.69]. The high MPAC of the Humic Hapludox resulted from its gibbsitic mineralogy [Gb/(Gb+Kt) = 0.78] combined with a high concentration of Fe oxides (Fed > 100 g kg-1), mainly due to the presence of goethite minerals, which resulted in the largest SSA of all the soils (60 < SSA <65 m2 g-1).
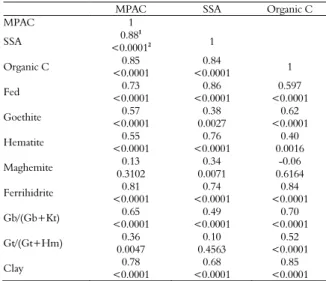
Table 5. The ‘rs’ and ‘p’ values of the correlation analyses of
variables that affect the maximum phosphorus adsorption capacity.
MPAC SSA Organic C
MPAC 1
SSA <0.00010.881 2 1
Organic C <0.00010.85 <0.0001 0.84 1
Fed <0.00010.73 <0.0001 0.86 <0.0001 0.597
Goethite <0.00010.57 0.0027 0.38 <0.0001 0.62
Hematite <0.00010.55 <0.0001 0.76 0.0016 0.40
Maghemite 0.31020.13 0.0071 0.34 0.6164 -0.06
Ferrihidrite <0.00010.81 <0.0001 0.74 <0.0001 0.84
Gb/(Gb+Kt) <0.00010.65 <0.0001 0.49 <0.0001 0.70
Gt/(Gt+Hm) 0.00470.36 0.4563 0.10 <0.0001 0.52
Clay <0.00010.78 <0.0001 0.68 <0.0001 0.85
1r
s: Spearman correlation coefficient; 2p: level of significance. MPAC: maximum
phosphorus adsorption capacity; SSA: specific surface area; Fed: concentration of Fe relative to the total pedogenic Fe oxides; Gb, gibbsite; Kt, kaolinite; Gt, goethite; Hm, hematite.
Effect of soil management systems on soil phosphorus adsorption capacity
The MPACs of all the soils were similar at the depths 0.0–00.10 m and 0.10–0.20 m (Figure 3), even with the greater concentration of organic C in the 0.00–0.10 m layers of the no-tilled Rhodic Paleudult and Humic Hapludox (Figure 1). An effect of the different soil management systems on MPAC was also not observed in two Oxisols and one Alfisol in southern Brazil in the study of Rheinheimer et al. (2003). These results contradict other studies indicating that the interactions between mineral surfaces and organic compounds reduce the P adsorption capacity of a soil (ALMEIDA et al., 2003; SCHWERTMANN et al., 1986), although these authors did not specifically evaluate the effect of management systems on MPAC; instead, they determined the MPAC of different soil classes.
Acta Scientiarum. Agronomy Maringá, v. 36, n. 3, p. 379-387, July-Sept., 2014 provided by Pavinato et al. (2010), who observed a
change in the characteristics of P adsorption in the zone near the surface. The accumulation of organic C in the NT soil, which is normally highest in the first centimeters from the soil surface (0.00–0.025 m and 0.025–0.05 m), may have been diluted by sampling the 0.00–0.10 m layer. Additionally, the soil grinding procedure to obtain the ADFS destroys the aggregates formed under NT, thereby exposing the P adsorption sites that would be less exposed under the natural conditions of the management system.
Conclusion
The diversity of the mineralogical composition of the soils resulted in significant differences in the maximum phosphorus adsorption capacities among the soils. The P adsorption capacities of soils followed the sequence: Ultic Hapludalf ≈ Rhodic Paleudult < Typic Hapludox ≈ Rhodic Hapludox < Humic Haplodox, and the increase was positively related to the Fe in pedogenic Fe oxides, the concentrations of goethite and ferrihydrite and the gibbsite to kaolinite ratio, which were instrumental in increasing the specific surface area of soils. The maximum phosphorus adsorption capacity of each soil was not affected by long-term no-tillage system.
Acknowledgements
The authors thank CNPq for providing fellowships to A.V. Inda and C. Bayer, and financial support under Universal Edital (process 470718/2009-9; 481694/2011-0). This work was also partly financed by the Spain’s Ministry of Science and Innovation (Project CGL 2010-15067) and the European Regional Development Fund.
References
AFIF, E.; BARRÓN, V.; TORRENT, J. Organic matter delays but does not prevent phosphate sorption by Cerrado soils from Brazil. Soil Science, v. 159, n. 3,
p. 207-211, 1995.
ALMEIDA, J. A.; TORRENT, J.; BARRÓN, V. Soil color, phosphorus pools and phosphate adsorption in latosols developed from basalt in the south of Brazil.
Revista Brasileira de Ciência do Solo, v. 27, n. 6,
p. 985-1002, 2003.
BARBIERI, D. M.; MARQUES JÚNIOR, J.; ALLEONI, L. R. F.; GARBUIO, F. J.; CAMARGO, O. A. Hillslope curvature, clay mineralogy, and phosphorus adsorption in an Alfisol cultivated with sugarcane. Scientia Agricola,
v. 66, n. 6, p. 819-826, 2009.
BIGHAM, J. M.; FITZPATRICK, R. W.; SCHULZE, D. Iron oxides. In: DIXON, J. B.; SCHULZE, D. G. (Ed.).
Soil mineralogy with environmental applications.
Madison: SSSA, 2002. p. 323-366.
BROGGI, F.; OLIVERIRA, A. C.; FREIRE, F. J.; FREIRE, M. B. G. S.; NASCIMENTO, C. W. A. Adsorption and chemical extraction of phosphorus as a function of soil incubation time. Revista Brasileira de
Engenharia Agrícola e Ambiental, v. 14, n. 1, p. 32-38,
2010.
BROWN, G.; BRINDLEY, G. W. X-ray diffraction procedures for clay mineral identification. In: BRINDLEY, G. W.; BROWN, G. (Ed.). Crystal structures of clays
minerals and their X-ray identification. London:
Mineralogical Society, 1980. p. 305-360.
CELI, L.; DE LUCA, G.; BARBERIS, E. Effects of interaction of organic and inorganic P with ferrihydrite and kaolinite-iron oxide systems on iron release. Soil
Science, v. 168, n. 7, p. 479-488, 2003.
CESSA, R. M. A.; CELI, L.; VITORINO, A. C. T.; NOVELINO, J. O.; BARBERIS, E. Specific surface área and porosity of the clay fraction and phosphorus adsorption in two rhodic ferralsols. Revista Brasileira de
Ciência do Solo, v. 33, n. 5, p. 1153-1162, 2009.
CURI, N.; FRANZMEIER, D. P. Toposequence of Oxisols from the central plateau of Brazil. Soil Science
Society of America Journal, v. 48, n. 2, p. 341-346,
1984.
EMBRAPA-Empresa Brasileira de Pesquisa Agropecuária. Centro Nacional de Pesquisa de Solos. Manual de
métodos de análises de solos. 2. ed. Rio de Janeiro:
Embrapa, CNPS, 1997.
FONTES, M. P. F.; WEED, S. B. Phosphate adsorption by clays from Brazilian Oxisols: relationships with specific surface area and mineralogy. Geoderma, v. 72, n. 1-2,
p. 37-51, 1996.
JOHNSON, S.; LOEPPERT, R. H. Role of organic acids in phosphate mobilization from iron oxide. Soil Science
Society of America Journal, v. 70, n. 1, p. 222-234,
2006.
KÄMPF, N.; SCHWERTMANN, U. The 5M - NaOH concentration treatment for iron oxides in soils. Clays
and Clay Minerals, v. 30, n. 6, p. 401-408, 1982.
LAIR, G. J.; ZEHETNER, F.; KHAN, Z. H.; GERZABEK, M. H. Phosphorus sorption-desorption in alluvial soils a young wethering sequence at the Danube River. Geoderma, v. 149, n. 1-2, p. 39-44, 2009.
LIU, F.; HE, J.; COLOMBO, C. Competitive adsorption of sulfate and oxalate on goethite in the absence or presence of phosphate. Soil Science, v. 164, n. 3, p. 180-189, 1999.
MEHRA, O. P.; JACKSON, M. L. Iron oxides removal from soil and clays by a dithionite-citrate system buffered with sodium bicarbonate. Clays and Clay Minerals, v. 7,
n. 1, p. 317-327, 1960.
MIKUTTA, C.; LANG, F.; KAUPENJOHANN, M. Kinetics of phosphate sorption to polygalacturonate-coated goethite. Soil Science Society of America
Journal, v. 70, n. 2, p. 541-549, 2006.
moisture regimes in Oxisols of Central Brazil. Zeitschrift
für Pflanzenernährung und Bodenkunde, v. 155, n. 5,
p. 385-390, 1992.
MURPHY, J.; RILEY, J. P. A modified single solution method for the determination of phosphate in natural waters. Analytica Chimica Acta, v. 27, n. 1, p. 31-36,
1962.
NITZSCHE, R. P.; PERCIVAL, J. B.; TORRANCE, J. K.; STIRLING, J. A. R.; BOWEN, J. T. X-ray diffraction and infrared characterization of Oxisols from central and southeastern Brazil. Clay Minerals, v. 43, n. 4, p. 549-560,
2008.
NORTH, P. F. Towards an absolute measurement of soil structural stability using ultrasound. European Journal
of Soil Science, v. 27, n. 4, p. 451-459, 1976.
NOVAIS, R. F.; SMYTH, T. J. Fósforo em solo e
planta em condições tropicais. Viçosa: UFV, 1999.
OLSEN, S. R.; WATANABE, F. S. A method to determine a phosphorus adsorption maximum of soil as measured by the Langmuir isotherm. Soil Science Society of America
Proceedings, v. 21, n. 2, p. 144-149, 1957.
PAVINATO, P. S.; DAO, T. H.; ROSOLEM, C. A. Tillage and phosphorus management effects on enzyme-labile bioactive phosphorus availability in Cerrado Oxisols. Geoderma, v. 156, n. 3-4, p. 207-215, 2010.
PAVINATO, P. S.; MERLIN, A.; ROSOLEM, C. A. Phosphorus fraction in Brazilian Cerrado soils as affected by tillage. Soil and Tillage Reseach, v. 105, n. 1, p. 149-155,
2009.
QUIRK, J. P. Significance of surface áreas calculated from water vapor sorption isotherms by use of the B.E.T equations. Soil Science, v. 80, n. 6, p. 423-430, 1955.
RANNO, S. K.; SILVA, L. S.; GATIBONI, L. C.; RHODEN, A. C. Phosphorus adsorption capacity in lowland soils of Rio Grande do Sul state. Revista
Brasileira de Ciência do Solo, v. 31, n. 1, p. 21-28,
2007.
RHEINHEIMER, D. S.; ANGHINONI, I.; CONTE, E. Phosphorus sorption in soil in relation to the initial content and soil management. Revista Brasileira de
Ciência do Solo, v. 27, n. 1, p. 41-49, 2003.
SCHAEFER, C. E. G. R.; FABRIS, J. D.; KER, J. C. Minerals in the clay fraction of Brazilian Latosols (Oxisols): a review. Clay Minerals, v. 43, n. 1, p. 137-154, 2008.
SCHULZE, D. G. The influence of aluminum on iron oxides: VIII. Unit-cell dimensions of Al-substituted goethites and estimation of Al from them. Clays and
Clay Minerals, v. 32, n. 1, p. 36-44, 1984.
SCHWERTMANN, U. Differenzierung der eisenoxide des bodens durch extraktion mit
ammoniumoxalat-lösung. Zeitschrift für Pflanzenernährung, Düngung
und Bodenkunde, v. 105, n. 3, p. 194-202, 1964.
SCHWERTMANN, U.; FECHTER, H. The influence of aluminium on iron oxides: XI. Aluminium-substituted maghemite in soils and its formation. Soil Science
Society of America Journal, v. 48, n. 6, p. 1462-1463,
1984.
SCHWERTMANN, U.; FITZPATRICK, R. W.; TAYLOR, R. M.; LEWIS, D. G. The influence of aluminum on iron oxides. Part II. Preparation and properties of Al-substituted hematites. Clays and Clay
Minerals, v. 27, n. 2, p. 105-112, 1979.
SCHWERTMANN, U.; KODAMA, H.; FISCHER, W. R. Mutual interactions between organic and iron oxides. In: HUANG, P. M.; SCHNITZER, M. (Ed.).
Interactions of soil minerals with natural organics
and microbes. Madison: SSSA, 1986. p. 223-250.
SCHWERTMANN, U.; SCHULZE, D. G.; MURAD, E. Identification of ferrihydrite in soils by dissolution kinetics, differential x-ray diffraction and Mössbauer spectroscopy. Soil Science Society of America
Journal, v. 46, n. 4, p. 869-875, 1982.
SILVA NETO, L. F.; INDA, A. V.; BAYER, C.; DICK, D. P.; TONIN, A. T. Iron oxides in tropical and subtropical Brazilian oxisols under long-term no-tillage. Revista
Brasileira de Ciência do Solo, v. 32, n. 5, p. 1873-1881,
2008.
SOIL SURVEY STAFF. Keys to Soil Taxonomy. 11th
ed. Washington, D.C.: United States Department of Agriculture. Natural Resources Conservation Service, 2010.
TORRENT, J.; BARRÓN, V.; SCHWERTMANN, U. Phosphate adsoption and desorption by goethites differing in crystal morphology. Soil Science Society of America
Journal, v. 54, n. 4, p. 1007-1011, 1990.
TORRENT, J.; SCHWERTMANN, U.; BARRÓN, V. Fast and slow phosphate sorption by goethite-rich natural materials. Clays and Clay Minerals, v. 40, n. 1, p. 14-21,
1992.
TORRENT, J.; SCHWERTMANN, U.; BARRÓN, V. Phosphate sorption by natural hematites. European
Journal of Soil Science, v. 45, n. 1, p. 45-51, 1994.
Received on July 17, 2012. Accepted on October 9, 2012.