AS A SUPPORT FOR PHOSPHORUS FERTILIZER MANAGEMENT
Sorção e dessorção de fósforo em solos do cerrado brasileiro como suporte para recomendação da adubação fosfatada
Flávio Araújo Pinto1, Edicarlos Damacena de Souza2, Helder Barbosa Paulino3,
Nilton Curi4, Marco Aurélio Carbone Carneiro5
ABSTRACT
Phosphorus (P) sorption by soils is a phenomenon that varies depending on soil characteristics, influencing its intensity and magnitude, which makes it a source or drain of P. The objective of this study was to determine the Maximum Phosphorus Adsorption Capacity (MPAC) and desorption of P from soils under native Savanna Brazilian and verify the correlation between MPAC and P Capacity Factor (PCF) with the chemical and physical properties of these soils. The study was conducted in seven soils under native Savannas. The Langmuir isotherms were adjusted from the values obtained in sorption assays, being evaluated the MPAC, the energy adsorption (EA) and PCF, which was calculated according to the levels of P-adsorbed and P-sorbed. Values of MPAC were classified as high in most soils, ranging from 283 up to 2635 mg kg-1 of P in the soil and were correlated with soil
organic matter, clay, silt, sand, base saturation and pH. The PCF was higher in soils where the MPAC was also higher. The use of only one attribute of soil (clay content) as a criterion for the recommendation of phosphated fertilization, as routinely done, is susceptible to errors, needing the use of more attributes for a more accurate recommendation, as a function of the complexity of the interactions involved in the process.
Index terms: Phosphorus adsorption capacity, langmuir, soil fertility management, correction of P deficiency.
RESUMO
A sorção do fósforo (P) pelo solo é um fenômeno que varia em função das características do solo, influenciando sua intensidade e magnitude, tornando-o fonte ou dreno de P. Neste estudo, objetivou-se quantificar a sorção e dessorção de P e avaliar as interações entre estas e os atributos físicos e químicos dos solos. O estudo foi realizado em sete solos sob vegetação nativa de Cerrado. As isotermas de Langmuir foram ajustadas a partir dos valores de sorção obtidos, sendo avaliados a Capacidade Máxima de Adsorção de Fósforo (CMAP), a Energia de Adsorção (EA) e o Fator Capacidade de Fósforo (FCP), o qual foi calculado em função dos teores de P-sorvido e P-dessorvido. Os valores da CMAP foram classificados como altos na maioria dos solos, variando de 283 até 2635 mg kg-1 de P no solo e se correlacionaram com os teores de matéria orgânica, argila, silte, areia, saturação
por bases e pH. O FCP foi maior nos solos onde se obteve maior CMAP. A utilização de apenas um atributo de solo (teor de argila) como critério de recomendação da adubação fosfatada, como rotineiramente tem sido realizada, apresenta-se suscetível a erros, necessitando da utilização de mais atributos para uma recomendação mais acurada, em função da complexidade das interações envolvidas no processo.
Termos para indexação: Capacidade de adsorção de fósforo, langmuir, manejo da fertilidade do solo, correção da deficiência de P.
(Received in august 23, 2013 and approved in october 1, 2013) INTRODUCTION
Phosphorus (P) is found in the soil bonded to the solid phase with different energy intensities and in the soil solution, with relatively low levels, between 0.002 and 2.0 mg L-1 (FARDEAU, 1996). The P supply to the liquid phase
occurs through labile P and the speed at which this occurs is a function of the soil phosphorus capacity factor (PCF), which is influenced by soil properties, especially the clay
content and mineral and organic composition, which determines the energy of the bonds between the P and the soil solid phase (NOVAIS; SMYTH, 1999).
Working with well drained soils from Minas Gerais state found a correlation between sorption and texure and mineralogy, finding higher values in soils with higher clay content and more weathered (SOUZA et al., 2006). Using floodplain soils found correlations between P sorption with iron dithionite contents (Fed), [Fe oxalate (Feo)/(Fed)] ratio,
1Universidade de São Paulo/USP – Escola Superior de Agricultura “Luiz de Queiroz”/ESALQ – Piracicaba – SP – Brasil 2Universidade Federal de Mato Grosso/UFMT – Campus de Rondonópolis – Rondonópolis – MT – Brasil
3Universidade Federal de Goiás/UFG – Departamento de Agricultura – Campus Jataí – Jataí – GO – Brasil 4Universidade Federal de Lavras/UFLA - Departamento de Ciência do Solo/DCS – Lavras – MG – Brsil
5Universidade Federal de Lavras/UFLA – Departam ento de Ciência do Solo/DCS – Cx. P. 3037 – 37200-000 – Lavras – MG – Brasil –
organic matter, base saturation and potential acidity (GUILHERME et al., 2000), similar to that found by Ranno et al. (2007) for soils of floodplains in the state of Rio Grande do Sul. Considered the type and content of clay, of amorphous colloids and of organic matter as factors that strongly affect the sorption of P (NOVAIS; SMYTH, 1999). Thus, the factors and processes of soil formation provide con tr asting chemical, ph ysical an d biological characteristics conferring alterations in the Maximum Phosphorus Adsorption Capacity (MPAC) and the energy levels between the P bonds and the colloids by regulating the amount of soil labile P (CORRÊA; ROCHA; NASCIMENTO, 2011).
Highly weathered tropical soils have a higher point of zero charge (PZC) value, resulting in more electropositive soils and therefore with higher ability to adsorb anions, such as phosphate (PARDO, GUADALIX; GARCIAS-GONZALES, 1992; MARCHI et al., 2006; ANDA et al., 2008; EBERHARDT et al., 2008; NEGASSA et al., 2008). The soil mineralogy can also be used to characterize them as a P source or sink, in which little weathered soils (rich in weatherable primary silicate minerals) are shown as sources, while highly weathered soils (oxidic) and with high clay amounts levels present as sinks(NOVAIS; SMYTH, 1999). Organic matter affects phosphate adsorption indirectly by inhibiting aluminium oxide crystallization (BORGGAARD et al., 1990; 2005), Fontes and Weed (1996) obtained similar results in Brazilian Oxisols.
Along these lines, the Oxisols are an example of this characteristic (sink), mainly due to their high degree of weathering and low levels of available P and they can adsorb more than 2 mg g-1 of P. This equates to more than
9200 kg ha-1 P
2O5 incorporated in the 0-20 cm layer (KER et
al., 1996). Novais and Smyth (1999) also found that half of this capacity can be established with up to a month of P contact with the soil.
Beckwith (1965) and Fox and Kamprath (1970) observed that 0.2 mg L-1 P is the equilibrium concentration
required to obtain maximum plant growth. Thus, soils with higher weathering have lower levels of solution P than the less weathered soils (SOUZA et al., 2006) generating a continuous transfer, with reduced intensity, of labile P to solution P. The supply of solution P performed by the soil labile P occurs to maintain the equilibrium between the soil solution and solid phase, and this movement is related to the PCF, which represents the movement capacity of the solid phase P to the solution.
This study aimed to determine the MPAC and desorption of P from soils under native Savanna Brazilian
and verify the correlation between MPAC and PCF with the chemical and physical properties of these soils.
MATERIAL AND METHODS
To obtain a set with variability in relation to soil physical and chemical attributes, we used surface layer samples (0-20 cm) from seven soils (areas without anthropic interference) from Savanna Brazilian. The soils collected were: Typic Hapludox (TH) (17°31’37" S and 51°53’40" W); Rhodic Hapludox (RH1) (17°52’17" S and 51°59’22" W); Typic Quartzipsamment (TQ) (17°46’32" S and 51°49’4" W); Rhodic Acrudox (RA) (17°53’44" S and 51°40’49" W); Rhodic Hapludox (RH2) (12°36’42" S and 52°12’46" W); Typic Plinthaquox(TP1), collected at the top of the murundus (earthmounds) (17°58’18" S and 52°4’47" W); Typic Plinthaquox (TP2), collected at the base of the murundus (17°58’18" S and 52°4’47" W) and Rhodic Hapludox (RH3) (17°47’6" S and 51°1’47" W) (USDA-NRCS:Soil TAXONOMY - SOIL SURVEYS STAFF, 1999).
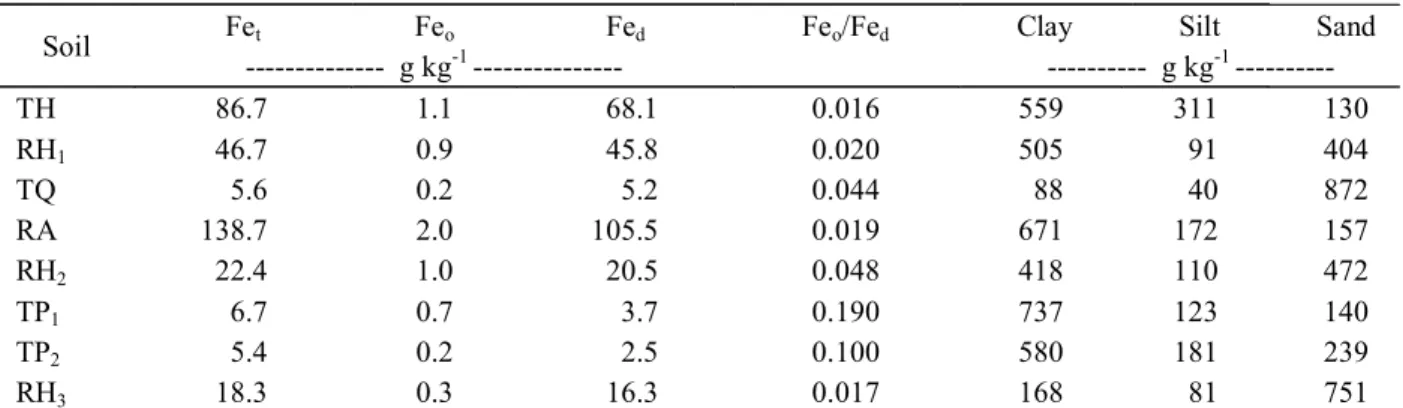
The samples were oven-dried at 40 °C and passed through a 2 mm mesh sieve. Contents of total organic carbon (Volumetric method by potassium dichromate, Walkley-black modified JACKSON, 1982), calcium (KCl), magnesium (KCl), pH (H2O), aluminum (KCl), potential acidity (calcium acetate), phosphorus (Mehlich-1), potassium (Mehlich-1) (Table 1) and sand, silt and clay (pipette method) (EMBRAPA, 2009) were quantified. We also analyzed total iron (Fet) (FEY; DIXON, 1983 ) iron oxalate (Feo) (SCHWERTMANN, 1964; MCKEAGUE; DAY, 1966) and iron dithionite (Fed) (MEHRA; JACKSON, 1960; HOLMGREN, 1967) and the results are shown in table 2.
For the Maximum Ph osphorus Adsor ption Capacity (MPAC) analysis we used the following procedure: the samples were analyzed in triplicates using 1 g of soil in a 50 ml centrifuge tube. To each tube 30 ml of CaCl2 solution (0.01 mol L-1) with different concentrations
of P was added. Using the software Visual MINTEQ speciation of the solutions, it was observed that the H2PO4- species remained greater than 87%. The solutions
used for the sorption process contained concentrations of 0, 10, 20, 40, 80 and 160 mg L-1 P, using the KH
2PO4
reagent for the preparation of these solutions, and CaCl2 (0.01 mol L-1) as a background solution, these solutions
After the shaking, the tubes were centrifuged for 15 min at 1559 g, promoting settling of the soil and allowing the removal of all the supernatant solution, which was analyzed for P content. The P concentrations were quantified by spectrophotometry (BRAGA; DEFELIPO, 1972).
To evaluate P-desorption, after centrifugation and removal of supernatant 30 ml of the CaCl2 (0.01 mol L-1),solution and unbuffered pH
o H” 7, were added in
the tube, remaining in contact for 72 hours, repeating the procedure used in sorption. After shaking, the tubes were again centrifuged for 15 min at 1559 g and P concentrations in the supernatant were quantified in an atomic absor ption spectr oph otometer (BRAGA; DEFELIPO, 1972).
The Langmuir equation was adjusted to the values of the P-sorbed, allowing the determination of the MPAC according to the equation 1:
x/m=kbC/(1+kC) (1)
Table 1 – Chemical attributes of Savanna Brazilian soils
Soil SOM Al Ca Mg H+Al pH K P CECef CEC V m
g kg-1 --- mmolc dm-3 --- (H2O) - mg dm-3 - mmolc dm-3 ---- % ----
TH 60.6 2.0 9.7 8.0 66.7 5.6 116 0.6 22.7 87.4 24 9
RH1 38.5 9.2 0.5 0.7 72.9 4.3 38 0.7 11.4 75.1 3 81
TQ 15.6 12.3 1.2 0.8 48.7 4.3 19 3.7 14.8 51.2 5 83
RA 35.1 8.7 0.7 0.9 67.5 4.9 30 0.6 11.1 69.9 3 78
RH2 39.4 15.2 1.0 1.2 75.4 4.6 30 1.9 18.2 78.4 4 84
TP1 47.5 11.0 0.0 0.4 68.6 5.0 30 0.8 12.2 69.8 2 90
TP2 60.4 4.4 0.8 0.4 58.7 5.1 30 0.8 6.4 60.7 3 68
RH3 15.8 9.1 0.6 0.5 46.9 4.7 19 1.1 10.7 48.5 3 85
(TH) - Typic Hapludox; (RH1) - Rhodic Hapludox; (TQ) - Typic Quartzipsamment; (RA) - Rhodic Acrudox; (RH2) - Rhodic
Hapludox; (TP1) - Typic Plinthaquox; (TP2) - Typic Plinthaquox; (RH3) Rhodic Hapludox.
Table 2 – Total iron (Fet), iron oxalate (Feo), iron dithionite (Fed) and particle size distribution.
Soil Fet Feo Fed Feo/Fed Clay Silt Sand
--- g kg-1 --- --- g kg-1 ---
TH 86.7 1.1 68.1 0.016 559 311 130
RH1 46.7 0.9 45.8 0.020 505 91 404
TQ 5.6 0.2 5.2 0.044 88 40 872
RA 138.7 2.0 105.5 0.019 671 172 157
RH2 22.4 1.0 20.5 0.048 418 110 472
TP1 6.7 0.7 3.7 0.190 737 123 140
TP2 5.4 0.2 2.5 0.100 580 181 239
RH3 18.3 0.3 16.3 0.017 168 81 751
(TH) - Typic Hapludox; (RH1) - Rhodic Hapludox; (TQ) - Typic Quartzipsamment; (RA) - Rhodic Acrudox; (RH2) - Rhodic
Hapludox; (TP1) - Typic Plinthaquox; (TP2) - Typic Plinthaquox; (RH3) Rhodic Hapludox.
where: x/m = P-sorbed [mg (x)/kg (m) of soil P], k = constant related to the P binding energy (L mg-1), b = soil MPAC
(mg kg-1), and C = concentration of P in the equilibrium
solution (mg L-1).
To obtain estimates of the k and b constants, the linearized form of the Langmuir equation was used according to the equation 2:
C/(x/m)=1/kb+C/b (2)
KAMPRATH, 1970). Regression analyzes and Pearson correlations were established between MPAC and PCF with some chemical and physical attributes of different soils using the SigmaPlot 10.0 system. Principal Component Analysis (PCA) was performed using the Statistica 7.0 Software (STATSOFT, 2005).
RESULTS AND DISCUSSION
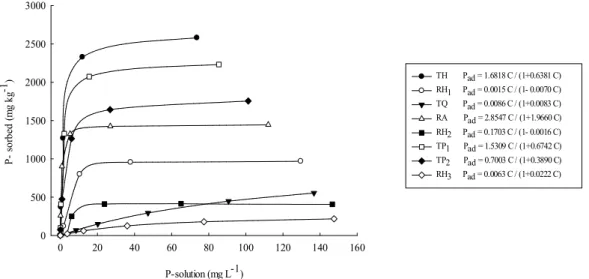
The increase in P sorption by soils is intensified with the higher concentration of P in solution (Figure 1), mainly in TH, TP1, TP2 and RA. It appears that there is a relationship between the amount of P-sorbed (Figure 1) and clay content (Table 2), in which the highest levels of P-sorbed were found in TH,TP1, TP2 and RA with values exceeding 1000 mg kg-1. However, this relationship is not
constant, considering that if there were proportionality between clay and sorption, the highest sorption would occur in TP1 and RA soils, indicating that other factors also interfere in the sor ption of P by these soils (EBERHARDT et al., 2008; RIBEIRO et al., 2011).
There is an initial phase with intense P sorption by the soil due to strong electrostatic attraction, with subsequent oxides adsorption through ligand exchanges (BARROW, 1985). However, even the soils containing large amounts of oxides present stabilization of sorption with the increasing concentration of added P, which shows that the soils can have their P drain character reduced by continuous addition of this nutrient. This effect, observed
here in areas without anthropic action, has strong influence on fertilization management of the soils that have been under high phosphate fertilizer management systems for several years. Areas cultivated with intensive agriculture exhibit the addition of high P doses, resulting in increase of P content in the soil since the addition is greater than the extraction by the plants, allowing an increase in the soil P content and the reduction of the drain characteristic with the management time.
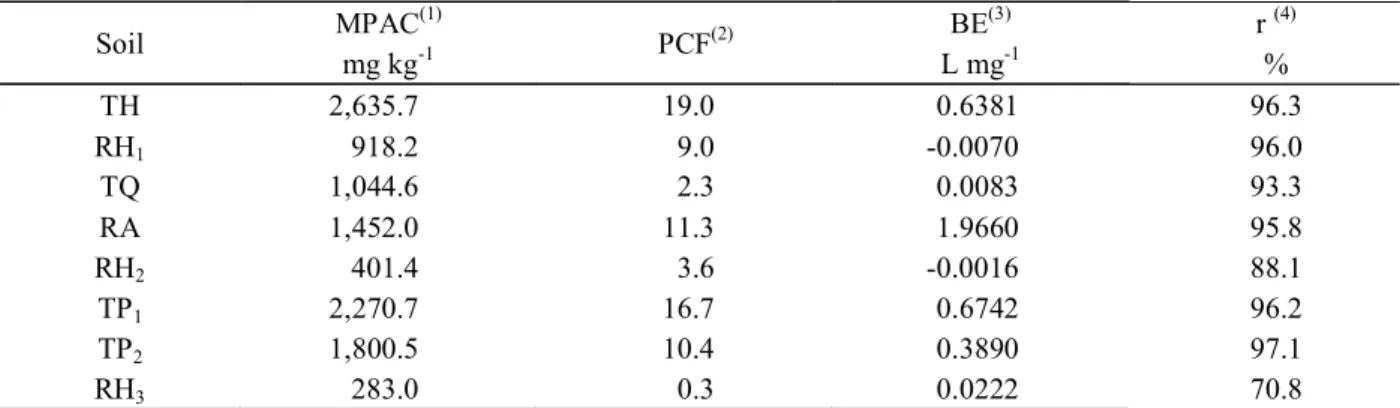
The soils showed a wide range with respect to the MPAC and PCF (Table 3), due to chemical and physical attributes of the soil (Tables 1 and 2). The MPAC ranged from 283.0 to 2635.7 mg kg-1 for RH
3 and TH, respectively.
Juo and Fox (1977) proposed a classification of soils with respect to their MPAC, considering soils with very high sorption those that adsorb more than 1000 mg kg-1 of P
and as high sorption, those that adsorb between 500 and 1000 mg kg -1 of P. It can be seen that, in the present study,
that almost all the soils, with the exception of RH, are classified as high sorption.
The management of phosphate fertilization that takes into account principally the soil clay content (SOUSA; LOBATO, 2004) in these soils may not be completely effective to recommend phosphate fertilization, due to the mineralogical characteristics of the clays and their MPACs and PCFs. This fact is verified when evaluating TH and RH1soils that have clay content with very close values and an MPAC 287% higher for the TH (Table 3).
P-solution (mg L-1)
0 20 40 60 80 100 120 140 160
P
-
so
rb
ed
(
m
g
k
g
-1)
0 500 1000 1500 2000 2500 3000
TH Pad = 1.6818 C / (1+0.6381 C) RH1 Pad = 0.0015 C / (1- 0.0070 C) TQ Pad = 0.0086 C / (1+0.0083 C) RA Pad = 2.8547 C / (1+1.9660 C) RH2 Pad = 0.1703 C / (1- 0.0016 C) TP1 Pad = 1.5309 C / (1+0.6742 C) TP2 Pad = 0.7003 C / (1+0.3890 C) RH3 Pad = 0.0063 C / (1+0.0222 C)
This effect can be explained by the higher iron content (Fet, Feo and Fed) of the TH than RH1 (Table 2) and higher P sorption capacity of the oxides as compared to phyllosilicates (FOX; SEARLE, 1978; CESSA et al., 2009). The values obtained for the TP1 and TP2 soils (Table 2) showed higher variations in clay content (>15%) and lower variations in the Fe concentrations, corroborating the recommendation for phosphate fertilization adopted for soils of the Savanna Brazilian (SOUSA; LOBATO, 2004). Th ese results demonstrate the complexity of the management of phosphorus in these soils.
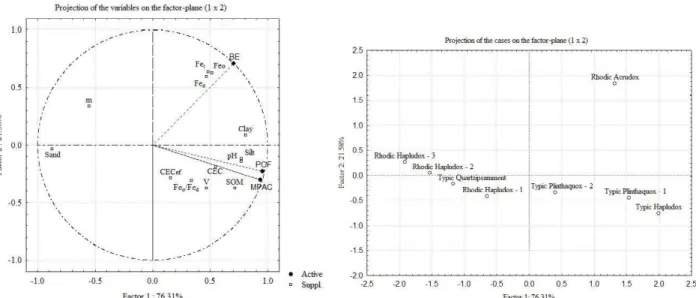
The dependence of the PCF and MPAC variables regarding the SOM, pH, clay and silt attributes can be visualized by principal component analysis (Figure 2), due to greater proximity to the circle and the variable, followed by the attributes CEC, V, Feo/Fed and CECef. The BE showed to be highly influenced by the attributes related to Fe (Fet, Feo and Fed).
Soil distribution by quadrants as a function of factors 1 and 2 (Figure 2) allows us to verify that the RA is the soil that has the highest contribution to BE, due to the farther distance from the point of origin between factors 1 and 2, and for being in the same quadrant as the BE. Similarly, this occurs for MPAC and PCF that received higher contributions from TP1 and TH soils.
Using multivariate statistics it was possible to classify the evaluated soils into three groups (Figure 3). It is visible that the RH2 and RH3 soils presented similar results, followed by other formed groups (left to right). Thus, the three distinct groups formed are composed of
soils: (1) TH, TP1, RA and TP2; (2) RH1, RH2 and RH3 e (3) TQ. By comparing these groups with MPAC we can see that they are divided into three magnitude ranges, with group (1) > 1400 mg kg-1; group (2) <1000 mg kg-1; and
group (3) between the two limits.
The MPAC values were positively correlated with soil organic matter (SOM), clay, silt, base saturation and pH (Figure 2), indicating the influence of particle size and chemical composition of the soil on this attribute (EBERHARDT et al., 2008). The Savannas soils, highly weathered, may show 950 g kg-1 of gibbsite in the clay
fraction (HUANG et al., 2002) and Pozza et al. (2007; 2009) obtained a positive correlation between P adsorption and clay fraction of this.The TH had the highest MPAC, followed by TP1, however these soils have different organic matter and iron oxide contents, and the Feo/Fed ratio of TP1 being higher than that of TH. This indicates a lower degree of crystallinity of the iron oxides, resulting in higher reactivity and higher P sorption related to Fe. This fact, together with the the high clay content, may explain the high MPAC value for TH compared to other soils. The RA had the highest Fe content (Table 2), however the Feo/Fed ratio indicates a higher degree of crystallinity (<Feo/Fed), thus, the highest P-binding energy (BE) was found in this soil (Table 3) which relates to the charges of this soil, diverging from the behavior of the others, where BE showed a correlation with MPAC (Table 4). In soils TH, RH1, RH3 and it can be seen that the Feo/Fed ratio was also low, indicating a reduction in the sorption capacity of the P bonded to Fe in these soils.
Table 3 – Maximum Phosphorus Adsorption Capacity (MPAC), Phosphorus Capacity Factor (PCF) and P-Binding Energy (BE) in Savannas soils.
Soil MPAC
(1)
PCF(2) BE
(3)
r (4)
mg kg-1 L mg-1 %
TH 2,635.7 19.0 0.6381 96.3
RH1 918.2 9.0 -0.0070 96.0
TQ 1,044.6 2.3 0.0083 93.3
RA 1,452.0 11.3 1.9660 95.8
RH2 401.4 3.6 -0.0016 88.1
TP1 2,270.7 16.7 0.6742 96.2
TP2 1,800.5 10.4 0.3890 97.1
RH3 283.0 0.3 0.0222 70.8
(TH) - Typic Hapludox; (RH1) - Rhodic Hapludox; (TQ) - Typic Quartzipsamment; (RA) - Rhodic Acrudox; (RH2) - Rhodic Hapludox; (TP1) - Typic Plinthaquox; (TP2) - Typic Plinthaquox; (RH3) Rhodic Hapludox.(1) MPAC values estimated from the
slope of the straight line (b1). (2) Linear coefficient (b
1) of the 2nd degree equation the between P- sorbed and P-desorbed. (3)
Although the literature registers that Fe influences the sorption of P (UDO; UZU, 1972; JUO; FOX, 1977; HERNÁNDEZ; MEURER, 1998), the present study found no significant correlations between the levels of Fet, Feo and Fed and MPAC or PCF (Table 4). However, the combination or the influence of other soil properties may influence the low correlations, as commented Valladares et al. (2003) when evaluating soils from different regions of Brazil. This may explain why only part of the BE results is attributed to Fe (Figure 2).
Note the positive correlation between MPAC and SOM (Table 4), which may be explained by the possible
formation of ternary complexes involving P and the cations of the sorption complex of the soils (MCBRIDE, 1994).This correlation also reflected in the PCF (Table 4), clearly demonstrating the interdependence of these attributes. SOM able affect the MPAC by different ways: competition, dissolution of adsorbents, complexation of metal ions and inhibition of poorly ordered aluminium and iron oxides (BORGGAARD et al., 1990; NEGASSA et al., 2008).
The clay content also correlated positively with MPAC (Table 4 and Figure 2), corroborating other studies that indicate high P sorption in clayey soils (ROLIM NETO et al., 2004; SOUZA et al., 2006). According to Novais and Figure 2 – Principal component analysis and distribution of soils in function of components.
Smyth (1999), in more clayey soils there is a greater amount of Lewis acid sites, thereby facilitating the sorption of phosphorus.
The TH and TP1 soils showed the highest PCF values, 19.0 and 16.7, respectively, followed by RA, TP2 and RH1 with intermediate values (Table 3) and the lowest values were observed for the TQ, RH2 and RH3 soils. This diversity is related to variations in the physical, chemical and mineralogical properties of the soils and their interactions (Tables 1 and 2). The PCF is defined by the equilibrium between the variation of labile P and solution P. The TH,TP1, RA, TP2 and RH1 soils (higher PCF values) help to maintain the levels of P in the solution close to the equilibrium level, when these soils receive P fertilization or have the P removed by crops. The TQ, RH2 and RH3 soils require higher levels of P in solution to supply the demand of the plants, because the replacement of this nutrient to the solution, via labile P, is much lower (NOVAIS; SMYTH, 1999).
The PCF was positively correlated with SOM, clay, silt, sum of bases, CEC, pH and BE and negatively with sand content (Table 4). Souza et al. (2006) found similar results with respect to the SOM, which is probably due to its close association with the clay fraction. Thus, one should use caution with information regarding the organic matter content isolated in the PCF.
The pH has an indirect importance in sorption process of the soil (TIRLONE et al., 2009), because with
increasing pH, soil particles become more electronegative, which favors a decrease in the P sorption (BARROW, 1985). In the present work, the pH was positively correlated with the sorption of P (Figure 2), in line with data from Vasconcellos et al. (1974). These results support the correlation obtained with the SOM and is supported by the possible formation of ternary complexes involving P and cations of the sorption complex of the soil (McBRIDE, 1994). The sand fraction showed negative linear behavior for MPAC and PCF in accordance with Broggi et al. (2011), the explanation being related to the quartz diluting effect on soil behavior (KÄMPF; CURI, 2012).
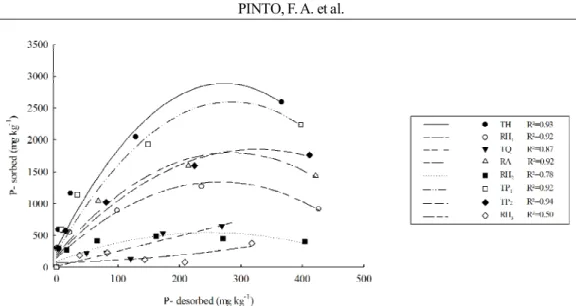
The correlation between the levels of P-sorbed and P-desorbed (Figure 4) facilitates understanding the PCF result (Table 3), which represents the flow of the P-sorbed into the soil solution, maintaining it at constant levels. A high PCF allows lower variations of the P levels in the soil solution, due to replacement of this nutrient; lower PCF represents lower ability of this supply. This ability is conditioned by binding energy, formation of complex ball inside, anion phosphate with oxides (VILAR et al., 2010). Therefore, soils with lower MPAC also feature low PCF, percentage of the content of P-sorbed can be released during desorption (P-labile) (Figure 4). In the presence of higher MPAC there is the supply of P for a longer period, because the P-solution is supplied byP-sorbed and this will only be zero when the same (quantity factor) is also zero (NOVAIS et al., 2007).
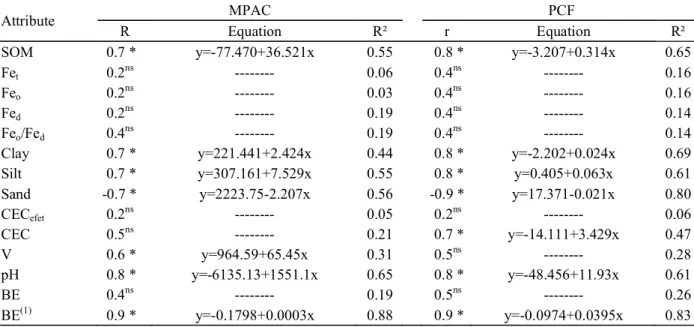
Table 4 – Simple linear correlation coefficients (r) and linear regressions between maximum phosphorus adsorption capacities (MPAC), phosphorus capacity factors (PCF) and some chemical and physical properties of soils.
(1) Correlation without RA soil; * and ns, significant and non-significant at 5%, respectively.
Attribute MPAC PCF
R Equation R² r Equation R²
SOM 0.7 * y=-77.470+36.521x 0.55 0.8 * y=-3.207+0.314x 0.65
Fet 0.2ns --- 0.06 0.4ns --- 0.16
Feo 0.2ns --- 0.03 0.4ns --- 0.16
Fed 0.2
ns
--- 0.19 0.4ns --- 0.14
Feo/Fed 0.4
ns
--- 0.19 0.4ns --- 0.14
Clay 0.7 * y=221.441+2.424x 0.44 0.8 * y=-2.202+0.024x 0.69
Silt 0.7 * y=307.161+7.529x 0.55 0.8 * y=0.405+0.063x 0.61
Sand -0.7 * y=2223.75-2.207x 0.56 -0.9 * y=17.371-0.021x 0.80
CECefet 0.2ns --- 0.05 0.2ns --- 0.06
CEC 0.5ns --- 0.21 0.7 * y=-14.111+3.429x 0.47
V 0.6 * y=964.59+65.45x 0.31 0.5ns --- 0.28
pH 0.8 * y=-6135.13+1551.1x 0.65 0.8 * y=-48.456+11.93x 0.61
BE 0.4ns --- 0.19 0.5ns --- 0.26
Figure 4 – Quadratic equations trend lines between P-sorbed and P-desorbed P under different concentrations of added P for the selected soils. (TH) - Typic Hapludox; (RH1) - Rhodic Hapludox; (TQ) - Typic Quartzipsamment; (RA) - Rhodic Acrudox; (RH2) - Rhodic Hapludox; (TP1) - Typic Plinthaquox; (TP2) - Typic Plinthaquox; (RH3) Rhodic Hapludox.
The desorption of P has a direct relationship with the content of P-sorbed (Figure 4).In the sandier soils (TQ, RH2 and RH3) the P-desorbed contents were close to the sorbed content, since these soils had low P sorption in the concentrations to which they were submitted, confirmed by the low PCF values (Table 3). This fact indicates that these soils have a high capacity for releasing labile P to the soil solution, which for these soils, may indicate the possibility of loss of P from the soil system, because of its high potential for leaching facilitated by the sandier texture. The remaining soils had lower levels of P-desorbed (Figure 4), and the TH sorbed over 2500 mg kg-1 and released less than 400 mg
kg-1 into the soil solution, demonstrating the high
affinity of P for the mineral constituents of this soil. Guilherme et al. (2000) found similar results in which soils with higher MPAC and PCF showed lower levels of P-desorbed.
CONCLUSIONS
This work showed that P-sorption phenomena and P-availability depends on the interaction of soil attributes. The use of only clay content for phosphorus interpretation and recommendation in soils may lead to misunderstanding in the soil fertility management, especially in tropical soils. The use of only one soil attribute, the clay content, as a cr iter ion for recommen dation of ph osph ate fertilization phosphorus is susceptibleto errorsand should be adjusted to each particular condition.
ACKNOWLEDGMENTS
We thank CNPq for financial support (process n° 577559/2008-7) and research fellowship and CAPES scholarship to the first author.
REFERENCES
ANDA, M. et al. Mineralogy and factors controlling charge development of three Oxisols developed from different parent materials. Geoderma, Amsterdam, v. 143, n. 1/2, p. 153-167, 2008.
BARROW, N.J. Reaction of anions and cations with variable-charge soils. Advances in Agronomy, San Diego, v. 38, p. 183-230, 1985.
BECKWITH, R.S. Sorbed phosphate at standard supernatant concentration as an estimate of the phosphate needs of soils. Australian Journal of Experimental Agriculture and Animal Husbandry, Melbourne, v. 5, n. 16, p. 52-58, 1965.
BORGGAARD, O.K. et al. Influence of organic matter on phosphate adsorption by aluminium and iron oxides in sandy soils. European Journal of Soil Science. v. 41, n. 3, p. 443-449, 1990.
BRAGA, J.M.; DEFELIPO, B.V. Relações entre formas de fósforo inorgânico, fósforo disponível e material vegetal em solos sob vegetação de cerrado: I -Trabalhos de laboratório. Ceres, São Paulo, v. 19, p. 124-136, 1972.
BROGGI, F. et al. Fator capacidade de fósforo em solos de Pernambuco mineralogicamente diferentes e influência do pH na capacidade máxima de adsorção. Ciência e Agrotecnologia, Lavras, v. 35, n. 1, p. 77-83, 2011.
CESSA, R.M.A. et al. Área superficial específica, porosidade da fração argila e adsorção de fósforo em dois Latossolos Vermelhos. Revista Brasileira de Ciência do Solo, Viçosa, v. 33, p. 1153-1162, 2009.
CORRÊA, R.M.; NASCIMENTO, C.W.A.; ROCHA, A.T. Adsorção de fósforo em dez solos do Estado de Pernambuco e suas relações com parâmetros físicos e químicos. Acta Scientiarum. Agronomy, Maringá, v. 33, n. 1, p. 153-159, 2011.
EBERHARDT, D. N. et al. Influência da granulometria e da mineralogia sobre a retenção do fósforo em
Latossolos sob pastagem de cerrado. Revista Brasileira de Ciência do Solo, Viçosa, v. 32, n. 3, p. 1009-1016, 2008.
EMBRAPA. Manual de Análise de Químicas de Solo, Plantas e Fertilizantes.Brasília: Embrapa Informação Tecnológica, 2009. 627 p.
FARDEAU, J.C. Dynamics of phosphate in soils. An isotopic outlook. Fertilizer Research, The Hague, v. 45, n. 2, p. 91-100, 1996.
FEY, M.V.; DIXON, J.B. Rapid estimation of iron oxides in soils and clays by spectrophotometric analysis. Soil Science Society of America Journal, Madison, v. 47, n. 6, p. 1261-1263, 1983.
FONTES, M. P. F.; WEED, S. B. Phosphate adsorption by clays from Brazilian Oxisols: relationships with specific surface area and mineralogy. Geoderma, v. 72, n. 1, p. 37-51, 1996.
FOX, R.L.; KAMPRATH, E.J. Phosphate sorption isotherms for evaluating the phosphate requirements of
soils. Soil Science Society of America Proceedings, Madison, v. 34, n. 5, p. 902-907, 1970.
FOX, R.L.; SEARLE, P.G.E. Phosphate adsorption by soils of the tropics. In: DROSDOFF, M. Diversity of Soils in the Tropics. Madison: American Society of Agronomy, 1978. p. 97-119.
GUILHERME, L.R.G. et al. Adsorção de fósforo em solos de várzea do estado de Minas Gerais. Revista Brasileira de Ciência do Solo, Viçosa, v. 24, p. 27-34, 2000.
HERNÁNDEZ, J.; MEURER, E.J. Adsorção de fósforo e sua relação com formas de ferro em dez solos do Uruguai. Revista Brasileira de Ciência do Solo, Campinas, v. 22, p. 223-230, 1998.
HOLMGREN, G.G.S. A rapid citrate-dithionite extractable iron procedure. Soil Science Society of America Journal, Madison, v. 31, n. 2, p. 210-211, 1967.
HUANG, P. M. et al. Aluminum hydroxides. In: DIXON, J.B.; SCHULZE, D.G. Soil Mineralogy with
Environmental Applications. Madison: Soil Science Society of America, p.261-289, 2002.
HUNT, J. F. et al. Inhibition of phosphorus sorption to goethite, gibbsite, and kaolin by fresh and decomposed organic matter. Biology and Fertility of Soils, Berlin, v. 44, n. 2, p. 277-288, 2007.
JACKSON, M.L. Analisis quimico de suelos. Barcelona: Omega, p.282-309, 1982.
JUO, A.S.R.; FOX, R.L. Phosphate sorption capacity of some benchmark soils in West Africa. Soil Science, Madison, v. 124, p. 370-376, 1977.
KÄMPF, N.; CURI, N. Formação e evolução do solo (pedogênese). In: KER, J. C. et al. Pedologia: fundamentos. Viçosa: SBCS, 2012. p.
MCKEAGUE, J.A.; DAY, D.H. Dithionite and oxalate-extractable Fe and Al as aids in differentiating various classes of soils. Canadian Journal of Soil Science, Otawa, v. 46, n. 1, p. 13-22, 1966.
NEGASSA, W. et al. Influence of specific organic compounds on phosphorus sorption and distribution in a tropical soil. Soil Science, v. 173, n. 9, p. 587-601, 2008. NOVAIS, R.F.; SMYTH, T.J. Adsorção de fósforo no solo. In: NOVAIS, R.F.; SMYTH, T.J. Fósforo em solo e planta em condições tropicais.Viçosa: Universidade Federal de Viçosa, 1999. 399 p.
NOVAIS, R.F.; SMYTH, T.J.; NUNES, F.N. Fósforo. In: NOVAIS, R. F. et al. Fertilidade do Solo. Viçosa: SBCS, 2007. 1017 p.
PARDO, M. T.; GUADALIX, M. E.; GARCIA-GONZALEZ, M. T. Effect of pH and background electrolyte on P sorption by variable charge soils. Geoderma, Amsterdam, v. 54, n. 1/4, p. 275-284, 1992. POZZA, A. A. A. et al. Retenção e dessorção
competitivas de ânions inorgânicos em gibbsita natural de solo. Pesquisa Agropecuária Brasileira, Brasília, v. 42, n. 11, p. 1627-1633, 2007.
___________. Adsorção e dessorção aniônicas individuais por gibbsita pedogenética. Química Nova, São Paulo, v. 32, n. 1, p. 99-105, 2009.
RANNO, S.K. et al. Capacidade de adsorção de fósforo em solos de várzea no estado do Rio Grande do Sul. Revista Brasileira de Ciência do Solo, Viçosa, v. 31, p. 21-28, 2007.
RIBEIRO, B.T. et al. Cargas superficiais da fração argila de solos influenciadas pela vinhaça e fósforo. Química Nova, v. 34, n. 1, p. 5-10, 2011.
ROLIM NETO, F.C. et al. Adsorção de fósforo, superfície específica e atributos mineralógicos em solos
desenvolvidos de rochas vulcânicas do Alto
Paranaíba-MG. Revista Brasileira de Ciência do Solo, Viçosa, v. 28, p. 953-964, 2004.
SCHWERTMANN, U. Differenzierung der eisen oxide des bodens durch extraktion unit saurer ammoniumoxalat-losung. Zeitschrift fur pflanzenernaehr bodenkd, Weinheim, v. 105, p. 194-202, 1964.
SOUSA, D.M.G; LOBATO, E. Cerrado: correção do solo e adubação.Brasília: Embrapa Cerrados, 2004. 416 p. SOUZA, R.F. et al. Calagem e adubação orgânica: influência na adsorção de fósforo em solos. Revista Brasileira de Ciência do Solo, Viçosa, v. 30, p. 975-983, 2006.
STATSOFT. Statistica 7.0 Software. Tucksa, USA: StatSoft, 2005.
TIRLONE, C. et al. Disponibilidade de fósforo em função das adições de calagem e de um bioativador no solo. Ciência e Agrotecnologia, Lavras, v. 33, p. 977-984, 2009. UDO, E.J.; UZU, F.O. Characteristics of phosphorus adsorption by some Nigerian soils. Soil Science Society of America Journal, Madison, v. 36, n. 6, p. 879-883, 1972. USDA-NRCS. Soil Taxonomy - a basic system of soil classification for making andiInterpreting soil surveys. 2nd ed. Washington, D. C., USA: U.S. Government
Printing Office. 869p. (Agriculture Handbook: 436), 1999. VALLADARES, G.S.; PEREIRA, M.G.; ANJOS, L.H.C. Adsorção de fósforo em solos de argila de atividade baixa. Bragantia, Campinas, 62:111-118, 2003.
VASCONCELLOS, C.A. et al. Fósforo em dois latossolos do estado de Mato Grosso: I. sorção de fosfato.
Experientiae, Viçosa, v. 18, p. 267-285, 1974.