http://www.uem.br/acta ISSN printed: 1679-9275 ISSN on-line: 1807-8621
Doi: 10.4025/actasciagron.v37i4.25108
Chemical composition of grains from glyphosate-resistant soybean
and its conventional parent under different edaphoclimatic
conditions in Brazil
Letícia Carlos Babujia1,2*, Adriana Pereira Silva2, Polyana Batoqui França Biondo1, Juliana Carla Garcia1, José Marcos Gontijo Mandarino2 and Jesuí Vergilio Visentainer1
1
Departamento de Química, Universidade Estadual de Maringá, Av. Colombo, 5790, 87020-900, Maringá, Paraná, Brazil. 2Empresa Brasileira de Pesquisa Agropecuária, Londrina, Paraná, Brazil. *Author for correspondence. E-mail: [email protected]
ABSTRACT. Glyphosate-tolerant (Roundup Ready®, RR) soybean is the most widely cultivated
genetically modified crop in the world. The aim of this study was to evaluate, in a long-term field experiment, the chemical composition of grains in a pair of cultivars composed of the conventional parent (BRS 133) and the nearly isogenic transgenic (BRS 245RR) soybean. Plants were cropped under two different edaphoclimatic conditions in Brazil. The experiments began during the 2003/2004 growing season; samples were collected during the 2011/2012 harvest. Were quantified the contents of isoflavones (high performance liquid chromatography), fatty acids (gas chromatography), lipid and proteins (near infrared spectroscopy in the NIR - Near Infrared Reflectance) and minerals (atomic absorption flame spectrophotometry). All samples were analyzed in three replications. Major differences were observed between the two cultivation locations. In Ponta Grossa, which has lower temperatures and higher rainfall during the grain filling period, the contents of lipids and isoflavones were higher. In Londrina, which hassoil with higher fertility, the contents of minerals, proteins and carbohydrates in soybean grains were higher. Significant differences were observed between the cultivars. The conventional parent had higher protein contents and lower lipid contents. The transgenic soybean line had higher isoflavone contents.
Keywords: Glycine max,transgenic soybean crop, isoflavones, fatty acids, macro and micro minerals.
Composição química de grãos de soja resistente ao glifosato e sua respectiva parental
convencional em diferentes condições edafoclimáticas do Brasil
RESUMO. A soja resistente ao glifosato (Roundup Ready®, RR) representa a principal cultura
geneticamente modificada (GM) cultivada no mundo. O objetivo deste estudo foi avaliar, em um experimento de campo de longa duração, a composição química dos grãos das cultivares de soja parental convencional (BRS 133) e sua respectiva transgênica quase isogênica (BRS 245RR). Os experimentos foram realizados em duas condições edafoclimáticas distintas e tiveram início em 2003/2004 e as amostras foram coletadas na safra 2011/2012. Foram quantificados os teores de isoflavonas (cromatografia líquida de alta eficiência), ácidos graxos (cromatografia em fase gasosa), lipídeos e proteínas (espectroscopia no infravermelho próximo na NIR - refletância de infravermelho próximo) e minerais (espectrofotometria de absorção atômica de chama). Todas as amostras foram analisadas em triplicata. Foram observadas diferenças significativas entre os locais de cultivo. Em Ponta Grossa, que possui temperaturas menores e maior precipitação durante o enchimento de grãos, o conteúdo de lipídeos e isoflavonas foram maiores. Em Londrina, com solo de maior fertilidade, o conteúdo de minerais, proteínas e carboidratos foram maiores. Diferenças significativas foram associadas ao transgene RR. A cultivar BRS 133 apresentou maiores teores de proteínas e a BRS 245 RR maiores teores de lipídeos e isoflavonas.
Palavras-chave: Glycine max, cultura da soja transgênica, isoflavonas, ácidos graxos, macro e micro minerais.
Introduction
Soybean [Glycine max (L.) Merrill] has become the most important oil seed crop in the international market in recent decades (JAMES, 2013). In the 2012/2013 growing season, global soybean production was estimated to be 286 million tons. Production was highest in the United States, with
93 million tons produced from 31 million hectares. Production was second highest in Brazil, which produced 85 million tons from 28 million hectares (USDA, 2013).
soybean (also known as RR soybean) has undergone the insertion of the resistance gene 5-enolpyruvoil-shikimate-3-phosphato synthase (EPSPS, E.C. 2.5.1.19, CP4). This gene confers tolerance to the herbicide glyphosate (PADGETTE et al., 1995). However, glyphosate is absorbed and metabolized by plants and can alter secondary metabolism processes; this is because the endogenous EPSPS enzyme remains unaltered (REDDY et al., 2000).
According to the principle of substantial equivalence, foods produced from genetically modified grains (GM) are considered safe if they present no differences in comparison with foods produced from conventional grains. Theoretically, GM grains must have the same nutritional value as conventional grains for releaseto be approved. In addition to the effect of the transgene, the application of glyphosate may also significantly alter the chemical composition of soybean; the contents of minerals and phenolic compounds such as isoflavones may be altered (MILLSTONE et al., 1999).
Given the aforementioned context, it is important to continuously monitor the effects the long-term effects of the cultivation of transgenic plants in field studies. The nutritional quality of grains must be measured to ensure the environmental safety of this biotechnology. The aim of this study was to compare the chemical composition of grains from the following two soybean cultivars: a conventional parent (BRS 133) and anearly isogenic transgenic (BRS 245RR) genotype. The compositions of soybeans grown in two long-term experiments under different edaphoclimatic conditions in southern Brazil were determined.
Material and methods
Soybean [Glycine max (L.) Merr.] cultivar BRS 133 (a conventional parent non-transgenic genotype) and its nearly isogenic transgenic BRS 245 RR counterpart were cropped in two long-term experiments performed under two different edaphoclimatic conditions in southern Brazil. The first experiment was conducted in aneutrophic Red Latosol soil in Londrina, Paraná State (630 m altitude; 23°11’ S, 51°11’ W). The second experiment was conducted in a dystrophic Red Latosol soil in Ponta Grossa, which is also in Paraná State (886 m altitude; 25°09’ S, 50°04’ W). The experiments began in the 2003/2004 growing season and were performed in the same plots (with transgenic and non-transgenic soybean) every summer season. Non-transgenic wheat (Triticum
aestivum L.) was grown during the winter season. A
complete description of the field experiments was recently published (HUNGRIA et al., 2014). For
this study, sampling was carried out during the 2011/2012 growing season.
The experimental design consisted of randomized blocks. Initially, each treatment contained six replicates. Replicates were represented by combinations of transgenic and non-transgenic pairs of cultivars and treatment with herbicides. Overthe last six years before samples were taken for this study, the experiment was changed to 45 plots of transgenic soybean and 45 plots of non-transgenic soybean. A unique pair of cultivars was used (RR transgenic and its respective parent cultivar), and the 90 plots were treated equally with conventional herbicides. For this study, it was possible to analyze the effects of the RR transgene on grain composition. Samples from 18 field plots per treatment were harvested. Grains from six plots were homogenized to form one replicate; therefore, each treatment had three replicates. Grain samples were air dried to the desired moisture content.
Oil and protein contents were determined by spectroscopy in the near infrared region (NIR) with diffuse reflectance using the partial least squares (PLS) regression method. Genotype spectra were collected from intact seeds positioned in the integrating sphere of the NIR apparatus (Thermo Scientific Antaris II). Moisture and ash content were determined using the method of AOAC (2000). The carbohydrate content was estimated using the diference between these measurements [100 - (moisture + protein + oil + ash) (AOAC, 2000). Three replicates per treatment were analyzed. The results were expressed in mg 100 g-1.
To determine the mineral content, samples were burned in a muffle furnace at 600°C for 6-8h until complete organic matter decomposition occurred; recovery with a nitric acid solution (5%, v v-1) was then
performed (at approximately 90°C). The contents of K, Ca, Mg, Fe, Cu, Zn, Co, Mn, and Na were quantified using flame atomic absorption spectrophotometry (using Analytik Jena novAA 300 instrument with winAAS software). The results were expressed as mg 100 g-1. Samples were also analyzed in triplicate.
Isoflavone extraction was carried out according to the methodology described by Carrão-Panizzi et al. (2002). Isoflavones were extracted from defatted soy flour (DSF).
Isoflavones were separated and quantified according to the methodology described by Berhow (2002), with some modifications. Aliquots of 20 μL were automatically injected into a liquid chromatograph (Waters, 2690 model). For the separation, a C-18 reverse phase column (YMC-Pack
internal diameter of 4.6 mm. A binary gradient system was used. The mobile phase A was methanol containing 0.025% trifluoroacetic acid (TFA), and phase B was ultrapure water containing 0.025% TFA. The initial gradient conditions were 20% phase A, which reached 90% with in 35 min. This was followed by a column cleaning procedure with 100% phase A for 5 min. The column was then returned to its initial condition of 20% phase A. The total time taken for this analysis was 60 min. The flow rate of the mobile phase was 1.0 mL min-1. The
temperature was maintained at 25°C.
To detect isoflavones, a photodiode array detector (Waters, W 996 model) with the wavelength adjusted to 260 nm was used. Millennium 32 software (version 3.05.01) (GCLC®
Toronto, Pickering, ON, Canada) was used to control the equipment and acquire data.
To identify and quantify the peaks corresponding to 12 different isoflavones, calibration curves and linear regression based on the peak areas were used. Calibration curves were obtained using external standards for daidzin, daidzein, genistin, genistein, glycitin, glycitein, malonyl daidzin, malonyl genistin, malonyl glycitin, acetyl daidzin, acetyl genistin and acetyl glycitin dissolved in methanol (chromatographic grade) at the following concentrations: 6.25; 12.50; 25.00; 50.00 and 100.00 mg L-1. Isoflavone concentrations were expressed in
mg of each isoflavone per 100 g-1 of DSF.
Total lipids (TL) were determined using the Bligh and Dyer (1959) method. Fatty acid methyl esters (FAME) were prepared via the methylation of total lipids (TL), according to the method described by Hartman and Lago (1973). Methyl esters were separated by gas chromatography in a Thermo 3300 Scientific (Varian) gas chromatograph equipped with a flame ionization detector (FID) and a fused silica capillary column CP-Select CB-FAME 7420 (100 m x 0.25 mm id, 0.25 μm film thickness, Varian, USA). The carrier gas flow (H2) was 1.2, 30 mL min-1 N2 and a
minimum of 300 mL min-1 synthetic air (H 2). The
sample splitting rate was 1:100. The samples (2 μL) were injected in triplicate. The operation parameters were as follows: the detector temperature was 240°C, the injection port temperature was 230°C and the column temperature was 165°C, programmed to increase at 4°C min-1. to reach
235°C and to hold at this temperature for 14 min. for a running time of approximately 32 min. Peak areas were determined using ChromQuest 5.0 software (Varian). To identify the fatty acids, retention times were compared with those of standard methyl esters (Sigma, USA).
Quantification (in mg fatty acid g-1 of total lipids)
was performed using tricosanoic acid methyl ester as an internal standard (23:0) as described by Joseph and Ackman (1992). Theoretical flame ionization detector (FID) correction factor values were used to obtain concentration values (VISENTAINER, 2012). Fatty acid contents were calculated in mg g-1
of total lipids using the following equation:
FA = Ax x Wis x CFx / Ais x CFAE x WA
where:
FA is the mg of fatty acids per g of total lipids, AX is the peak area (fatty acids), AIS is the peak area of the internal standard (IS) methyl ester of tricosanoic acid (23:0), WIS is the IS weight (mg) added to the sample (in mg), WX is the sample weight (in mg), CFX is the theoretical correction factor and CFAE is the conversion factor necessary to express results as mg of fatty acids rather than as methyl esters. The results were converted from mg fatty acid g-1 of total lipid to mg fatty acid g-1 per
seeds. Three replicates were analyzed per treatment. Analysis of variance was performed using ANOVA (GenStat® for Windows 8.0, VSN Int. Ltd, United Kingdom, 2005). Tukey’s test was performed to compare averages using the Statistica 7.0 program (StatSoft, USA). In addition, the data were analyzed by a multivariate technique using non-metric multidimensional scaling (NMS) (SOKAL, 1979), with Sorensen distances, using the program PC-ORD v 6.0 (McCUNE; MEFFORD, 2011) to evaluate the effects of the transgenic trait and the sites on the contents of isoflavones and fatty acids. The number of dimensions to be interpreted was selected considering the stress criteria and the stability of the graphical solutions. Variations among samples were characterized using Pearson correlation coefficients between the samples scores in the NMS axes 1 and 2 and the values of each isoflavone or fatty acid.
Results and discussion
observed was in the Ca level. Kwas the mostabundant mineral; the highest K value observed was 1826.11 mg 100 g-1, which was recorded in Londrina (LD 245 RR)
(Table 1).
Soybean grains grown in Londrina presented with higher levels of protein (41.30 g 100 g-1) than those in
grown in Ponta Grossa (38.70 g 100 g-1) (Table 2). This
finding may also be related to higher soil fertility (HUNGRIA et al., 2014). One major factor contributing to the higher level of protein observed in plants grown in Londrina is the higher soil pH (HUNGRIA et al., 2014). Mascarenhas et al. (1996) demonstrated that soil acidity decreases the concentration of protein in grains. Differences between the cultivars were also detected. The conventional line BRS 133 accumulated more protein than the transgenic line (Table 2). This finding might be related to the lower rates of biological nitrogen fixation observed in RR soybean cultivars (HUNGRIA et al., 2014).
The lipid content was significantly higher in plants grown in Ponta Grossa (21.14 g 100 g-1)
than those grown in Londrina (19.21 g 100 g-1)
(Table 2). The higher content of lipids in plants grown in Ponta Grossa in our study could be explained by rainfall patterns during the grain filling period. Dornbos and Mullen (1992) demonstrated that significant water stress during the grain filling period leads to lower lipid content and higher protein content. Rainfall was much greater in Ponta Grossa during this stage of development (Figure 1). The protein and lipid levels are determined by both the genotype and the environment (HOECK et al., 2000). Under water stress, plants may modify their metabolic pathways to produce more proteins instead of lipids. In contrast with the protein content, the lipid content was higher in the transgenic line BRS 245RR (Table 2). This might be attributed to the genetically determined trade off between the
accumulation of proteins and the accumulation of lipids in legume grains (BRIM; BURTON, 1979).
The carbohydrate content in plants grown in Londrina was higher than in plants grown Ponta Grossa. No differences in carbohydrate content could not be attributed to the presence of the transgene (Table 2).
Statistically significant differences in isoflavone contents were detected between the sowing locations and the soybean cultivars (Table 3). Among the isoflavones quantified, the highest concentrations were found in the crops grown in Ponta Grossa; the exceptions to this were daidzein and genistein, but both of these compounds contributed little to the total isoflavone concentration. The temperatures in Ponta Grossa are much lower than those in Londrina during the grain filling period. Soybeans cultivated under lower temperatures accumulate higher concentrations of isoflavones. In addition, the transgenic cultivar BRS 245RR contained higher concentrations of all isoflavones than the parent cultivar at both locations (Table 3).
In both genotypes and at both sites, the isoflavones malonyl genistin and malonyl daidzin were present at the highest concentrations (Table 3). Similar results have been reported in other studies (CARRÃO-PANIZZI et al., 1998, 1999; LEE et al., 2003). Low concentrations of the aglycones (daidzein and genistein) were detected. In aprevious study by CARRÃO-PANIZZI et al. (2009), the concentrations of daidzein, glycitein and genistein were very low or undetectable.
Isoflavone contents may undergo changes according to the genotype, soil type, and the climate condition (CARRÃO-PANIZZI et al., 1999; HOECK et al., 2000). In our study, the higher isoflavone contents found in plants grown in Ponta Grossa may be due to both lower temperatures and the higher rainfall observed at this site during the grain filling stage (Figure 1).
Table 1. Mean mineral contents of the transgenic soybeancultivar BRS 245RR and the conventional parentcultivar BRS 133 cropped in Ponta Grossa (PG) and Londrina (LD), Paraná State, Brazil.
Treatment Fe Cu Zn Mn
(mg 100 g-1 dried grains)
BRS 245RR (PG) 3.44 ± 0.23 0.86 ± 0.12 3.28 ± 0.10 1.40 ± 0.06
BRS 133 (PG) 3.34 ± 0.33 0.76 ± 0.13 3.31 ± 0.14 1.38 ± 0.14
BRS 245RR (LD) 4.15 ± 0.74 1.25 ± 0.25 3.12 ± 0.64 2.02 ± 0.42
BRS 133 (LD) 4.59 ± 0.10 1.35 ± 0.08 3.49 ± 0.04 2.20 ± 0.10
PG 3.39 ± 0.06 0.81 ± 0.06 3.29 ± 0.02 1.38 ± 0.01
LD 4.37 ± 0.30 1.30 ± 0.07 3.30 ± 0.26 2.11 ± 0.12
BRS 245RR 3.97 1.06 3.40 1.79
BRS 133 4.05 1.13 3.38 1.83
Site (p) 0.000 0.00 0.000 0.00
Cultivar (p) 0.218 0.009 0.638 0.120
Site x cultivar (p) 0.896 0.327 0.522 0.270
Table 2. Proximate composition of the transgenic BRS 245RR and the parental BRS 133 conventional soybeans cropped in Ponta Grossa (PG) and Londrina (LD), Paraná State, Brazil.
Treatment Moisture Proteins Lipids Carbohydrates Ash
(g 100 g-1 dried grains)
BRS 245RR (PG) 9.99 ± 0.27 38.80 ± 0.53 21.19 ± 0.52 23.41 ± 0.54 6.45 ± 0.84
BRS 133 (PG) 9.34 ± 0.30 38.61 ± 0.54 21.09 ± 0.39 23.88 ± 0.33 6.69 ± 0.07
BRS 245RR (LD) 9.43 ± 0.17 40.62 ± 0.62 19.87 ± 0.39 25.26 ± 0.32 4.82 ± 0.09
BRS 133 (LD) 9.17 ± 0.22 41.68 ± 0.95 18.56 ± 0.52 25.74 ± 0.43 4.85 ± 0.01
PG 9.66 ± 0.46 38.70 ± 0.53 21.14 ± 0.45 23.64 ± 0.40 6.57 ± 0.16
LD 9.30 ± 0.19 41.30 ± 1.05 19.21 ± 0.81 25.50 ± 0.52 4.83 ± 0.02
BRS 245RR 9.71 ± 0.39 39.71 ± 1.09 20.53 ± 0.82 24.33 ± 0.86 5.64 ± 1.15
BRS 133 9.25 ± 0.12 40.30 ± 1.89 19.83 ± 1.38 24.81 ± 1.17 5.77 ± 1.30
Site (p) 0.186 0.000 0.000 0.000 0.000
Cultivar (p) 0.234 0.013 0.000 0.124 0.386
Site x cultivar (p) 0.325 0.001 0.000 0.129 0.245
Values are presented as mean ± SD (n = 3). Analysis of variance (p < 0.05).
Table 3. Isoflavones Values of the Transgenic BRS 245RR and the Parental BRS 133 Conventional Soybeans Cropped in Ponta Grossa (PG) and Londrina (LD), Paraná State, Brazil.
Treatments Daidzin Glycitin Genistin Malonyldaidzin Malonylglycitin
(mg isoflavones 100 g-1 dried and degreased grains)
BRS 245RR (PG) 22.73 ± 1.35 5.34 ± 0.70 11.93 ± 0.73 206.28 ± 6.15 24.20 ± 2.92
BRS 133 (PG) 18.23 ± 0.80 4.76 ± 0.28 10.19 ± 0.22 170.10 ± 6.13 22.71 ± 2.21
BRS 245RR (LD) 22.38 ± 2.22 4.92 ± 1.09 7.57 ± 0.44 105.85 ± 16.60 19.17 ± 3.77
BRS 133 (LD) 15.27 ± 1.17 3.54 ± 0.45 4.90 ± 0.45 80.58 ± 5.98 14.64 ± 2.13
PG 20.48 ± 2.54 5.05 ± 0.60 11.06 ± 1.04 188.19 ± 19.43 23.45 ± 2.65
LD 18.82 ± 4.04 4.23 ± 1.08 6.24 ± 1.43 93.22 ± 17.76 16.90 ± 3.78
BRS 245RR 22.58 ± 1.81 5.13 ± 0.93 9.75 ± 2.30 156.06 ± 52.74 21.68 ± 4.18
BRS 133 16.75 ± 1.80 4.15 ± 0.72 7.55 ± 2.72 125.34 ± 46.10 18.68 ± 4.64
Site (p) 0.00 0.00 0.00 0.00 0.00
Cultivar (p) 0.00 0.00 0.00 0.00 0.00
Site x cultivar (p) 0.01 0.08 0.00 0.04 0.10
Treatments Malonylgenistin Daidzein Genistein Total isoflavones
(mg isoflavones 100 g-1 dried and degreased grains)
BRS 245RR (PG) 239.45±10.75 1.68 ± 0.38 0.80 ± 0.11 512.41 ± 2.88
BRS 133 (PG) 208.59±7.84 1.40 ± 0.27 0.64 ± 0.08 436.62 ± 2.23
BRS 245RR (LD) 90.98±6.24 3.49 ± 0.70 1.18 ± 0.13 255.54 ± 3.90
BRS 133 (LD) 63.77±2.32 2.99 ± 0.60 0.90 ± 0.19 186.59 ± 1.66
PG 224.02±18.25 1.54 ± 0.35 0.72 ± 0.12 474.51 ± 5.58
LD 77.38±14.64 3.24 ± 0.68 1.04 ± 0.21 221.06 ± 5.45
BRS 245RR 165.21±76.32 2.59 ± 1.07 0.99 ± 0.22 389.97 ± 17.44
BRS 133 136.18±74.18 2.20 ± 0.93 0.77 ± 0.19 311.60 ± 16.41
Site (p) 0.00 0.00 0.00 0.00
Cultivar (p) 0.00 0.01 0.00 0.00
Site x cultivar (p) 0.29 0.49 0.11 0.03
Values are presented as mean ± SD (n = 3). Analysis of variance p < 0.05).
During this period, the minimum temperature at the Londrina site was 19.4°C, the maximum temperature was 29.7°C and the accumulated rainfall was 23.6 mm. The Ponta Grossa site had a minimum temperature of 17.0°C, a maximum of 26.6°C and an accumulated rainfall of 111.2 mm (Figure 1). Increases in the concentrations of isoflavones in soybean are strongly linked to lower temperatures during the grain filling period (CARRÃO-PANIZZI et al., 1998). Reduced levels are observed when the crop is grown in warmer locations (LEE et al., 2003).
The graphical ordination of the isoflavone profiles after NMS analysis confirmed that there were significant differences between both the sites (Ponta Grossa and Londrina) and the cultivars (BRS 245 RR and BRS 133) (Figure 2).
The correlation coefficients of the isoflavones and the NMS axes are presented in Table 4. Axis 1
and 2 of the NMS analysis explained 92.3 and 5.8% of the total variance in the data, respectively. Along NMS axis 1, there is a clear separation between the locations (Ponta Grossa and Londrina). Along NMS axis 2, it is possible to observe a separation due to the cultivar (transgenic or non-transgenic). This indicates that the crop location has amajor influence on the isoflavone content. The presence of the transgene also has an influence, although it is less marked.
Figure 1. Rainfall and the maximum and minimum temperatures (averagedover10 days) observed during the experiments in Londrina and Ponta Grossa, Paraná State, Brazil. The major grain filling period was from 2/1/2012 to 3/1/2012.
Figure 2. Differences in isoflavone contents in different soybean cultivars and at different cropping sites in accordance with the NMS ordination.
Table 4. Correlation coefficient (r) between variables (isoflavones) and the first two ordination axes from NMS analysis.
Variable Axis 1 Axis 2
G-Daidzin 0.487 0.837 ***
G-Glycitin 0.656*** 0.541***
G-Genistein 0.954*** 0.173
Malonyldaidzin 0.971*** 0.064
Malonylglycitin 0.857*** 0.331
Malonylgenistin 0.973*** -0.059
Daidzein -0.748*** 0.569 ***
Genistin -0.567*** 0.628 ***
***p < 0.05.
In general, genetically modified soybeans are the property of private companies; there is no access to the parent genotypes for comparison studies. Our study offers an important comparison, as the BRS 245RR cultivar was released in a partnership between Monsanto® and Embrapa. Therefore, a pair
of cultivars was available for our study. Another unique condition from our study is that the plots were grown with transgenic and non-transgenic soybeans over eight years. For the last six years, plots were treated with the same conventional herbicides. Differences could then be attributed exclusively to
the transgene. By comparing nearly isogenic cultivars and using several data analysis techniques, it was confirmed that the grains of the transgenic soybean cultivar BRS 245RR had higher isoflavone contents than the parent cultivar BRS 133. Therefore, the metabolic changes that result in increased isoflavone contents in glyphosate-tolerant genotypes should be studied.
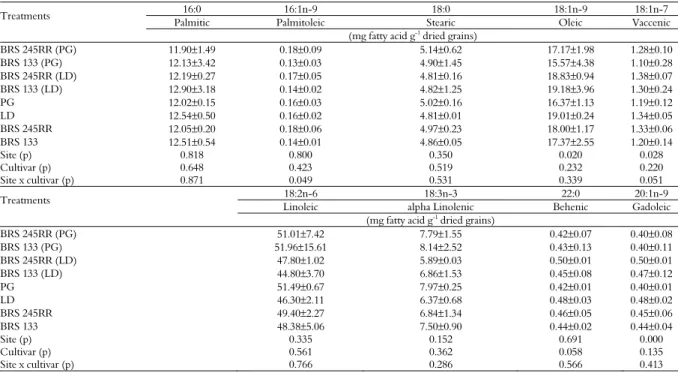
Among the fatty acids measuredin the crops studied, those found in the highest concentrations were linoleic acid (LA, 18:2n-9,12), oleic acid (18:1n-9) and palmitic acid (16:0) (Table 5). Similar values have been described in the literature (BÖHN et al., 2014; PAUCAR-MENACHO et al., 2010). Of the nine fatty acids measured, palmitic (16:0), palmitoleic (16:1n-9), stearic (18:0), linoleic (18:2n-9,12), alpha linolenic (18:3n-9,12,15) and behenic acid (22:0) were present in the oil of seeds at similar concentrations, even though the two sites differed in latitude and minimum temperature. The contents of oleic (18:1n-9), vaccenic (18:1n-7) and gadoleic acid (20:1n-9) were significantly different between the two locations; the contents of these compounds were significantly higher in the seeds of plants grown in Londrina (Table 5). There were no significant differences in fatty acid contents between the transgenic and the non-transgenic cultivars (Table 5). In a study performed in Iowa (USA), one transgenic soybean variety presented with a higher palmitic acid (16:0) content and a lower linoleic acid (18:2n-6) content than the conventional cultivar (BÖHN et al., 2014). Therefore, further research must be performed to understand the differences in fatty acid composition due to the presence of the transgene.
The 1:1 omega-6 omega-3 (n-6- n-3) ratio has
changed in recent years. Western diets now provide a ratio of 10-20:1, with a reduction in this ratio being necessary (SIMOPOULOS, 2011). The n-6 n-3 ratio in the samples analyzed is within the acceptable values set by the World and Health Organization (WHO, 1973). BRS 245 RR grown in Ponta Grossa presented with better ratios compared to plants of the same cultivar grown in Londrina. The polyunsaturated fatty acids:saturated fatty acids (PUFA:SFA) ratios for all samples were above 0.45, which is the value recommended by the British National Health Service. Specialists recommend that, to maintain a balanced diet, the PUFA:SFA ratio must be above 0.4 (WOOD et al., 2008; HMSO, 1994).
(WILCOX; CAVINS, 1992). However, the enzymes involved in this process and the mechanisms that regulate their induction by temperature have still not been completely elucidated. According to Canvin (1965), higher minimum temperatures affect the activity of the enzyme desaturase. This enzyme is responsible for converting oleic acid into linoleic acid. Although not significant different, the content of the most abundant fatty acid, linoleic acid, was greaterin plants grown Ponta Grossa than those grown in Londrina. In contrast, oleic, vaccenic and gadoleic acid contents were greater in plants
grownin Londrina. Therefore, the effects of climate conditions on the metabolism of fatty acids should also be investigated further.
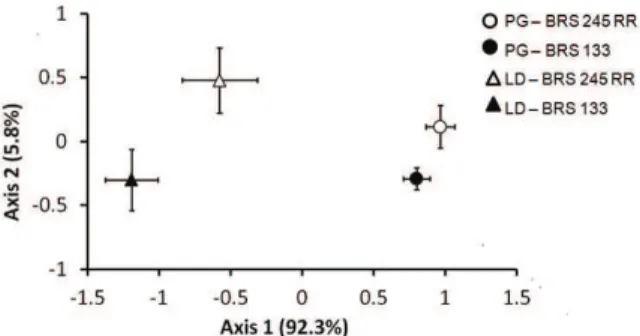
NMS ordination (Figure 3A and B) demonstrated that most of the data variability is represented on axis 1. On this axis, it can be observed that the fatty acid content varied according to the location and the cultivar. However, the NMS ordination was not as clear for the isoflavones data (Figure 2).
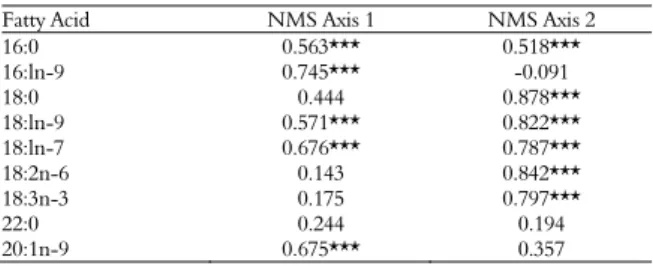
The majorfatty acids associated with axis 1 were palmitoleic acid (16:1n-9) and gadoleic acid (20:1n-9). Stearic acid (18:0) was the main fatty acid associated with axis 2 (Table 6).
Table 5. Mean fatty acid contents of the transgenic soybean cultivar BRS 245RR and the conventional parent cultivar BRS 133 grown in Ponta Grossa (PG) and Londrina (LD), Paraná State, Brazil.
Treatments 16:0 16:1n-9 18:0 18:1n-9 18:1n-7
Palmitic Palmitoleic Stearic Oleic Vaccenic
(mg fatty acid g-1 dried grains)
BRS 245RR (PG) 11.90±1.49 0.18±0.09 5.14±0.62 17.17±1.98 1.28±0.10
BRS 133 (PG) 12.13±3.42 0.13±0.03 4.90±1.45 15.57±4.38 1.10±0.28
BRS 245RR (LD) 12.19±0.27 0.17±0.05 4.81±0.16 18.83±0.94 1.38±0.07
BRS 133 (LD) 12.90±3.18 0.14±0.02 4.82±1.25 19.18±3.96 1.30±0.24
PG 12.02±0.15 0.16±0.03 5.02±0.16 16.37±1.13 1.19±0.12
LD 12.54±0.50 0.16±0.02 4.81±0.01 19.01±0.24 1.34±0.05
BRS 245RR 12.05±0.20 0.18±0.06 4.97±0.23 18.00±1.17 1.33±0.06
BRS 133 12.51±0.54 0.14±0.01 4.86±0.05 17.37±2.55 1.20±0.14
Site (p) 0.818 0.800 0.350 0.020 0.028
Cultivar (p) 0.648 0.423 0.519 0.232 0.220
Site x cultivar (p) 0.871 0.049 0.531 0.339 0.051
Treatments 18:2n-6 18:3n-3 22:0 20:1n-9
Linoleic alpha Linolenic Behenic Gadoleic
(mg fatty acid g-1 dried grains)
BRS 245RR (PG) 51.01±7.42 7.79±1.55 0.42±0.07 0.40±0.08
BRS 133 (PG) 51.96±15.61 8.14±2.52 0.43±0.13 0.40±0.11
BRS 245RR (LD) 47.80±1.02 5.89±0.03 0.50±0.01 0.50±0.01
BRS 133 (LD) 44.80±3.70 6.86±1.53 0.45±0.08 0.47±0.12
PG 51.49±0.67 7.97±0.25 0.42±0.01 0.40±0.01
LD 46.30±2.11 6.37±0.68 0.48±0.03 0.48±0.02
BRS 245RR 49.40±2.27 6.84±1.34 0.46±0.05 0.45±0.06
BRS 133 48.38±5.06 7.50±0.90 0.44±0.02 0.44±0.04
Site (p) 0.335 0.152 0.691 0.000
Cultivar (p) 0.561 0.362 0.058 0.135
Site x cultivar (p) 0.766 0.286 0.566 0.413
Values are presented as mean value ± SD (n = 3). Analysis of variance (p < 0.05).
Table 6. Correlation coefficients (r) between fatty acids content and NMS axis.
Fatty Acid NMS Axis 1 NMS Axis 2
16:0 0.563*** 0.518***
16:ln-9 0.745*** -0.091
18:0 0.444 0.878***
18:ln-9 0.571*** 0.822***
18:ln-7 0.676*** 0.787***
18:2n-6 0.143 0.842***
18:3n-3 0.175 0.797***
22:0 0.244 0.194
20:1n-9 0.675*** 0.357
*** p < 0.05.
Conclusion
Major differences were observed in the chemical composition of grains grown at the two locations. These differences were less pronounced between the two cultivars (transgenic and non-transgenic soybean varieties). Plants grown in Ponta Grossa presented with higher lipid and isoflavone contents. Plants grown in Londrina had higher minerals, protein and carbohydrate contents. The conventional parent cultivar had higher protein; however, this cultivar had a lower lipid content. In contrast, the transgenic soybean had higher isoflavone contents.
Acknowledgements
L.C. Babujia thanks Capes (National Council for the Improvement of Higher Education) for her PhD fellowship and M. Hungria is also a research fellow from CNPq (National Council for Scientific and Technological Development). Authors thank also to Dr. Allan R. J. Eaglesham for English review. Research partially financed by CNPq Universal (470515/2012-0).
References
AOAC-Association of Official Analytical Chemists.
Official methods of analysis of the Analysis of the Association Analytical Chemistry. 16th ed. Washington, D.C.: AOAC, 2000.
BERHOW, M. A. Modern analytical techniques for flavonoid determination. In: BUSLING, B. S.; MANTHEY, J. A. (Ed.). Flavonoids in the living cell. Advances in experimental medicine and biology, New York: Kluwer Academic, 2002. v. 505, p. 61-76.
BLIGH, E. G.; DYER, W. J. A rapid method of total lipid extraction and purification. Canadian Journal of Biochemistry and Physiology, v. 37, n. 8, p. 911-917, 1959.
BÖHN, T.; CUHRA, M.; TRAAVIK, T.; SANDEN, M.; FAGAN, J.; PRIMICERIO, R. Compositional differences in soybeans on the market: Glyphosate accumulates in Roundup Ready GM soybeans. Food Chemistry, v. 153, p. 207-215, 2014.
BRIM, C. A.; BURTON, J. W. Recurrent selection in soybeans. II Selection for increased percent protein in seeds. Crop Science, v. 19, n. 4, p. 494-498, 1979. CANVIN, D. The effect of temperature on the oil content and fatty acid composition of the oils from several seed crops.
Canadian Journal of Botany, v. 43, p. 63-69, 1965.
CARRÃO-PANIZZI, M. C.; FAVONI, S. P. G.; KIKUCHI, A. Extraction time for isoflavone determination. Brazilian Archives of Biology and Technology, v. 45, n. 4, p. 515-518, 2002.
CARRÃO-PANIZZI, M. C.; BELÉIA, A. D. P.; KITAMURA, K.; OLIVEIRA, M. C. N. Effects of genetics and environment on isoflavone content of soybean from different regions of Brazil. Pesquisa Agropecuária Brasileira, v. 34, n. 10, p. 1787-1795, 1999.
CARRÃO-PANIZZI, M. C.; BERHOW, M.; MANDARINO, J. M. G.; OLIVEIRA, M. C. N. Environmental and genetic variation of isoflavone content of soybean seeds grown in Brazil. Pesquisa Agropecuária Brasileira, v. 44, n. 11, p. 1444-1451, 2009.
CARRÃO-PANIZZI, M. C.; KITAMURA, K.; BELÉIA, A. D.; OLIVEIRA, M. C. N. Influence of growth locations on isoflavone contents in Brazilian soybeans cultivars. Breeding Science, v. 48, p. 409-413, 1998. DORNBOS, D. L.; MULLEN, R. E. Soybean seed protein and oil contents and fatty acid composition adjustments by drought and temperature. Journal of the American Oil Chemists’ Society, v. 69, n. 3, p. 228-231, 1992.
HARTMAN, L.; LAGO, R. C. A. Rapid preparation of fatty acids methyl esters. Laboratory Practice, v. 22, n. 4, p. 475-476, 1973.
HMSO-England Department of Health. Nutritional aspects of cardiovascular disease. London: HMSO, 1994. (Report on Health and Social Subjects, 46).
HOECK, J. A.; FEHR, W. R.; MURPHY, P. A.; WELKE, G. A. Influence of genotype and environment on isoflavone contents of soybean. Crop Science, v. 40, n. 1, p. 48-51, 2000.
HUNGRIA, M.; MENDES, I. C.; NAKATANI, A. S.; REIS-JUNIOR, F. B.; MORAES, J. Z.; OLIVEIRA, M. C.; FERNANDES, M. F. Effects of glyphosate-resistant gene and herbicides on soybean crop: I. Field trials monitoring biological nitrogen fixation and yield. Field Crops Research, v. 158, p. 43-54, 2014.
JAMES, C. Global status of commercialized biotech/GM Crops: 2013. Ithaca: ISAAA, 2013. (ISAAA Brief no. 46)
JOSEPH, J. D.; ACKMAN, R. G. Capillary column gas-chromatographic method for analysis of encapsulated fish oils and fish oil ethyl-esters-Collaborative study. Journal of AOAC International Standard Methods, v. 75, n. 3, p. 488-506, 1992.
LEE, S. J.; YAN, W.; CHUNG, I. M. Effects of Year, Site, Genotype and their Interactions on Various Soybean Isoflavones. Field Crop Research, v. 81, n. 2-3, p. 181-192,
2003.
CARMELLO, Q. A. C. Efeito da calagem sobre a produtividade de grãos, óleo e proteína em cultivares precoces de soja. Scientia Agricola, v. 53, n. 1, p. 164-172, 1996.
McCUNE, B.; MEFFORD, M. J. PC-ORD: Multivariate analysis of ecological data. Version 6.0, Oregon: MjM Software, 2011.
MILLSTONE, E.; BRUNNER, E.; MAYER, S. Beyond ‘substantial equivalence’. Nature, v. 401, n. 6753, p. 525-526, 1999.
PADGETTE, S. R.; KOLACZ, K. H.; DELANNAY, X.; RE, D. B.; LAVALLEE, B. J.; TINIUS, C. N.; RHOADES, W. K.; OTERO, Y. I.; BARRY, G. F.; EICHOLTZ, D. A.; PESCHKE, V. M.; NIDA, D. L.; TAYLOR, N. B.; KISHORE, G. M. Development, identification, and characterization of a glyphosate-tolerant soybean line. Crop Science, v. 35, n. 5, p. 1451-1461, 1995.
PAUCAR-MENACHO, L. M.; AMAYA-FARFÁN, J.; BERHOW, M. A.; MANDARINO, J. M. G.; MEJIA, E. G.; CHANG, Y. K. A high-protein soybean cultivar contains lower isoflavones and saponins but higher minerals and bioactive peptides than a low-protein cultivar. Food Chemistry, v. 120, n. 1, p. 15-21, 2010. REDDY, K. N.; HOAGLAND, R. E.; ZABLOTOWICZ, R. M. Effect of glyphosate on growth, chlorophyll, and nodulation in glyphosate-resistant and susceptible soybean
(Glycine max) varieties. Journal of New Seeds, v. 2, n. 1,
p. 37-52, 2000.
SIMOPOULOS, A. P. Evolutionary aspects of diet: The omega-6 omega-3 Ratio and the Brain. Molecular
Neurobiology, v. 44, n. 2, p. 203-215, 2011.
SOKAL, R. R. Testing statistical significance of geographic variation patterns. Systematic Zoology, v. 28, n. 2, p. 227-232, 1979.
USDA-United States Department of Agriculture -
Soybean area, yield, and production. Available from: <http://www.fas.usda.gov/psdonline/psdreport.aspx?hidR eportRetrievalName=BVS&hidReportRetrievalID=906& hidReportRetrievalTemplateID=1>. Access on: July 18, 2013.
VISENTAINER, J. V. Aspectos analíticos da resposta do detector de ionização em chama para ésteres de ácidos graxos em biodiesel e alimentos. Química Nova, v. 35, n. 2, p. 274-279, 2012.
WILCOX, J. R.; CAVINS, J. F. Normal and low linolenic acid soybean strains: response to planting date. Crop Science, v. 32, n. 5, p. 1248-1251, 1992.
WOOD, J. D.; ENSER, M.; FISHER, A. V.; NUTE, G. R.; SHEARD, P. R.; RICHARDSON, R. I. Fat deposition, fatty acid composition and meat quality: A review. Meat Science, v. 78, n. 4, p. 343-358, 2008. WHO-World Health Organization. Energy and protein requirements. technical report series no. 522 Geneva: WHO, 1973.
Received on September 29, 2014. Accepted on December 1, 2014.