Implications of predictable and unpredictable environmental factors
in common bean VCU trials in Minas Gerais
Lidiane Kely de Lima1*, Magno Antonio Patto Ramalho2, Ângela de Fátima Barbosa Abreu3, Fernando Henrique Ribeiro Barrozo Toledo4 and Ricardo Augusto Diniz Cabral Ferreira2
Received 2 September 2013 Accepted 9 February 2014
Abstract – The aim of this study was to estimate the relative contribution of predictable and unpredictable environmental variations to the lines x environments interaction and verify if it is possible to reduce the number of evaluation environments of the Value for Cultivation and Use Trials (VCU) conducted in Minas Gerais, Brazil. We used grain yield data from 166 VCU trials of common bean conducted in the state from 2002 to 2012. Individual and joint analyses of variance of the environments were carried out for each two-year period and the contribution of each source of variation to total variation was estimated. Subsequently, ecovalence was used, and joint analyses of variance were made considering different numbers of environments by means of resampling. The source of variation that most contributes to the interaction is location. Reduction in the number of environments in the VCU trials is not a good strategy for recommendation of cultivars in Minas Gerais.
Key words: Phaseolus vulgaris L., quantitative genetics, agroecological zoning, phenotypic stability.
Crop Breeding and Applied Biotechnology 14: 146-153,2014 Brazilian Society of Plant Breeding. Printed in Brazil
ARTICLE
http://dx.doi.org/10.1590/1984-70332014v14n3a22
1 Universidade Federal Rural do Semi-Árido, Departamento de Ciências Vegetais, 59.625-900, Mossoró, RN, Brazil. *E-mail: [email protected] 2 Universidade Federal de Lavras, Departamento de Biologia, CP 3.037, 37.200-000, Lavras, MG, Brazil.
3 Embrapa Arroz e Feijão, Caixa Postal 179, 75.375-000, SantoAntônio de Goiás, GO, Brazil
4 Universidade de São Paulo, Escola Superior de Agricultura “Luiz de Queiroz”, Departamento de Genética, 13.418-900, Piracicaba, SP, Brazil INTRODUCTION
The grain yield phenotype depends on the genotype, the environment, and the genotypes x environments interaction. The growth environment of common bean in the state of Minas Gerais, Brazil, is highly diverse as a result of the type of farmer (which ranges from typical subsistence farmers to large rural entrepreneurs), the sowing season, and innumer-able edaphic and climatic variations of the 853 common bean producing municipalities in the state (IBGE 2007).
This effect of the environment on the performance of lines/cultivars of common bean is widely known (Pereira et al. 2010, Silva et al. 2011, Torga et al. 2013). If there is genetic variation among the lines, associated with the wide environmental variation already mentioned, the genotypes x environments interaction is expressive. Studies undertaken in Minas Gerais highlight this fact (Ramalho et al. 1998, Silva et al. 2011).
To mitigate the effect of the lines x environments interac-tion, the main alternative is to conduct the line evaluation experiments in the greatest number of environments. That
way it is possible to identify the lines with greatest adapt-ability, stadapt-ability, and yield, i.e., lines that are in keeping with the mean value of the environment, or better, that always perform above the mean value. Countless studies have already been performed for the purpose of identify-ing common bean lines/cultivars that are more adapted and stable (Pereira et al. 2009, Rocha et al. 2010).
by MAPA, seeking to include the main producing regions. In general, this number is around 40. As these experiments are costly, it is frequently questioned whether this number of environments could be reduced, drawing near to that proposed by the VCU regulations.
The aim of this study was to respond to these questions, estimating the lines x environments interaction and the contribution of different sources of variation – crop season, locations, and year – using data from the VCU experiments conducted in Minas Gerais in the period from 2002 to 2012.
MATERIAL AND METHODS
Grain yield data were used from four cycles of the Value for Cultivation and Use (VCU) trials for carioca type common bean, conducted in the state of Minas Gerais by Embrapa Arroz e Feijão, the Universidade Federal de Lavras, the Universidade Federal de Viçosa, and the Empresa de Pesquisa Agropecuária do Estado de Minas Gerais, in the period from 2002 to 2012. The data were derived from experiments VCU 2002/2004, 2007/2009, 2005/2006 and 2010/2012. These trials were conducted in various sites of the state of Minas Gerais in the three different crop seasons and two years. The number of lines varied among the trials, with 20 in 2002/2004, 25 in 2005/2006 and in 2010/2012, and 26 in 2007/2009. All the experiments contained two controls, cultivars recommended for the state of Minas Gerais.
The experiments were conducted according to the regulations established by MAPA for the VCU of common bean (Brasil 2006) using a randomized block experimental design with three replications, and plots composed of four rows of 4 m length, spaced at 0.5m. The data in regard to grain yield were obtained considering the two center rows.
The data from each environment were subjected to analysis of variance, and the mean values were obtained. Accuracy (rgg) was estimated for each experiment through the expression rggrg= (1−(1/F), in which F is the value of the F test of the line source of variation (Resende and Duarte 2007). The Pearson correlation was also estimated between the mean value and the value of the F test of the line source of variation of each experiment.
Joint analyses of variance were carried out. Due to the heterogeneity of the variances of the errors, the Cochran (1954) procedure was used. The breakdown of the line x environment source of variation was also carried out for each two-year period and each year within the two-year period. We estimated the contribution of each source of variation to the total variation (R2) through the expression R2
i = SQi/ SQt, in which SQi is the sum of squares of each source of
variation, and SQt is the total sum of squares.
To establish an agroecological zone and verify whether it would be possible to reduce the number of environments based on this zone, the ecovalence estimates were obtained (Wricke 1965). In this case, the contribution of the interac-tion was obtained for each environment instead of for each genotype as is normal done. Subsequently, the relative ecovalence (Wr) was obtained for each environment and the arithmetic mean of Wr for each mesoregion.
Seeking to verify the predominant type of interaction in the Value for Cultivation and Use trials, the environments with greater and lesser contribution to the interaction in each cycle were used, and the interaction was broken down into simple and complex parts per VCU through the expression presented by Ramalho et al. (2012).
In addition, joint analyses of variance were carried out considering different numbers of environments. The resampling method was used in the following manner: an algorithm on the data spreadsheet sampled p environments of evaluation, without replacement, performed analysis of variance, and stored the following estimates: mean square of the interaction, mean square of lines, and which of the three lines had the best performance in the mean of the p
environments.
The number of situations for each number of environ-ments sampled is a function of the combination of the total number of environments and of the number of sampled environments n!/(n – p)!p!, in which n is the total number of environments and p is the number of sampled environ-ments. For p values in which the number of situations is less than 1000, all the respective analyses were made. In the other cases, the algorithm carried out 1000 situations. The number of environments (p) ranged from two to 43 in the VCU trials of 2002/2004 and 2007/2009, from two to 42 in the VCU of 2005/2007, and from two to 38 in the VCU of 2010/2012. All the analyses were carried out and/ or implemented using the software R (R Development Core Team 2011).
RESULTS AND DISCUSSION
Duarte 2007). The percentage of environments in which it was not possible to discriminate the lines, i.e., in which the value of the F test was not significant, is shown in Table 1. Observe that the value was greater than 30%. Accuracy is obtained by the estimator rgg =
F 1 1
r = − . Thus, the occurrence
of a low accuracy estimate in environments was probably because it was not possible to detect a difference between the lines, and/or the experimental error was large.
The criterion so that an experiment for evaluation of lines be included in the VCU is that it exhibit an F test significant for the line source of variation and/or coefficient of varia-tion (CV) less than 25% (Brasil 2006). The use of the CV as a measure of experimental precision has been greatly questioned (Cargnelutti Filho and Stork 2007, Resende and Duarte 2007). Thus, the use of the accuracy estimate as a measure of experimental precision would be more appropri-ate, as suggested by Resende and Duarte (2007), for it allows
one to view the two criteria for the decision of whether to use the data obtained in the VCU experiments or not. In other words, if the estimate of rgg is high, it implies good precision and that there is a significant difference among lines. If it is low, it may be inferred that the experimental precision was not good and/or it was not possible to detect a significant difference among lines.
Considering that 24 lines are evaluated (the mean number of lines evaluated in the period from 2002 to 2012 with three replications), to be significant (P≤0.05) the F test must have a value greater than 1.76. In this situation, the accuracy estimate is 66%. In other words, only experi-ments whose accuracy is greater than this value should be considered. Using this criterion, in the mean of the four two-year periods of the VCU trials, 36% of the experiments should be eliminated.
Some breeders have reported that very favorable envi-ronments, without stresses, logically show a high general mean value, but they do not discriminate the lines and, consequently, are not useful in the context of the VCU trials. To verify if this observation is pertinent, the correlation was estimated between the overall mean of the experiments and the magnitude of the F test (Table 1). Observe that it was always negative, but of small and non-significant magnitude, showing that this report is not pertinent.
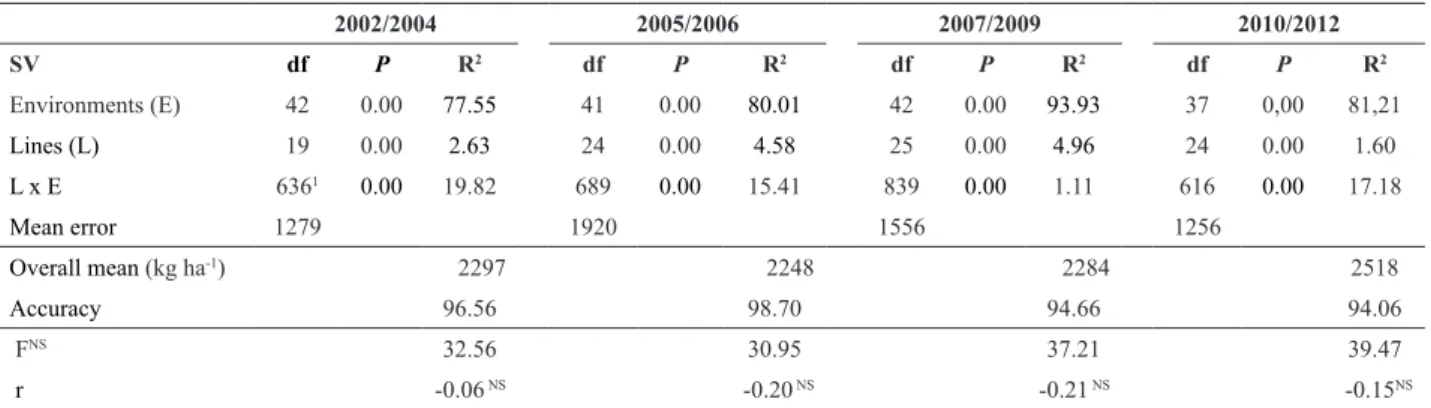
In joint analysis, the accuracy estimate, in all the two-year periods, was greater than 94%. As mentioned above, this indicates high experimental precision. This fact contributed to a significant difference (P≤0.01) being detected for all the sources of variation (Table 1). The contribution of the sum of squares of the line source of variation to the total sum of squares (R2) was very small. This fact has been observed
in other experiments of this nature (Pereira et al. 2010,
Table 1. Summary of joint analysis of variance of grain yield (kg ha-1), contribution of each source of variation to total variation (R2), percentage of
experiments in which the line source of variation was non-significant (FNS) and correlation (r) between the overall mean of the experiments and the
value of the estimate of the F test of the Value for Cultivation and Use trials of common bean lines.
2002/2004 2005/2006 2007/2009 2010/2012
SV df P R2 df
P R2 df
P R2 df
P R2
Environments (E) 42 0.00 77.55 41 0.00 80.01 42 0.00 93.93 37 0,00 81,21
Lines (L) 19 0.00 2.63 24 0.00 4.58 25 0.00 4.96 24 0.00 1.60
L x E 6361 0.00 19.82 689 0.00 15.41 839 0.00 1.11 616 0.00 17.18
Mean error 1279 1920 1556 1256
Overall mean (kg ha-1) 2297 2248 2284 2518
Accuracy 96.56 98.70 94.66 94.06
FNS 32.56 30.95 37.21 39.47
r -0.06 NS -0.20 NS -0.21 NS -0.15NS
1 Degree of freedom adjusted by the Cochran (1954) method.
Figure 1. Frequency distribution of the accuracy estimates, in percentage, of the VCU experiments. Grain yield data (kg ha-1) obtained in the VCU
Torga et al. 2013). In principle, this is expected because, especially in the case of the VCU trials conducted in Minas Gerais, the five or six best lines of the breeding programs of Embrapa Arroz e Feijão, UFV, and UFLA are involved; in other words, the lines that participate in the trials were extensively evaluated while they were being obtained, and they are results of high intensity of selection. In this condi-tion, the occurrence of a large variation between them is not expected. Significant differences between the lines are expected, above all under conditions of biotic and abiotic
stresses different from the conditions in which they were selected. The implications of the place of origin in which the common bean lines were selected on the magnitude of the lines x environments interaction were studied by Silva et al. (2011). The authors concluded that the location of origin does not influence the stability of the lines when their environmental conditions are similar to those of the grow-ing location, but it interferes in their performance when the environmental conditions are very different, which coincides with what was mentioned above.
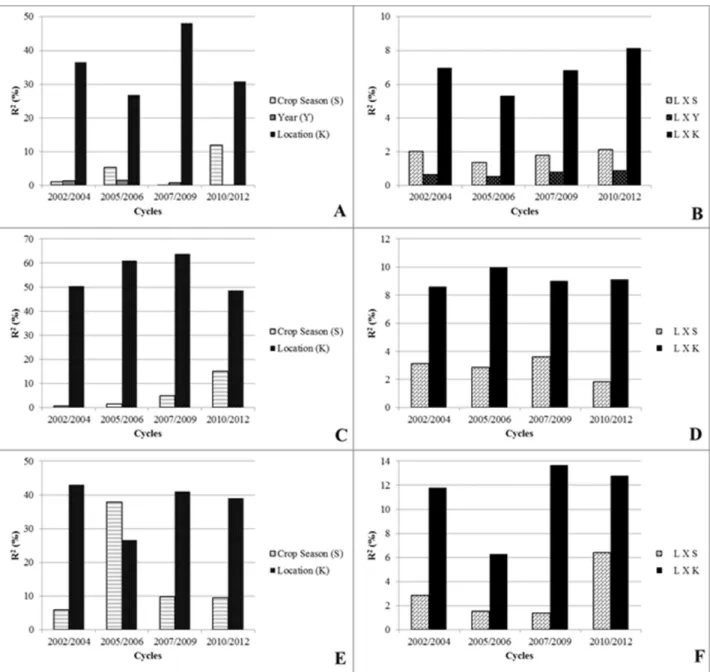
Figure 2. Estimates of the coefficients of determination (R2) for grain yield (kg ha-1) of the sources of variation of the VCU trials of common bean per
The difference among environments was expected be-cause they involved the three crop seasons / sowing times (which are quite different in terms of climatic conditions), the effect of years within each two-year period (which are normally quite variable), and, above all, locations (including practically all the common bean producing regions of the state). This is confirmed by the estimate of the contribution of the sum of squares of the environment source of variation to the total sum of squares (R2), which was greater than 77%
in all the two-year periods.
The contributions of the different sources of variation that compose the environments are shown by the coef-ficients of determination (R2) in Figure 2. The year source
of variation, analysis per two-year period, contributed very little to the total sum of squares, indicating that there was no expressive variation from one year to another.
In each year, the VCU trials were conducted in three crop seasons. There is the rainy season, with sowing from October to the beginning of December, occurring in a period of high temperatures and rainfall, dispensing irrigation. In this crop season, there is a high probability of harvest coin-ciding with intermittent precipitation/rainfall. There is the dry season, with sowing from the end of January to March. Finally, there is the fall-winter crop season, with sowing from May to the beginning of August, depending on the region, and which is kept under irrigation due to the scarcity and poor distribution of rain in the period, allowing harvest in a period free of rain, resulting in a high grain quality. Gener-ally, when sowing is in July, with the objective of the crop escaping the rigors of the cold during the reproductive cycle, the big disadvantage is that harvest may coincide with the rainy season. Although the environmental conditions of the crop season are quite distinct, they contributed little to the total variation (Figure 2A, 2C), except for the second year of evaluation of the 2005/2006 two-year period, where the
crop season source of variation was responsible for most of the variation (Figure 2E).
Using the 2002/2004 VCU trials as a example, 44% of the experiments were carried out in the fall-winter crop season, 40% in the dry season, and only 16% in the rainy season, a tendency which was observed in the other VCU trials. Nevertheless, according to data from CONAB (2012), in Minas Gerais, the greatest common bean production oc-curs in the rainy crop season. As the lines x crop seasons interaction was not expressive, the results obtained in the other crop seasons, which concentrate most of the experi-ments, may be extrapolated to the rainy crop season.
Among the sources of variation, a great highlight of locations was observed. They were responsible for a large part of the total sum of squares of the sources of variation involved. This observation is valid in the analysis by two-year period and also in that made by a two-year within two-two-year period. The locations of the experiments comprise from four (VCU 2010/2012) to six mesoregions (VCU 2002/2004) and differ not only in soil fertility, but also in management and climate conditions. Studies carried out in other condi-tions using crop seasons, locacondi-tions, and years also showed that the location source of variation was that which most contributed to total variation (Ramalho et al. 1998, Silva et al. 2011).
The lines x environments interaction was significant; however, in this study, its contribution to the total variation was less than 20% in all the VCU cycles (Table 3). The genotypes x environments interaction has been studied a great deal in the common bean crop (Silva et al. 2011, Torga et al. 2013). The lines x locations interaction was the most expressive, confirming the need to undertake evaluations in the greatest number of locations possible.
One question which has been little examined is whether
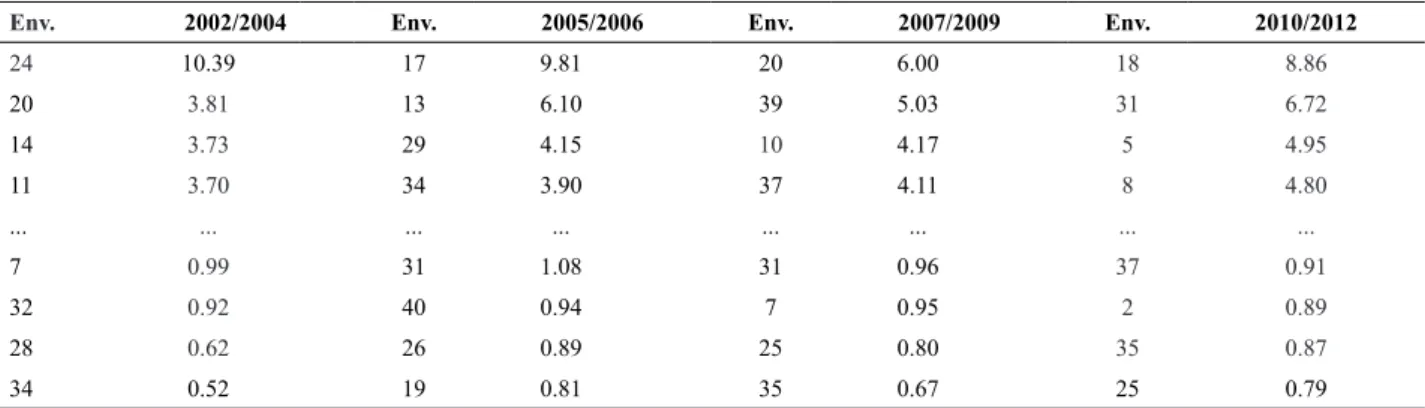
Table 2. Environments of greater and lesser relative ecovalence of the Value for Cultivation and Use trials of common bean lines for grain yield (kg ha-1)
Env. 2002/2004 Env. 2005/2006 Env. 2007/2009 Env. 2010/2012
24 10.39 17 9.81 20 6.00 18 8.86
20 3.81 13 6.10 39 5.03 31 6.72
14 3.73 29 4.15 10 4.17 5 4.95
11 3.70 34 3.90 37 4.11 8 4.80
... ... ... ... ... ... ... ...
7 0.99 31 1.08 31 0.96 37 0.91
32 0.92 40 0.94 7 0.95 2 0.89
28 0.62 26 0.89 25 0.80 35 0.87
the number of environments in which the VCU trails in Minas Gerais are carried out is sufficient. This is generally undertaken by means of agroecological zoning. However, for common bean, few studies are found in this respect (Bertoldo et al. 2009, Pereira et al. 2010). In the present study, some alternatives were used to infer if the number of environments is sufficient. One of them was the use of ecovalence (Wricke 1965). In Table 2 are the environments of greater and lesser contribution to the interaction in each two-year period of VCU trials. Note that within each VCU cycle, one of the environments exhibited an expressive con-tribution to the interaction - in the case of VCU 2002/2004, environment 24; in VCU 2005/2006, environment 17; in VCU 2007/2009, environment 20; and in VCU 2010/2012, environment 18. The other environments made a small contribution to the interaction. Based on this methodology, the number of environments, in principle, could be reduced. We sought to determine which type of interaction pre-dominates when the environment with greater and lesser contribution to the interaction is considered. It was observed that for VCU 2002/2004, for example, the contribution of complex interaction was greater than 73%. An important observation is that all the environments with greater contribu-tion to the interaccontribu-tion (Wr) belong to the mesoregion of the Zona da Mata, and environments 20 and 18 refer to the same site, Coimbra, indicating that this is the mesoregion with the greatest contribution to the interaction (Table 2). This fact may be confirmed by observing Table 3, in which the mean relative ecovalence per mesoregion is shown. Note that the Zona da Mata showed the greatest mean relative ecovalence among the mesoregions in all the VCU trials. Nevertheless, although it represents a great deal to the interaction, it is responsible for only 6.6% of common bean production in the state (IBGE 2007). It may be concluded that, in spite of the occurrence of the expressive interaction, the number of experiments carried out in the Zona da Mata is sufficient.
Joint analyses of variance were simulated considering different numbers of environments. This number ranged from
two up to the total number in each VCU. In the simulations, the mean values of the lines and their classification were obtained. The percentage of coincidence among the best lines identified in the analysis in all the environments in the 1000 simulations in each set of environments is shown in Figure 3A. Observe that when two environments were considered, the coincidence was only 11% in the mean of the four two-year periods of the VCU trials. If a coincidence of 75% is considered, which is a high percentage, it was observed for VCU 2002/2004 that 20 environments of evaluation would be sufficient. However, for VCU 2007/2009, this would only
Table 3. Mean relative ecovalence (Wr) per mesoregion of the Value for Cultivation and Use trials for grain yield (kg ha-1)
Mesoregion 2002/2004 2005/2006 2007/2009 2010/2012
South/Southwest/Campo das Vertentes 1.93 2.45 2.24 2.52
Zona da Mata 3.05 2.93 2.67 3.72
Triangulo Mineiro/Alto Paranaíba 2.07 2.15 2.15 2.58
Belo Horizonte Metropolitan Area 2.10 1.84 2.70 1.53
Northwest 1.99 1.85 1.35
-Vale do Rio Doce 1.11 - -
be possible with the maximum number of environments. It could be argued that the important thing is to identify not necessarily the best, but one of the three best lines. Using the same reasoning as above, it may be seen, as was expected, that the coincidence increases (Figure 3B). Nevertheless, even so, in VCU 2007/2009, 75% coincidence of one of the three best lines in first position only occurred when 38 environments were considered. The diversity of climatic conditions, of fertility, and of crop management practices in Minas Gerais explain this difference.
The standards for VCU trails for common bean in Brazil (Brasil 2006) require at least two years, three locations, and three crop seasons, i.e., 18 environments. From what was observed in the VCU trials conducted in Minas Gerais, this number is small. The common bean lines x environments interaction is expressive, especially for locations, requiring a greater number of locations for safer recommendations.
According to Troyer (1996), for a corn crop, a good hybrid does not arise by chance, it must be constructed. Success in this construction is directly related to the effort dedicated to evaluations. In the case of common bean in the state of Minas Gerais, this observation is also valid. A safe decision in regard to the best cultivar to be recommended in the VCU trials is dependent on the evaluations made in the greatest number of environments, especially locations, in the regions that concentrate common bean production in the state.
ACKNOWLEDGMENTS
To the researchers/professors of the Universidade Federal de Viçosa (UFV), Empresa de Pesquisa Agropecuária de Minas Gerais (Epamig) and Embrapa Arroz e Feijão (Cnpaf) who kindly granted the data for undertaking this study and Conselho Nacional de Desenvolvimento Científico e Tecnológico (CNPq) for the scholarship granted to authors.
Implicações de fatores ambientais previsíveis e imprevisíveis em VCU de feijão
em Minas Gerais
Resumo – O objetivo deste trabalho foi estimar a contribuição relativa de variações ambientais previsíveis e imprevisíveis para a
interação linhagens x ambientes e verificar se é possível reduzir o número de ambientes de avaliação dos Ensaios de Valor de Cultivo
e Uso conduzidos em Minas Gerais. Para isso foram utilizados dados de produtividade de grãos de 166 experimentos de VCU de feijão conduzidos no estado no período de 2002 a 2012. Realizaram-se análises de variância individuais e conjuntas dos ambientes para cada biênio e estimou-se a contribuição de cada fonte de variação para a variação total. Posteriormente foi utilizada a
eco-valência e efetuadas análises de variância conjunta considerando diferentes números de ambientes, por meio da reamostragem. A fonte de variação que mais contribui para a interação é locais. A redução do número de ambientes nos ensaios de VCU não é uma boa estratégia para a recomendação de cultivares em Minas Gerais.
Palavras-chave: Phaseolus vulgaris L., genética quantitativa, zoneamento agroecológico, estabilidade fenotípica.
REFERENCES
Brasil (2006) Instrução Normativa nº 25, de 23 de maio de 2006. Anexo I. Requisitos mínimos para determinação do valor de cultivo e uso de feijão (Phaseolus vulgaris) para a inscrição no registro nacional de cultivares - RNC. Diário Oficial [da] República Federativa do
Brasil, Brasília. Available at <http://extranet.agricultura.gov.br/ sislegisconsulta/servlet/VisualizarAnexo?id=11376> Accessed on December 11, 2012.
Bertoldo JG, Coimbra JLM, Nodari RO, Guidolin AF, Hemp S, Barili LD, Vale NM and Rozzeto DS (2009) Stratification of the state of Santa Catarina in macroenvironments for bean cultivation. Crop Breeding and Applied Biotechnology 9: 335-343.
Cargnelutti Filho A and Storck L (2007) Estatísticas de avaliação da precisão experimental em ensaios de cultivares de milho. Pesquisa Agropecuária Brasileira 42: 17-24.
Cochran WG (1954) The combination of estimates from diffferent experiments. Biometrics 10: 101-129.
CONAB (2012) Acompanhamento de safra brasileira: grãos safras 2012/2013 - segundo levantamento. Conab, Brasília, 33p.
IBGE (2007) Censo Agropecuário 1920/1996. Avaiable at <http:// seriesestatisticas.ibge.gov.br/series.aspx?no=1&op=0&vcodigo=AG RO34&t=producao-vegetal> Accessed on January 20, 2013.
Pereira PS, Melo LC, Faria LC, Del Peloso MJ, Costa JGC, Rava CA and Wendland A (2009) Adaptabilidade e estabilidade de genótipos de feijoeiro-comum com grãos tipo carioca na região Central do Brasil.
Pesquisa Agropecuária Brasileira 44: 29-37.
Pereira HS, Melo LC, Faria LC, Diaz JLC, Del Peloso MJ and Wendland A (2010) Environmental stratification in Paraná and Santa Catarina to evaluate common bean genotypes. Crop Breeding and Applied Biotechnology 10: 132-139.
R Development Core Team (2011) R: a language and environment for statistical computing. R Foundation for Statistical Computing, Vienna. Available at <http://www.R-project.org/> Accessed on October 21, 2012.
Ramalho MAP, Santos JB, Abreu AFB and Nunes JAR (2012)Aplicações da genética quantitativa no melhoramento de plantas autógamas. Editora UFLA, Lavras, 522p.
Resende MDV and Duarte JB (2007) Precisão e controle de qualidade em experimentos de avaliação de cultivares. Pesquisa Agropecuária Tropical 37: 182-194.
Rocha VPC, Moda-Cirino V, Destro D, Fonseca Júnior NS and Prete CEC (2010) Adaptabilidade e estabilidade da característica produtividade de grãos dos grupos comerciais carioca e preto de feijão. Ciências Agrárias 31: 39-54.
Silva CA, Abreu AFB, Ramalho MAP and Carneiro JES (2011) Implicações da origem das linhagens na magnitude da interação com ambientes. Pesquisa Agropecuária Brasileira 46: 720-728.
Torga PP, Melo PGS, Pereira HS, Faria LC, Del Peloso MJ and Melo LC (2013) Interactions of common beans cultivars of the black group with years, locations and sowing seasons. Euphytica189: 239-248.
Troyer AF (1996) Breeding widely adapted, popular maize hybrids.
Euphytica92: 163-174.