Patrícia Guimarães Santos Melo(1), Renata Cristina Alvares(2), Helton Santos Pereira(3),
Antônio Joaquim Braga Pereira Braz(4), Luis Claudio Faria(3) and Leonardo Cunha Melo(3)
(1)Universidade Federal de Goiás, Campus Samambaia, Avenida Esperança, s/no, Chácara de Recreio Samambaia, CEP 74690-900 Goiânia, GO, Brazil. E-mail: [email protected] (2)Caraíba Melhoramento de Sementes, Rodovia GO-174, Km 4,9, s/no, Fazenda Lagoinha, CEP 75908-570 Rio Verde, GO, Brazil. E-mail: [email protected] (3)Embrapa Arroz e Feijão, Rodovia GO-462, Km 12, Fazenda Capivara, Zona Rural, Caixa Postal 179, CEP 75375-000 Santo Antônio de Goiás, GO, Brazil. E-mail: [email protected], [email protected], [email protected] (4)Universidade de Rio Verde, Campus Rio Verde, Fazenda Fontes do Saber, Caixa Postal 104, CEP 75901-970 Rio Verde, GO, Brazil. E-mail: [email protected]
Abstract – The objective of this work was to evaluate the interaction between genotypes and environments for grain yield of common bean (Phaseolus vulgaris) lines and cultivars with potential for use in family farming systems. Data from value for cultivation and use tests, carried out in 20 environments in the state of Goiás, Brazil, were analyzed in two cycles (2007/2008 and 2009/2010) in the dry, rainy, and winter crop seasons. Each test consisted of 15 genotypes from the carioca, purple, and rosinha common bean commercial groups. The experimental design was randomized complete block, with three replicates. The methodologies used to test the stability and adaptability of the genotypes were the one of Lin & Binns, of Cruz, the additive main effects and multiplicative interaction model (AMMI) to calculate the weighted average of absolute scores and productivity (WAASP), and the GGE biplot graphical analysis. The productive performance of the common bean lines and cultivars is affected by genotype x environment interaction. The methodologies adopted allow the selection of cultivars for cropping, and of cultivars and lines for use as parents in order to obtain segregating populations for selection in a family farming system.
Index terms: Phaseolus vulgaris,AMMI, cultivars, genotype x environment interaction, GGE biplot analysis, value for cultivation and use.
Adaptabilidade e estabilidade de genótipos de feijoeiro‑comum
em sistema de agricultura familiar
Resumo – O objetivo deste trabalho foi avaliar a interação de genótipos com ambientes para produtividade de grãos de linhagens e cultivares de feijoeiro-comum (Phaseolus vulgaris) com potencial de uso em sistema de agricultura familiar. Foram analisados os dados dos ensaios de valor de cultivo e uso conduzidos em 20 ambientes do Estado de Goiás, em dois ciclos (2007/2008 e 2009/2010), nas safras da seca, das águas e de inverno. Cada ensaio foi constituído por 15 genótipos de feijoeiro-comum dos grupos comerciais carioca, roxo e rosinha. Utilizou-se o delineamento em blocos completos ao acaso com três repetições. As metodologias utilizadas para o estudo de estabilidade e adaptabilidade foram a de Lin & Binns, a de Cruz, o modelo de efeitos aditivos principais com interação multiplicativa (AMMI) para cálculo da média ponderada de escores absolutos e produtividade (MPEAP), e a análise gráfica GGE biplot. O desempenho produtivo das linhagens e das cultivares de feijoeiro-comum é influenciado pela interação de genótipos com ambientes. As metodologias empregadas permitem selecionar cultivares para cultivo, e cultivares e linhagens como genitores com o objetivo de obter populações segregantes para seleção em sistema de agricultura familiar.
Termos para indexação: Phaseolus vulgaris, AMMI,cultivares, interação genótipo x ambiente, análise GGE biplot, valor de cultivo e uso.
Introduction
Brazil stands out as one of the world’s largest producer
and consumer of common bean (Phaseolus vulgaris L.),
with an average productivity of approximately 1,400 kg
ha-1 when considering the three recommended sowing
Common bean is grown at different seasons of the year and sites, in subsistence to high-tech farming areas. In family farms, it is considered an economic alternative and, therefore, is a common activity; however, the cropped area can still be expanded since only less than 50 hectares are planted with the crop in 99.08% of the farms, 50 to 200 hectares in 0.77%, and over 200 hectares just in 0.15% (Silva & Wander, 2013).
A marked interaction between genotypes and environments is also expected for this crop, particularly regarding grain yield, whose importance has been evidenced in several studies (Oliveira et al., 2006; Melo et al., 2007; Pereira et al., 2009b, 2012; Torga et al., 2013b). However, there are no consistent reports in the literature for the specific conditions of the family farming system, because common bean breeding programs focus on genotypes with an extensive range of adaptation (Torga et al., 2013a; Pereira et al., 2016).
Aiming to minimize the effects of the interaction between genotypes and environments, in general, genetic breeding programs select materials with wide adaptation and stability, and, therefore, recommended for several sites (Malosetti et al., 2013). In the case of the family farming system, it is necessary to identify materials that are stable and adapted to the specific environments used by the farmers (Bucheyeki & Mmbaga, 2013), since these cultivars show many advantages, such as: high yield, greater efficiency in the use of soil nutrients, resistance to pests and diseases, and tolerance to environmental stresses.
In this sense, participatory research methods with genetic improvement are important and promising because they not only promote the development of improved cultivars but also allow working with the entire community, as well as with researchers from different areas, consultants, and farmers associations. In addition, a larger number of environments are tested in these methods and different information is manipulated compared with conventional breeding (Desclaux et al., 2008).
The objective of this work was to evaluate the interaction between genotypes and environments for grain yield of common bean lines and cultivars with potential for use in family farming systems.
Materials and Methods
Value for cultivation and use (VCU) testing of common bean was conducted in 20 representative
environments in the state of Goiás, Brazil, during four years (2007 to 2010) in the dry, rainy, and winter crop seasons. Each trial consisted of 15 common bean lines developed by Embrapa Arroz e Feijão: 7 from the carioca commercial group (CNFC 10713, CNFC 10721, CNFC 10729, CNFC 10733, CNFC 10753, CNFC 10757, and CNFC 10758), 2 from the purple group (CNFRX 11996 and CNFRX 10241), 1 from the rose group (CNFRS 11997), and 5 controls (BRS Cometa, BRS Pontal, BRS Requinte, BRS Pitanga, and BRS Vereda). The experiment was carried out in a randomized complete block design, with three replicates, in plots with four 4-m long lines. Grain yield data were collect in the two central lines.
Of the trials, 7 were carried out in farmer properties in the municipalities of Rubiataba, Ipiranga, and Nova Veneza in the state of Goiás, whereas 13 were conducted at the experimental stations of Embrapa Arroz e Feijão and Empresa de Assistência Técnica e Extensão Rural do Estado de Goiás. At the stations, the management was similar to that adopted by the farmers: half of the recommended fertilization and
side dressing rates, i.e., 400 kg N-P2O5-K2O and two
side dressing fertilizations of 20 kg N, respectively. No chemical control of pests and diseases was carried out.
Grain yield data were subjected to the joint analysis of variance, considering the effect of genotypes as fixed and of environments as random. To evaluate experimental quality, the statistics selective accuracy (SA) and F-test value of the individual analyzes were also used, according to Resende & Duarte (2007). The
coefficient of determination (R2) was estimated by
the expression R2
i = SSi/SSt, where SSi is the sum of
squares of the source of variation i and SSt is the total
sum of squares.
most stable (Pereira et al., 2009a). A weight equal to three and to two was used for WAASP and WAAS, respectively (Pontes Júnior et al., 2016; Torga et al., 2016), allowing the assessment of adaptability and stability simultaneously; the yield and WAAS data were transformed to the same scale.
To graphically represent the effect of the genotype x environment interaction, a GGE biplot graph was built with the main components 1 and 2 of the AMMI analysis, according to Yan (2001), in order to group the sites into mega-environments and to facilitate the selection of superior genotypes.
Results and Discussion
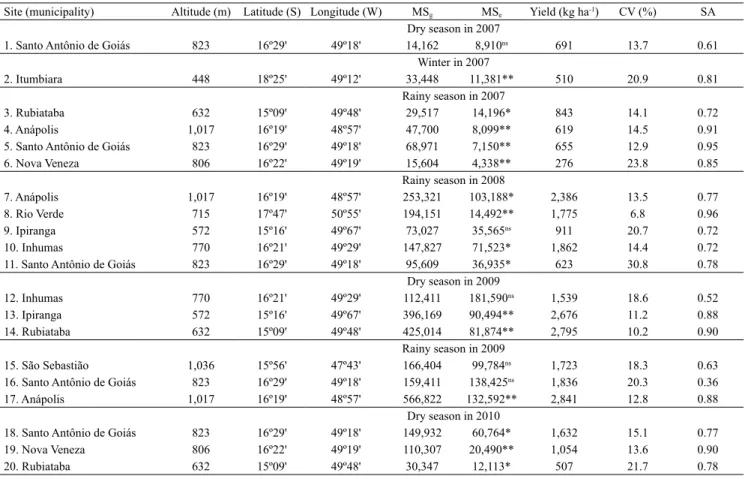
The average grain yield differed between environments, with values up to approximately
ten times greater, ranging from 276 kg ha-1 in Nova
Veneza, during the rainy season, in 2007, to 2,841
kg ha-1 in Anápolis, also during the rainy season, in
2009 (Table 1). The performance of the genotypes was affected by variations in the different environments – altitude, for example, varied from 448 to 1,036 m –, as well as by years and seasons. For this reason, common bean cultivars must show stability in order to be competitive in contrasting environmental conditions (Pereira et al., 2016). Whenever possible, farmers try to control the environment in order to maximize the productive potential of cultivars, but when they do not have the economic conditions to do this, they probably will have to rely on the stability and adaptability of the cultivars to the cropping site. Therefore, the effect of genotype x environment interaction may be more drastic when farmers do not have the technologies to
Table 1. Geographic sites and summaries of the individual analysis of variance for grain yield of common bean (Phaseolus vulgaris) lines and cultivars evaluated in 20 trials in the dry, rainy, and winter crop seasons in the state of Goiás, Brazil, from 2007 to 2010.
Site (municipality) Altitude (m) Latitude (S) Longitude (W) MSg MSe Yield (kg ha-1) CV (%) SA
Dry season in 2007
1. Santo Antônio de Goiás 823 16º29' 49º18' 14,162 8,910ns 691 13.7 0.61
Winter in 2007
2. Itumbiara 448 18º25' 49º12' 33,448 11,381** 510 20.9 0.81 Rainy season in 2007
3. Rubiataba 632 15º09' 49º48' 29,517 14,196* 843 14.1 0.72 4. Anápolis 1,017 16º19' 48º57' 47,700 8,099** 619 14.5 0.91 5. Santo Antônio de Goiás 823 16º29' 49º18' 68,971 7,150** 655 12.9 0.95 6. Nova Veneza 806 16º22' 49º19' 15,604 4,338** 276 23.8 0.85
Rainy season in 2008
7. Anápolis 1,017 16º19' 48º57' 253,321 103,188* 2,386 13.5 0.77 8. Rio Verde 715 17º47' 50º55' 194,151 14,492** 1,775 6.8 0.96 9. Ipiranga 572 15º16' 49º67' 73,027 35,565ns 911 20.7 0.72
10. Inhumas 770 16º21' 49º29' 147,827 71,523* 1,862 14.4 0.72 11. Santo Antônio de Goiás 823 16º29' 49º18' 95,609 36,935* 623 30.8 0.78
Dry season in 2009
12. Inhumas 770 16º21' 49º29' 112,411 181,590ns 1,539 18.6 0.52
13. Ipiranga 572 15º16' 49º67' 396,169 90,494** 2,676 11.2 0.88 14. Rubiataba 632 15º09' 49º48' 425,014 81,874** 2,795 10.2 0.90
Rainy season in 2009
15. São Sebastião 1,036 15º56' 47º43' 166,404 99,784ns 1,723 18.3 0.63
16. Santo Antônio de Goiás 823 16º29' 49º18' 159,411 138,425ns 1,836 20.3 0.36
17. Anápolis 1,017 16º19' 48º57' 566,822 132,592** 2,841 12.8 0.88 Dry season in 2010
18. Santo Antônio de Goiás 823 16º29' 49º18' 149,932 60,764* 1,632 15.1 0.77 19. Nova Veneza 806 16º22' 49º19' 110,307 20,490** 1,054 13.6 0.90 20. Rubiataba 632 15º09' 49º48' 30,347 12,113* 507 21.7 0.78
** and *Significant by the F-test, at 1 and 5% probability, respectively. nsNonsignificant. MS
g, mean square of genotypes; MSe, mean square of error; and
adjust their production system, so that genotypes may express their potential adequately (Desclaux et al., 2008).
Except for the trial in Santo Antônio de Goiás during the rainy season in 2008, all coefficients of variation were below 25%, as required by Registro Nacional de Cultivares of Ministry of Agriculture (Brasil, 2006). The estimation of selective accuracy (SA), which evaluates the precision of an experiment, revealed
that of the 20 trials: 5 presented very high SA (≥0.90), 11 high SA (≥0.7 and <0.90), 3 moderate SA (≥0.50 and <0.70), and 1 low SA (<0.50), ranked according
to Resende & Duarte (2007). Pereira et al. (2011, 2012), however, found only high or very high SA for common bean grain yield. It should be noted that for some authors SA is considered more appropriate than the coefficient of variation to evaluate experimental accuracy (Cargnelutti Filho & Storck, 2009).
The mean coefficient of variation of 16.5% indicated good experimental precision in the environments in the properties of the rural farmers (Table 2). The total
average yield of the trials was 1,387 kg ha-1, similar to
the national average (Silva & Wander, 2013), indicating the potential of cultivars and lines in environments considered unfavorable.
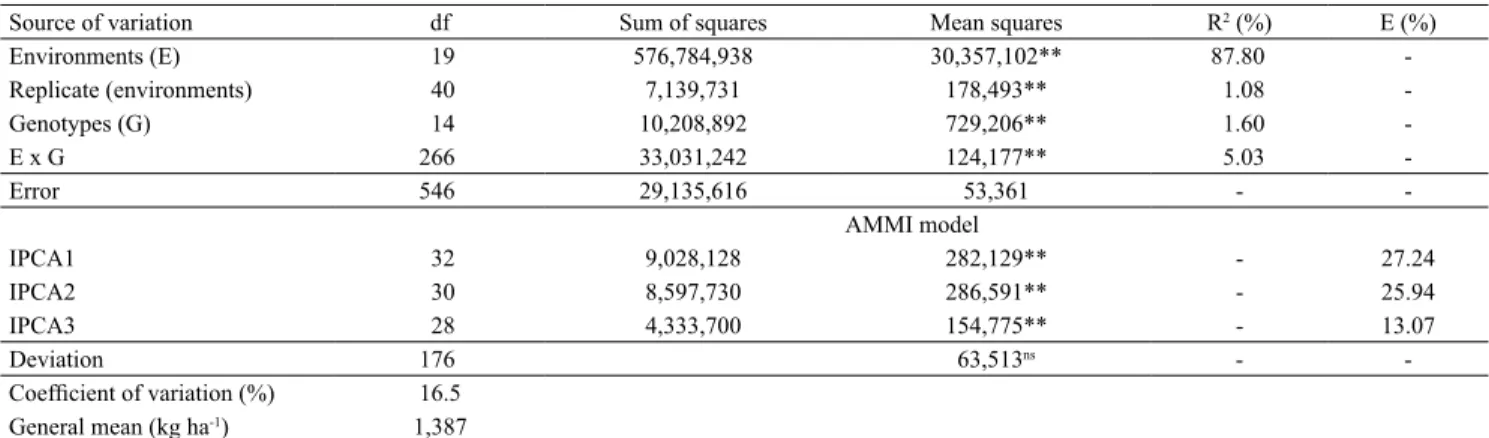
The joint analysis of all sources of variations showed differences in the performance of the studied genotypes, environments, and their interaction (Table 2). A variation of 1.6 and 87.8% was observed for the source genotypes and environments, respectively,
which, according to Yan (2002), is within the expected, i.e., genetic and interaction variations should usually be low and the environmental variations should be above 80%. In the present study, the genotype x environment interaction explained 5.03% of total variation. This is an indicative of the percentage of participation of each source in the total variation of the character yield, which reinforces the importance of estimating the effects of interaction, in order to enhance the selection process (Yan, 2002).
According to the AMMI model, the interaction was decomposed by independent principal component analysis into 14 main components, of which the first three were responsible for 27.24, 25.94, and 13.07% of the square sum of the interaction, respectively. The AMMI 3 model was chosen because it associated significance for the axis and no significance for the residue (Table 2).
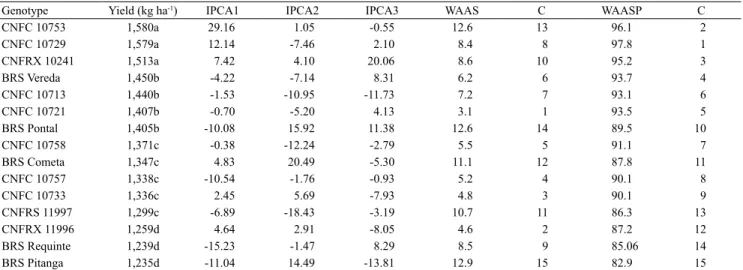
The CNFC 10721 and CNFC 10733 carioca grain lines and the CNFRX 11996 purple grain line were considered the most stable, according to the WAAS, for the conditions of the family farming system in the state of Goiás (Table 3). The BRS Pitanga and BRS Pontal cultivars and the CNFC 10753 line contributed the most to the interaction with environments due to their highest WAAS values. Pereira et al. (2009a, 2016) used this estimation to identify stable carioca grain genotypes – such as the BRS Estilo and Pérola cultivars – in states of the Midwestern and Northeastern regions of Brazil.
Table 2. Summary of the joint analysis of variance with the decomposition of the sum of squares of the genotype x environment interaction (SS(GxE)) for grain yield of common bean (Phaseolus vulgaris) lines and cultivars in 20 environments.
Source of variation df Sum of squares Mean squares R2 (%) E (%)
Environments (E) 19 576,784,938 30,357,102** 87.80 -Replicate (environments) 40 7,139,731 178,493** 1.08 -Genotypes (G) 14 10,208,892 729,206** 1.60
-E x G 266 33,031,242 124,177** 5.03
-Error 546 29,135,616 53,361 -
-AMMI model
IPCA1 32 9,028,128 282,129** - 27.24
IPCA2 30 8,597,730 286,591** - 25.94
IPCA3 28 4,333,700 154,775** - 13.07
Deviation 176 63,513ns -
-Coefficient of variation (%) 16.5
General mean (kg ha-1) 1,387
** and *Significant by the F-test, at 1 and 5% probability, respectively. nsNonsignificant. E, percentage of the SS
(GxE) given to each principal component
When associating stability with productivity, the most promising lines for the evaluated conditions, using the WAASP, were CNFC 10729, CNFC 10753, and CNFRX 10241 (Table 3). This strategy was also adopted by Torga et al. (2016) and Pontes Júnior et al. (2016) to mitigate the problem of more stable lines or cultivars not being among the genotypes with higher yield.
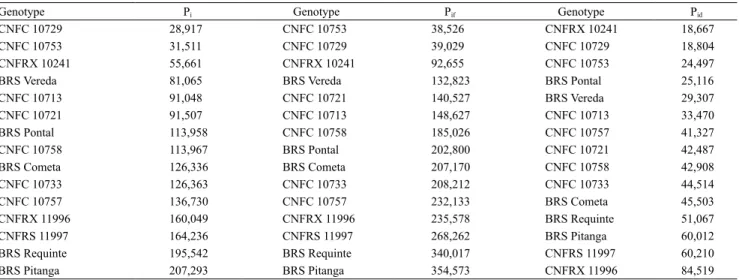
The lines considered promising were the same in the methodology of Lin & Binns (1988) modified by Oliveira et al. (2006) and in the WAASP, both in the overall analysis and in the favorable and unfavorable environments. The only difference was their ranking in relation to the studied environments (Table 4). This shows the potential of the common bean lines from the breeding program of Embrapa Arroz e Feijão for the conditions of the family farming system, in which the species is usually grown in marginal areas; identifying these genotypes may make the crop more competitive in these sites (Sena et al., 2008). In both methods, the genotypes with the lowest average yield values also presented low stability and, therefore, a larger contribution to the interaction. The similarities between the two methodologies in identifying the best and the worst genotypes suggest that only one is enough to aid the breeder in the selection process.
The genotype with ideal behavior proposed by Cruz et al. (1989) was not found among the studied cultivars and lines, or in the works of Oliveira et al. (2006) and Pereira et al. (2009a). According to Cruz et al. (1989), this genotype must present high average yield, responsiveness to environmental improvement
(β1i + β2i >1), adaptability to unfavorable environments
(β1i <1), and high (nonsignificant σ2di) or tolerable
(significant σ2
di and R2 over 80%) predictability.
Only the BRS Requinte cultivar showed adaptability to unfavorable environments and high predictability, but was not responsive to the improvement of the environments (Table 5). Although its grain yield did not exceed the overall average, this cultivar has potential for low-technology environments due to its excellent grain quality, with slow darkening and resistance to important crop diseases (Faria et al., 2004), making it an option for the family farming system of the state of Goiás. The CNFC 10753 carioca grain line, in turn, was responsive to the improvement of the environments and showed an average yield above the
overall average, high R2 value, and high predictability,
being promising for environments with greater use of inputs, but did not present specific adaptability to unfavorable environments. The BRS Cometa cultivar showed responsiveness to environmental improvement and high predictability of behavior; however, it did
Table 3. Means and values of the main components (IPCA) significant for each genotype of common bean (Phaseolus vulgaris) evaluated in the state of Goiás, Brazil, used to calculate the weighted average of absolute scores (WAAS) and the weighted average of absolute scores and productivity (WAASP), as well as the classification of the genotypes for stability by the additive main effects and multiplicative interaction (AMMI) methodology(1).
Genotype Yield (kg ha-1) IPCA1 IPCA2 IPCA3 WAAS C WAASP C
CNFC 10753 1,580a 29.16 1.05 -0.55 12.6 13 96.1 2 CNFC 10729 1,579a 12.14 -7.46 2.10 8.4 8 97.8 1 CNFRX 10241 1,513a 7.42 4.10 20.06 8.6 10 95.2 3 BRS Vereda 1,450b -4.22 -7.14 8.31 6.2 6 93.7 4 CNFC 10713 1,440b -1.53 -10.95 -11.73 7.2 7 93.1 6 CNFC 10721 1,407b -0.70 -5.20 4.13 3.1 1 93.5 5 BRS Pontal 1,405b -10.08 15.92 11.38 12.6 14 89.5 10 CNFC 10758 1,371c -0.38 -12.24 -2.79 5.5 5 91.1 7 BRS Cometa 1,347c 4.83 20.49 -5.30 11.1 12 87.8 11 CNFC 10757 1,338c -10.54 -1.76 -0.93 5.2 4 90.1 8 CNFC 10733 1,336c 2.45 5.69 -7.93 4.8 3 90.1 9 CNFRS 11997 1,299c -6.89 -18.43 -3.19 10.7 11 86.3 13 CNFRX 11996 1,259d 4.64 2.91 -8.05 4.6 2 87.2 12 BRS Requinte 1,239d -15.23 -1.47 8.29 8.5 9 85.06 14 BRS Pitanga 1,235d -11.04 14.49 -13.81 12.9 15 82.9 15
Table 4. Estimates of parameters of phenotypic (Pi) stability and adaptability decomposed into favorable (Pif) and unfavorable environments (Pid), according to the method of Lin & Binns (1988) modified by Oliveira et al. (2006), for 15 common bean (Phaseolus vulgaris) genotypes evaluated in 20 environments in the state of Goiás, Brazil, from 2007 to 2010.
Genotype Pi Genotype Pif Genotype Pid
CNFC 10729 28,917 CNFC 10753 38,526 CNFRX 10241 18,667 CNFC 10753 31,511 CNFC 10729 39,029 CNFC 10729 18,804 CNFRX 10241 55,661 CNFRX 10241 92,655 CNFC 10753 24,497 BRS Vereda 81,065 BRS Vereda 132,823 BRS Pontal 25,116 CNFC 10713 91,048 CNFC 10721 140,527 BRS Vereda 29,307 CNFC 10721 91,507 CNFC 10713 148,627 CNFC 10713 33,470 BRS Pontal 113,958 CNFC 10758 185,026 CNFC 10757 41,327 CNFC 10758 113,967 BRS Pontal 202,800 CNFC 10721 42,487 BRS Cometa 126,336 BRS Cometa 207,170 CNFC 10758 42,908 CNFC 10733 126,363 CNFC 10733 208,212 CNFC 10733 44,514 CNFC 10757 136,730 CNFC 10757 232,133 BRS Cometa 45,503 CNFRX 11996 160,049 CNFRX 11996 235,578 BRS Requinte 51,067 CNFRS 11997 164,236 CNFRS 11997 268,262 BRS Pitanga 60,012 BRS Requinte 195,542 BRS Requinte 340,017 CNFRS 11997 60,210 BRS Pitanga 207,293 BRS Pitanga 354,573 CNFRX 11996 84,519
not stand out among the most productive ones, being ranked in the third group of means.
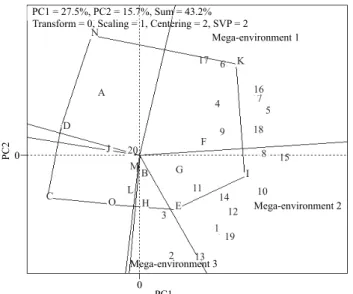
The CNFRX 11996, 'BRS Requinte', 'BRS Pitanga', CNFC 10753, CNFC 10729, CNFC 11997, and 'BRS Vereda' genotypes are located at extreme points of the polygon in the graphical analysis by the GGE biplot (Figure 1). It was possible to identify the formation of three mega-environments, i.e., different cultivars and lines adapted to different groups of environments. The CNFC 10753 and CNFRX 10241 lines present wide adaptation in eight of the evaluated environments, located at the right of the center of the biplot, which shows higher performance, being among the most productive lines (Table 3). This result is in alignment with those of the methodology of Linn & Binns (1988) and of the WAASP.
However, the BRS Pitanga and BRS Requinte cultivars and the CNFRX 11996 line presented performance below the overall average, since they were located to the left of the graph. The same result was observed for the environments; however, it was not possible to identify those with lower performance. The BRS Vereda cultivar and the CNFC 10729 and CNFC 10713 lines were also considered positively associated (adapted) to eight environments, and CNFC 10713 is among the most stable, since it is close to the center of the biplot. Also among the most stable genotypes are: CNFC 10733, CNFX 10241, CNFC 10758, and 'BRS
Pontal'. In the other three environments, 'BRS Pontal' and CNFC 10721 were the most adapted.
In relation to the recommendation of cultivars, that is, of materials already released and available on the market, 'BRS Vereda' from the rose group of special beans was the most stable and adapted, according to the WAASP and to Lin & Binns (1988), both for overall analysis and favorable environments. The cultivar is an option for short-term recommendation due to its resistance to anthracnose, rust, angular spot, and common mosaic virus (Otsubo et al., 2005). For unfavorable environments, 'BRS Pontal' (carioca group) showed satisfactory performance for family farming with more restricted use of technologies. BRS Pitanga, from the purple group of special beans, was the cultivar with the lowest values for stability and adaptability, according to AMMI (WAASP), Lin & Binns (1988), and GGE biplot graphical analysis. This is a cultivar that presents good cooking quality, as well as resistance to diseases (Rava et al., 2005).
Table 5. Estimates of the following parameters of phenotypic stability and adaptability: average yield (β ̂ 0i), regression coefficients (β ̂ 1i and β ̂ 1i + β ̂ 2i), and regression deviation (σ̂ 2
di), according to the method of Cruz et al. (1989), for 15 common bean (Phaseolus vulgaris) genotypes evaluated in 20 environments in the state of Goiás, Brazil, from 2007 to 2010(1).
Genotype β ̂0i(2) β ̂1i β ̂1i + β ̂2i σ ̂ 2
di (103) R2 (%)
CNFC 10753 1,580a 1.19** 1.57** 75.74ns 97.9
CNFC 10729 1,579a 1.12ns 1.11ns 84.84ns 97.2
CNFRX 10241 1,513a 1.07ns 1.16ns 124.52ns 95.6
BRS Vereda 1,450b 1.07ns 0.86ns 82.67ns 96.8
CNFC 10713 1,440b 1.02ns 0.82ns 87.47ns 96.3
CNFC 10721 1,407b 1.05ns 0.98ns 70.41ns 97.2
BRS Pontal 1,405b 0.96ns 0.94ns 155.73** 93.2
CNFC 10758 1,371c 0.99ns 0.94ns 97.59ns 95.8
BRS Cometa 1,347c 0.98ns 1.36** 119.55ns 95.6
CNFC 10757 1,338c 0.94ns 0.77ns 42.91ns 97.8
CNFC 10733 1,336c 0.95ns 1.15ns 79.79ns 96.6
CNFRS 11997 1,299c 0.97ns 0.71ns 111.07ns 94.7
CNFRX 11996 1,259d 0.96ns 1.07ns 62.25ns 97.3
BRS Requinte 1,239d 0.85* 0.81ns 72.59ns 95.8
BRS Pitanga 1,235d 0.88ns 0.76ns 133.65ns 92.8 (1)Means followed by equal letters do not differ by Scott-Knott’s test, at
10% probability. (2)H
0:β1i=1; H0:β1i+β2i=1. R2, coefficient of determination.
** and *Significant by the t-test, at 1 and 5% probability, respectively.
nsNonsignificant.
Figure 1. GGE biplot methodology based on the principal components 1 and 2 (PC1 and PC2) for grain yield (kg ha-1) of 15 common bean (Phaseolus vulgaris) lines and cultivars evaluated in 20 environments (Table 1) in the state of Goiás, Brazil. A, BRS Cometa; B, BRS Pontal; C, BRS Requinte; D, BRS Pitanga; E, BRS Vereda; F, CNFRX 10241; G, CNFC 10713; H, CNFC 10721; I, CNFC 10729; J, CNFC 10733; K, CNFC 10753; L, CNFC 10757; M, CNFC 10758; N, CNFRX 11996; and O, CNFRS 11997. SVP, x.
Conclusions
1. The productive performance of common bean (Phaseolus vulgaris) lines and cultivars is affected by the genotype x environment interaction.
2. The BRS Vereda cultivar from the rose group of special beans is the most stable and adapted to favorable environments.
3. The BRS Pontal cultivar shows satisfactory
performance for the conditions of the family farming system where the use of technologies is more restricted.
4. The CNFC 10729, CNFC 10753, and CNFC 10241 lines stand out because they present higher productive potential than the BRS Cometa, BRS Pontal, BRS Requinte, BRS Pitanga, and BRS Vereda cultivars.
References
BRASIL. Ministério da Agricultura, Pecuária e Abastecimento. Instrução Normativa nº 25, de 23 de maio de 2006. Anexo I. Requisitos mínimos para determinação do valor de cultivo e uso de feijão (Phaseolus vulgaris) para a inscrição no registro nacional de cultivares – RNC. Diário Oficial da
União, 19 jun. 2006. Seção 1, p.17. Available at: ˂http://
pesquisa.in.gov.br/imprensa/jsp/visualiza/index.jsp?data= 19/06/2006&jornal=1&pagina=17&totalArquivos=80>. Accessed on: Oct. 19 2017.
BUCHEYEKI, T.L.; MMBAGA, T.E. On-farm evaluation of beans varieties for adaptation and adoption in Kigoma Region in Tanzania. ISRN Agronomy, v.2013, article 436064, p.1-5, 2013. DOI: 10.1155/2013/436064.
CARGNELUTTI FILHO, A.; STORCK, L. Medidas do grau de precisão experimental em ensaios de competição de cultivares de milho. Pesquisa Agropecuária Brasileira, v.44, p.111-117, 2009. DOI: 10.1590/S0100-204X2009000200001.
CRUZ, C.D.; TORRES, R.A.; VENCOVSKY, R. An alternative approach to the stability analysis proposed by Silva and Barreto.
Revista Brasileira de Genética, v.12, p.567-580, 1989.
DESCLAUX, D.; NOLOT, J.M.; CHIFFOLEAU, Y.; GOZÉ, E.; LECLERC, C. Changes in the concept of genotype × environment interactions to fit agriculture diversification and decentralized participatory plant breeding: pluridisciplinary point of view.
Euphytica, v.163, p.533-546, 2008. DOI: 10.1007/s10681-008-9717-2.
DUARTE, J.B.; VENCOVSKY, R. Interação genótipos x
ambientes: uma introdução à análise “AMMI”. Ribeirão Preto:
Sociedade Brasileira de Genética, 1999. 60p. (Monografia, nº 9).
FEIJÃO. Dados de conjuntura da produção de feijão comum
(Phaseolus vulgaris L.) e caupi (Vigna unguiculata L. Walp) no
Brasil: 1985–2014. Available at: <http://www.cnpaf.embrapa.br/
socioeconomia/index.htm>. Accessed on: Jan. 15 2016.
LIN, C.S.; BINNS, M.R. A superiority measure of cultivar performance for cultivar x location data. Canadian Journal of
Plant Science, v.68, p.193-198, 1988. DOI: 10.4141/cjps88-018.
MALOSETTI, M.; RIBAUT, J.-M.; EEUWIJK, F.A. van. The statistical analysis of multi-environment data: modeling genotype-by-environment interaction and its genetic basis. Frontiers in
Physiology, v.4, article 44, 2013. DOI: 10.3389/fphys.2013.00044.
MELO, L.C.; MELO, P.G.S.; FARIA, L.C. de; DÍAZ, J.L.C.; DEL PELOSO, M.J.; RAVA, C.A.; COSTA, J.G.C. da. Interação com ambientes e estabilidade de genótipos de feijoeiro-comum na Região Centro-Sul do Brasil. Pesquisa Agropecuária Brasileira, v.42, p.715-723, 2007. DOI: 10.1590/S0100-204X2007000500015.
OLIVEIRA, G.V.; CARNEIRO, P.C.S.; CARNEIRO, J.E. de S.; CRUZ, C.D. Adaptabilidade e estabilidade de linhagens de feijão comum em Minas Gerais. Pesquisa Agropecuária Brasileira, v.41, p.257-265, 2006. DOI: 10.1590/S0100-204X2006000200010.
OTSUBO, A.A.; OTUBO, S.T.; ZUFFO, N.L.; DEL PELOSO, M.J.; FARIA, L.C. de; MELO, L.C.; COSTA, J.G.C. da; RAVA, C.A.; CARNEIRO, G.E. de S.; SOARES, D.M.; DIAZ, J.L.C.; FARIA, J.C. de; SARTORATO, A.; MERCANTE, F.M. BRS
Vereda: nova cultivar de feijão do grupo Rosinha para Mato
Grosso do Sul. Dourados: Embrapa Agropecuária Oeste, 2005. 4p. (Embrapa Agropecuária Oeste. Comunicado técnico 113).
PEREIRA, H.S.; ALMEIDA, V.M. de; MELO, L.C.; WENDLAND, A.; FARIA, L.C. de; DEL PELOSO, M.J.; MAGALDI, M.C. de S. Influência do ambiente em cultivares de feijoeiro-comum em cerrado com baixa altitude. Bragantia, v.71, p.165-172, 2012. DOI: 10.1590/S0006-87052012005000024.
PEREIRA, H.S.; ALVARES, R.C.; MELO, L.C.; COSTA, A.F. da; CARVALHO, H.W.L. de; FARIA, L.C. de; SOUZA, T.L.P.O. de. Genotype by environment interaction of “carioca” seeded common bean advanced lines in northeastern Brazil.
Semina: Ciências Agrárias, v.37, p.1745-1756, 2016. DOI:
10.5433/1679-0359.2016v37n4p1745.
PEREIRA, H.S.; MELO, L.C.; DEL PELOSO, M.J.; FARIA, L.C. de; WENDLAND, A. Complex interaction between genotypes and growing seasons of carioca common bean in Goiás/Distrito Federal. Crop Breeding and Applied Biotechnology, v.11, p.207-215, 2011. DOI: 10.1590/S1984-70332011000300002.
PEREIRA, H.S.; MELO, L.C.; FARIA, L.C. de; DEL PELOSO, M.J.; COSTA, J.G.C. da; RAVA, C.A.; WENDLAND, A. Adaptabilidade e estabilidade de genótipos de feijoeiro-comum com grãos tipo carioca na Região Central do Brasil. Pesquisa
Agropecuária Brasileira, v.44, p.29-37, 2009a. DOI: 10.1590/
S0100-204X2009000100005.
PEREIRA, H.S.; MELO, L.C.; FARIA, L.C.; DÍAZ, J.L.C.; DEL PELOSO, M.J.; COSTA, G.C.; WENDLAND, A. Stability and
adaptability of carioca common bean genotypes in states of the central South Region of Brazil. Crop Breeding and Applied
Biotechnology, v.9, p.181-188, 2009b. DOI: 10.12702/1984-7033.
v09n02a11.
PONTES JÚNIOR, V.A.; MELO, P.G.S.; PEREIRA, H.S.; MELO, L.C. Genetic potential of common bean progenies obtained by different breeding methods evaluated in various environments.
Genetics and Molecular Research, v.15, p.1-12, 2016. DOI:
10.4238/gmr.15038622.
RAVA, C.A.; FARIA, L.C. de; COSTA, J.G.C. da; DEL PELOSO, M.J.; MELO, L.C.; DIAZ, J.L.C.; FARIA, J.C. de; SILVA, H.T. da; SARTORATO, A.; BASSINELLO, P.Z.; ZIMMERMANN, F.J.P. 'BRS Pitanga': new dry bean variety of the small purple group.
Crop Breeding and Applied Biotechnology, v.5, p.475-476,
2005. DOI: 10.12702/1984-7033.v05n04a15.
RESENDE, M.D.V. de; DUARTE, J.B. Precisão e controle de qualidade em experimentos de avaliação de cultivares. Pesquisa
Agropecuária Tropical, v.37, p.182-194, 2007.
SENA, M.R.; ABREU, A. de F.B.; RAMALHO, M.A.P.; BRUZI, A.T. Envolvimento de agricultores no processo seletivo de novas linhagens de feijoeiro. Ciência e Agrotecnologia, v.32, p.407-412, 2008.
SILVA, O.F. da; WANDER, A.E. O feijão-comum no Brasil: passado, presente e futuro. Santo Antônio de Goiás: Embrapa Arroz e Feijão, 2013. 63p. (Embrapa Arroz e Feijão. Documentos, 287).
TORGA, P.P.; MELO, P.G.S.; PEREIRA, H.S.; FARIA, L.C. de; DEL PELOSO, M.J.; MELO, L.C. Decomposition of the interaction of common black bean group genotypes with the environment. Agricultural Sciences, v.4, p.683-688, 2013a. DOI: 10.4236/as.2013.412092.
TORGA, P.P.; MELO, P.G.S.; PEREIRA, H.S.; FARIA, L.C. de; DEL PELOSO, M.J.; MELO, L.C. Interaction of common beans cultivars of the black group with years, locations and sowing seasons. Euphytica, v.189, p.239-248, 2013b. DOI: 10.1007/ s10681-012-0793-y.
TORGA, P.P.; MELO, P.G.S.; PEREIRA, H.S.; FARIA, L.C.; MELO, L.C. Genetic potential of black bean genotypes with predictable behaviors in multienvironment trials. Genetics
and Molecular Research, v.15, p.1-13, 2016. DOI: 10.4238/
gmr15049029.
YAN, W. GGEbiplot: a Windows application for graphical analysis of multienvironment trial data and other types of two-way data. Agronomy Journal, v.93, p.1111-1118, 2001. DOI: 10.2134/agronj2001.9351111x.
YAN, W. Singular-value partitioning in biplot analysis of multienvironment trial data. Agronomy Journal, v.94, p.990-996, 2002. DOI: 10.2134/agronj2002.0990.
YAN, W.; TINKER, N.A. An integrated biplot analysis system for displaying, interpreting, and exploring genotype X environment interactions. Crop Science, v.45, p.1004-1016, 2005. DOI: 10.2135/ cropsci2004.0076.