TOLERANCE TO HIGH MOISTURE AT HARVEST
Seleção de linhagens de feijão com tolerância a alta umidade no momento da colheita
Lidiane Kely de Lima1, Magno Antonio Patto Ramalho2, Ângela de Fátima Barbosa Abreu3
ABSTRACT
The occurrence of precipitation / rain in harvest bean causes damage to the product and reduces the yield. The main alternative to mitigate this problem is to obtain cultivars presenting low germination of beans in the pods under conditions of high moisture. The purpose of this study was to verify if there is genetic variability among the common bean inbred lines that are in the phase of recommendation for the South of Minas Gerais, Brazil in regard to tolerance to moisture after harvest, and identify traits that may be routinely used in selection of tolerant lines to these conditions. Ninety-five lines in the phase of recommendation by the Genetic Breeding Program from UFLA were used. After harvest, a sample of plants from each plot was removed for assessments of seed germination in the pods in a moist chamber and water absorption by pod and seed. Eight days after harvest, another sample was removed to assess seed appearance using a scoring scale. The data were submitted to analysis of variance and estimates of the Pearson phenotypic correlations were obtained among traits. Lines differ in relation to tolerance to moisture at the time of harvest, with those of higher tolerance having lighter colored seeds. The main difficulty in selection of common bean lines for tolerance to high moisture at harvest is the repeatability of the environmental conditions among crop seasons. The alternative is assessing the amount of water absorbed by pods.
Index terms: Phaseoulus vulgaris L., correlation, early germination, seed quality.
RESUMO
A ocorrência de precipitação / chuva na colheita do feijão comum provoca danos ao produto e reduz o rendimento. A principal alternativa para mitigar este problema é a obtenção de cultivares com baixa germinação de grãos nas vagens em condições de alta umidade. Neste trabalho, objetivou-se vrificar se há variabilidade genética entre as linhagens do feijoeiro que estão em fase de recomendação para o Sul de Minas Gerais quanto à tolerância à umidade após a colheita e identificar caracteres que possam ser utilizados rotineiramente na seleção de linhagens tolerantes a essas condições. Utilizaram-se 95 linhagens em fase de recomendação pelo Programa de Melhoramento Genético da UFLA. Após a colheita, uma amostra de plantas de cada parcela foi retirada para avaliações de germinação dos grãos nas vagens em câmara de nebulização e absorção de água pela vagem e pelo grão. Oito dias após o arranquio foi retirada outra amostra para avaliar o aspecto do grão utilizando escala de notas. Os dados foram submetidos à análise de variância e obtidas as estimativas das correlações fenotípicas de Pearson entre os caracteres dois a dois. As linhagens diferem com relação à tolerância à umidade no momento da colheita, sendo que as de maior tolerância apresentam grãos mais claros. A principal dificuldade na seleção de linhagens de feijoeiro comum para a tolerância a alta umidade na colheita é a repetibilidade das condições ambientais entre as safras. A alternativa é avaliar a quantidade de água absorvida pelas vagens.
Termos para indexação: Phaseoulus vulgaris L., correlação, germinação precoce, qualidade de grãos.
(Received in october 10, 2012 and approved in february 1, 2013)
1Universidade Federal de Lavras/UFLA – Departamento de Biologia/DBI – Cx. P. 3037 – 37200-000 – Lavras – MG – Brasil – [email protected] 2Universidade Federal de Lavras/UFLA – Departamento de Biologia/DBI – Lavras – MG – Brasil
3Empresa Brasileira de Pesquisa Agropecuária/EMBRAPA – Arroz e Feijão – Lavras – MG – Brasil INTRODUCTION
Common bean crop in Brazil presents a great deal of diversity in management systems. In the case of family farms, after harvest, the plants are placed in rows and then await the time of threshing in the field. At the other extreme, large rural companies use mechanical harvesting methods. In this case, a reaper that cuts the plants and places them in rows for drying on location is used, and later threshing is performed. For any of these management methods, if harvest coincides with a rainy period, which is frequent in different
crop seasons of common bean in Minas Gerais, seed can to germinate while still in the pod or may become spotted, which significantly reduces their commercial value.
to the mother plant. The phenomenon has already been intensively studied in the maize crop (NEUFFER; COE; WESSLER, 1997; ARAUJO et al., 1997; SUZUKI et al., 2006). Some genes involved with expression of this trait have been observed. In the case of common bean, studies in this regard are scarce. Pryke (1978) observed variation in early germination in a series of common bean crosses grown in a greenhouse.
The aim of the present study was to verify if there is genetic variability among the common bean lines that are in the recommendation phase for farmers in the south of Minas Gerais in regard to moisture tolerance soon after harvest, and identify one or more traits that may be routinely used in selection of lines tolerant to wet conditions that may occur in crops at the time of harvest.
MATERIAL AND METHODS
The experiments were carried out at Plant Genetics and Breeding Sector, Department of Biology at Universidade Federal de Lavras (Federal University of Lavras) (UFLA), in Lavras, MG, Brazil, situated at 24°14’ latitude South and 45° longitude West at a mean altitude of 910 m. Lines in the recommendation phase through the Genetic Breeding Program of UFLA in the period from 2010 to 2012 were assessed. The number of lines assessed in the 2010/2011 rainy season, sown in November, and in the 2011 dry season, sown in February, was 41, with ten lines common to the two crop seasons. The plots were 2 four-meter rows with a randomized block experimental design with three replicates.
Another experiment used was Value for Cultivation and Use (Valor de Cultivo e Uso - VCU). This experiment meets the requirements of the Ministry of Food, Livestock and Agriculture (Ministério da Agricultura, Pecuária e Abastecimento - MAPA) and are carried out in a randomized block design with three replications in a plot of 4 four-meter rows. In VCU 25 lines were evaluated in the winter 2011 crop season, with sowing in July, and the 2011/2012 rainy season, sowing in November 2011.
Altogether, 95 lines were evaluated in the period, with 23 of the VCU, 70 of the elite lines and two controls common to the four experiments. Of these, 11 are commercial cultivars; 43 derived from programs of recurrent selection, 21 being for resistance to angular leaf spot, 16 for yield, five for size and one for various traits simultaneously; 10 from a breeding program for architecture; 8 derived from cross between the cultivars BRSMG Majestoso and BRSMG Madrepérola; 7 derived from cross between the cultivar BRSMG Majestoso and progenies obtained for resistance to anthracnose and 1 from a program for
earliness, all coming from the Universidade Federal de Lavras; 7 lines coming from Embrapa; 7 derived from the common bean breeding program of the Universidade Federal de Viçosa; and 1 coming from the Instituto Agronômico de Campinas.
Until the harvest, was adopted the recommendations made to culture (POSSE, et al., 2010). At harvest, the plants were uprooted and placed in rows in the field in a manner similar to the adopted by farmers. A plant sample from each plot was removed at that time for assessment of germination of the seeds in the pods in a moist chamber and water absorption by the pod and by the seed.
For germination of the seeds in the pods in a moist chamber (GSP), 10 pods from each plot were used. They were rolled up in moistened paper and placed in a moist chamber at a temperature of 25° C with irrigation by spray mist for one minute every three hours. Three assessments per crop season were made in periods that ranged from two to six days with a view toward identifying the period of best discrimination of the lines. After each period, the number of total seeds and those germinated per sampled plot were counted and the germination percentage was obtained. The data obtained in percentage were transformed in arcsin
x
, according to that recommended by Steel, Torrie and Dickey (1997).In assessment of water absorption by the pod (WAP), a sample of five pods per plot was used, which were weighed and placed in a beaker with an equal quantity of distilled water for twelve hours. After this period, they were once more weighed and the percentage of water absorbed was estimated by the following equation: ((wet weight of the pods – dry weight of the pods)/dry weight of the pods) x100.
Another trait assessed was water absorption by the seed (WAS), for which a 100 seed sample per plot was used. The dry seeds were weighed and placed in a beaker containing the same quantity of distilled water, and after four hours they were once more weighed and the percentage of water absorbed was estimated by the following equation: ((Wet weight of the seeds – dry weight of the seeds)/dry weight of the seeds) x 100.
with various seeds germinated and without commercial value to 9 being seeds without spots, not germinated and within commercial standards.
Data in reference to percentage of germination of seeds in the pods in a moist chamber, percentage of water absorption by the pod and by the seeds, and depreciation of the seed were submitted to analysis of variance, initially per crop season and afterwards in combination of crop seasons, using the software R (R DEVELOPMENT CORE TEAM, 2010). Estimates of the Pearson phenotypic correlations were also obtained among traits (RAMALHO; PEREIRA; OLIVEIRA, 2012).
RESULTS AND DISCUSSSION
Summary of joint analysis of variance of the crop seasons for the traits of seed score (SS); percentage of seed germination in the pods (GSP) and percentage of water absorbed by the pods (WAP) and by the seeds (WAS) is shown in table 1. Observe that the estimates of accuracy it was near one for water absorption by the seeds. For the other traits, it was of lesser magnitude, but even so, the precision may be considered as medium to high (RESENDE; DUARTE, 2007). A significant difference (P0.01) was
detected among crop seasons for all traits evaluated. This effect of the crop season may be attributed mainly to environmental conditions (Table 2), especially moisture, at the time of harvest, as well as to the group of lines evaluated in each one of the experiments.
The main problem in selection for tolerance to high moisture at the time of harvest is obtaining the moisture conditions that reflect the environments normally found in the crop conditions of the farmers. Normally farmer pulls up the plants and leaves them in a row on the ground to dry. If rains occur for prolonged periods of day before the harvesting, there is already the possibility of the seeds being damaged, that is, becoming spotted or germinating in the pod. The greatest damage, however, occurs when the rains are intermittent after harvest. In this case, pods in contact with the wet soil are damaged. The damage is caused in accordance with time of exposure and relative humidity. The intensity and duration of rainfall in the different crop seasons is rarely the same. The attempt was made, by means of irrigation, to reproduce the prevailing conditions when there are intermittent rains. That was not possible, evidently due to lower relative air humidity, even when irrigation is performed by spraying. Various
Table 1 – Summary of joint analysis of variance of the 95 lines for the traits of seed score (SS), germination percentage of the seeds in the pods in a spray chamber (GSP) and percentage of water absorption by the pod (WAP) and by the seed (WAS).
Table 2 – Climate data for the harvest period and evaluation of the field experiments in each crop season.
CROP SEASONS MAX. T. MIN. T. MEAN T. RAINFALL R.H.
2010/2011 Rainy 31.1 19.1 23.9 3.4 69.8
2011 Dry 25.2 13.6 18.3 0.3 72.8
2011 Winter 26.9 16.4 20.9 4.3 70.9
2011/2012 Rainy 29.4 18.5 24.7 3.4 69.7
Temperature (T.): °C; Rainfall: mm; Relative humidity (R.H.): %.
SV DF MS
SS GSP WAP WAS
Crop season (S) 3 19.32** 5632.45** 4419.44** 20120.54**
Rep. /Crop season 8 5.74** 2080.32** 177.94 NS 274.02NS
Line (L) 94 9.61** 284.40** 383.24** 1571.03**
S x L 34 6.42** 285.80* 307.58** 573.29**
Mean error 252 1.88 173.52 167.31 128.16
Mean 4.53 34.59 78.34 68.13
F 5.11 1.64 2.29 157.00
Accuracy (%) 89.69 62.44 75.05 99.68
assessments of seed scores were made at the time of threshing and some days after threshing. In this study, only the assessments made at the time of threshing are reported, that is, eight days after harvest. In the other assessments, the results did not differ in an expressive manner as a result of the non-occurrence of rainfall. This fact was quite evident in the effect of the crop seasons. A great deal of the variation among the crop seasons must be attributed to the lack of occurrence of rainfall preceding harvest and post-harvest.
Another alternative to diminish the difference among crop seasons is to submit only the pods of the plants to a moist chamber soon after being collected. The difficulty is in determining the exposure time. If it is very short, it is not sufficient for germination of the seeds in the pods, and if prolonged, it does not allow discrimination among the lines. Therefore assessments were made that ranged from two to six days. It was observed (data not presented) that assessment at four days was most efficient. A significant difference (P0.01) was also observed among the lines for all the traits (Table 1). This fact indicates that it is possible to identify lines that are more tolerant to excessive moisture at the time of harvest of common bean. The significant (P0.05) line x crop season interaction allows one to infer that the lines did not have coinciding
behavior in the different crop seasons. However, this interaction involves only the lines common to the crop seasons. Therefore, the occurrence of interaction may not be extrapolated to all the lines evaluated.
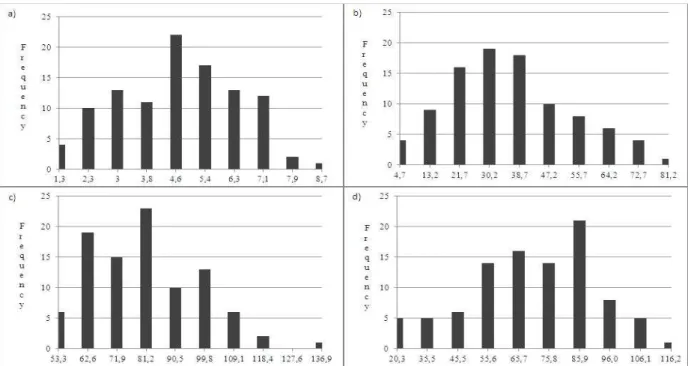
The existence of variation among the lines for seed score at the time of threshing may be observed by the frequency distribution shown in figure 1A. Note that the values ranged from 1.3 to 8.7; in other words, it was possible to identify completely damaged lines up to some that practically maintained the commercial standard, regardless of the high moisture at the time of harvest. It was observed that the lines with highest scores at the time of harvest were those that have lighter colored seeds, that is the lines in which one of the parents is the cultivar BRS MG-Madrepérola, which was recommended for the state of Minas Gerais for maintaining lighter colored seeds for up to six months after harvest, namely lines 71, 73, 70, 75 and 76 (Table 3). The main attribute of this cultivar is “carioca” type seeds (cream colored seeds with light brown stripes) which are very light colored and which darken very slowly during storage (SILVA et al., 2008; ARAÚJO; RAMALHO; ABREU, 2012). The cultivar Branquinho, line 2, which is from a private company, has the same characteristics and was therefore also classified among those that underwent less damage from high moisture at the time of harvest.
Observe that among the ten lines with least germination of the seeds, none of them was included among those with the best seed scores at the time of harvest. This fact indicates that even if there was some seed germinated in the pod, this did not expressively affect the evaluator in attributing seed scores. There was greater emphasis on the appearance of the seeds regardless of being germinated, because at the time of processing, most of the germinated seeds would be eliminated because they have less weight.
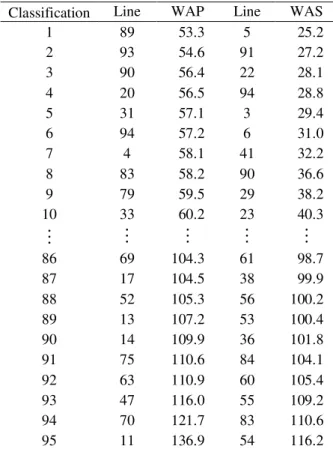
Variation among the lines for percentage of water absorption by the pods and seeds may be observed in figures 1C and 1D. The mean percentage of water absorption was similar in the pods and in the seeds. The amplitude of variation of the percentage of water absorption in the pods was 83.6% and in the seeds 95.9%, therefore, also very similar values. Frequency distribution highlights that it is possible to identify lines that absorb a smaller quantity of water in the pods or in the seeds. It is notable that among ten lines with the least water absorption percentage in the pods, only two would be among those of least absorption in the seeds (Table 4). At the other extreme, among the ten of greatest absorption, water absorption in the pods and in the seeds did not coincide.
Theoretically, the seeds with less water absorption should have a lower percentage of germination in the pods. Although there was a wide variation for this trait among the lines (Figure 1D), association with the percentage of seeds germinated in the pod was very small (Tables 3 and 4). Water absorption by the seeds is negatively correlated with cooking time (IBARRA-PERÉZ; CASTILHO; CUELLAR, 1996; RODRIGUES et al., 2005). Thus, it is possible to select lines more tolerant to germination under the condition of excessive moisture at the time of harvest without affecting the cooking time.
Since common bean purchasers acquire the product by means of visual assessment of the seeds at the time of purchase, it is important to verify which lines have a commercial appearance less affected by excess moisture at the time of harvest. It was observed that it is possible to have good precision in this visual assessment (Table 3); however, the scores obtained did not show expressive association with the percentage of germinated seeds (Table 3). That occurs because, although the evaluator considers the germinated seeds, other aspects are observed, especially maintenance of the characteristic color of the seeds, which are more important at the time of assessment.
Classification Line SS GSP Line GSP SS
1 71 8.6 62.6 20 4.7 3.6
2 73 8.0 76.1 59 7.5 6.0
3 53 7.7 21.1 54 7.6 7.0
4 2 7.3 28.7 56 8.5 4.7
5 70 7.3 72.4 24 11.3 5.3
6 83 7.3 23.7 84 12.0 6.3
7 54 7.0 7.6 29 12.1 5.3
8 75 7.0 31.9 5 13.8 6.0
9 76 7.0 59.1 61 15.2 4.3
10 21 6.7 19.4 81 15.7 6.3
86 9 2.2 36.2 45 62.9 3.0
87 3 2.0 18.9 49 64.6 6.3
88 7 2.0 27.7 74 65.5 4.0
89 35 2.0 52.4 11 66.9 4.0
90 64 2.0 55.1 77 67.3 5.3
91 68 2.0 41.6 8 72.0 4.2
92 36 1.7 40.1 70 72.4 7.3
93 40 1.7 26.2 14 73.1 4.3
94 63 1.3 56.1 73 76.1 8.0
95 69 1.3 48.2 47 81.1 3.7
Table 3 – Mean values of the ten best and worst lines for the trait of seed score (SS) and respective percentages of germination of seeds in the pods in a moist chamber (GSP) and the ten best and worst lines for the trait of percentage of germination of the seeds in the pods in a moist chamber (GSP) and their seed scores (SS).
Estimates of the phenotypic correlations of the traits reinforce what was mentioned above, namely, that the association between the percentage of water absorption in the seeds and in the pods, although significant, was of small magnitude. The greatest estimate of correlation was between the percentage of water absorption by the pods and the percentage of seeds germinated in the pods. All the estimates of correlation with seed scores were near zero (Table 5).
For germination of grains in the pods is necessary that these absorb water. It was observed that the lines showed wide variation in the percentage of water absorbed by the pods (Figure 1C). It was also observed that the association between germination of the seeds and water absorption by the pods was the greatest among the estimates obtained (Table 5). Nevertheless, the coincidence among the ten lines with greatest or least germination of the seeds and of water absorption in the pods was small.
It would be interesting to verify the anatomical difference or chemical composition in the shell of the pods of lines with greatest or least water absorption for the purpose of identification of traits which aid in selection. Unfortunately reports in this respect were not found in the literature.
CONCLUSIONS
There is variability among lines to moisture tolerance after harvest.
Quantity of water absorbed by the pods is the trait that is easily assessed and may be routinely used in selection of lines tolerant to wet conditions at the time of harvest.
ACKNOWLEDGEMENTS
The authors thank the Fundação de Amparo à Pesquisa do Estado de Minas Gerais (FAPEMIG) and the Conselho Nacional de Desenvolvimento Científico e tecnológico (CNPq) for financial support.
REFERENCES
ARAÚJO, L.C.A.; RAMALHO, M.A.P.; ABREU, A.F.B. Estimates of genetic parameters of late seed-coat darkening of carioca type dry beans. Ciência e Agrotecnologia, Lavras, v.36, n.2, p.156-162, mar./apr., 2012.
ARAUJO, P.A. et al. Mapping of a novel
viviparous unstable mutante of maize. Brazilian Journal of Genetics, Ribeirão Preto, v.20, n.1, 71-74, mar., 1997.
AMARO, G.B. et al. Phenotypic recurrent selection in the common bean (Phaseolus vulgaris L.) with carioca-type grains for
resistance to the fungi Phaeoisariopsis griseola. Genetics and Molecular Biology, São Paulo, v.30, n.3, p.584-588, set., 2007.
Classification Line WAP Line WAS
1 89 53.3 5 25.2
2 93 54.6 91 27.2
3 90 56.4 22 28.1
4 20 56.5 94 28.8
5 31 57.1 3 29.4
6 94 57.2 6 31.0
7 4 58.1 41 32.2
8 83 58.2 90 36.6
9 79 59.5 29 38.2
10 33 60.2 23 40.3
86 69 104.3 61 98.7
87 17 104.5 38 99.9
88 52 105.3 56 100.2
89 13 107.2 53 100.4
90 14 109.9 36 101.8
91 75 110.6 84 104.1
92 63 110.9 60 105.4
93 47 116.0 55 109.2
94 70 121.7 83 110.6
95 11 136.9 54 116.2
Table 4 – Mean values of the ten best and worst lines for percentage of water absorption by the pod (WAP) and by the seeds (WAS).
TRAIT GSP WAP WAS SS
GSP - 0.59** 0.13NS -0.12NS
WAP - - 0.33** -0.22 *
WAS - - - -0.10NS
ARANTES, L. de O.; ABREU, A. de F.B.; RAMALHO, M.A.P. Eight cycles of recurrent selection for resistance to angular leaf spot in common bean. Crop Breeding and Applied Biotechnology, Viçosa, v.10, n.3, p. 232-237, set., 2010.
IBARRA-PERÉZ, F.J.; CASTILHO, R.; CUELLAR, E.J. Threshing effect on cooking time in commercial beans cultivars from semiarid highlands of Mexico. Bean Improvement Cooperative, Cali, v.39, p.264-265, feb., 1996.
NEUFFER, G.N.; COE, E.H.; WESSLER, S.R. Mutants of maize. Cold Spring Harbor Laboratory, New York, 1997, 468p.
PRYKE, P.I. Dormancy failure in bean seeds. XXI Annual Report of the Bean Improvement Cooperative, New York: Geneva, n.21, p.40-41, mar., 1978.
POSSE S.C.P. et al. Informações técnicas para o cultivo de feijoeiro-comum na região Central-brasileira: 2009 – 2011. Vitória: Incaper, 2010, 245p.
R DEVELOPMENT CORE TEAM. R: A Language and Environment for Statistical Computing. Vienna, 2010. Available in: <http://www.r-project.org.> Access: 15 July 2012.
RAMALHO, M.A.P.; FERREIRA A.F.; OLIVEIRA, A.C. Experimentação em genética e melhoramento de plantas. Editora UFLA, Lavras, 3. ed., rev., 2012. 305p.
RESENDE, M.D.V. de; DUARTE, J.B. Precisão e controle de qualidade em experimentos de avaliação de cultivares. Pesquisa Agropecuária Tropical, Goiânia, v.37, n.3, p.182-194, 2007.
RODRIGUES, J. A. et al. Correlação entre absorção de água e tempo de cozimento de cultivares de feijão. Ciência Rural, Santa Maria, v.35, n.1, p.209-214, jan-fev, 2005.
SILVA, G.S. et al. Genetic control of early grain darkening of carioca. Crop Breeding and Applied Biotechnology, Viçosa, v.8, n.4, p. 299-304, dec., 2008.
SUZUKI, M.; SETTLES, A. M. et al. The maize
viviparous 15 locus encodes the molybdopterin syrthase small subunit. The Plant Journal. Oxford, v.45, n.2, p.264-274, sept., 2006.
STEEL, R.G.D.; TORRIE, J.H; DICKEY, D.A. Principles and procedures of statistics: A