.ufc.br
ISSN: 1984-2201
Copyright © 2002, Universidade Federal do Ceará ARTICLES
MODIS TIME SERIES ANALYSIS AND
TRMM IN EUCALYPTUS PLANTATIONS
(*)CORRESPONDING AUTHOR
Address: UNIPAMPA, Avenida Antonio Trilha, 1847, sala 01, CEP: 97.300-162, São Gabriel (RS), Brasil. Tel: (+55 55) 32370850.
E-mail: alinetrentin@unipampa.edu.br
Article history:
Received 30 June, 2018 Accepted 3 July
, 2018
Publisher 15 October
, 2018
(a) PhD in Geography. Professor Federal University of Pampa (UNIPAMPA), São Gabriel (RS), Brazil. ORCID ID: https://orcid.org/0000-0001-9747-9289. CURRICULUM LATTES: http://lattes.cnpq.br/6193856926860898
(b) PhD in Remote sensing. Professor Federal University Mato Grosso (UFMT), Barra do Garças (MT), Brazil. ORCID ID: https://orcid.org/0000-0002-7678-1320. CURRICULUM LATTES: http://lattes.cnpq.br/9276319691147227
(c) PhD in Geosciences. Professor Federal University of Rio Grande do Sul (UFRGS), Porto Alegre (RS), Brazil. CURRICULUM LATTES:
http://lattes.cnpq.br/6210076629411784
(d) PhD in in Geography. National Institute of Space Research (INPE), Santa Maria (RS), Brazil. ORCID ID: https://orcid.org/0000-0003-0657-4024. CURRICULUM LATTES: http://lattes.cnpq.br/8997858562195060
TRENTIN, Aline Biasoli; a * TRENTIN, Carline Biasoli; b
SALDANHA, Dejanira Luderitz; c KUPLICH, Tatiana Mora; d
ABSTRACT
The objective of this work was to analyze and compare spectral indexes in eucalyptus plantations and correlate them with precipitation data for the period from 2003 to 2012, in order to assess whether climate change has an influence on vegetation phenology. The methodology entailed obtaining the mean spectral indexes (NDVI, EVI and GPP) of MODIS images and elaborating the temporal profiles of the eucalyptus vegetation, for both cloned seedlings and those grown from seeds. These profiles were correlated with TRMM precipitation data. The results showed NDVI values higher than the EVI, although a clearly de-fined seasonality was not present, whereas the GPP demonstrated a well-dede-fined seasonal behavior in all of the years. The correlation between the spectral indices and the precipitation had representative results for some years, including El Niño and La Niña periods. It was concluded that MODIS products allow the evaluation of phenological cycles in eucalyptus plantations, principally for the planting and cutting phases. Keywords: Spectral indices; MODIS sensor; Stands of eucalyptus.
RESUMO / RESUMEN
ANÁLISE DE SÉRIES TEMPORAIS MODIS E TRMM EM PLANTIOS DE EUCALIPTO
O objetivo deste trabalho foi analisar e comparar índices espectrais em plantios de eucalipto e cor-relacioná-los com dados de precipitação para o período de 2003 a 2012, a fim de avaliar se as alterações climáticas tem influência na fenologia da vegetação. A metodologia consistiu na obtenção das médias dos índices espectrais (NDVI, EVI e GPP) de imagens MODIS e a elaboração dos perfis temporais da vegetação de eucalipto, considerando mudas clonais e de semente. Estes perfis foram correlacionados com dados de precipitação do TRMM. Os resultados mostraram valores de NDVI superiores ao EVI, porém sem sazo -nalidade claramente definida, enquanto o GPP demonstrou comportamento sazonal bem definido em todos os anos. A correlação entre os índices espectrais e a precipitação apresentou resultados representativos para alguns anos, incluindo períodos de El Niño e La Niña. Concluiu-se que os produtos MODIS permitem a avaliação dos ciclos fenológicos em plantios de eucalipto, principalmente para as fases de plantio e corte. Palavras chaves: Índices espectrais; Sensor MODIS; Povoamentos de eucalipto.
ANÁLISIS DE SERIES TEMPORAIS MODIS Y TRMM EN PLANTIOS DE EUCALIPTO
El objetivo de este trabajo fue analizar y comparar índices espectrales en plantaciones de eucalipto y correlacionarlos con los datos de precipitaciones para el periodo de 2003 a 2012, con el fin de evaluar si el cambio climático influye en la fenología de vegetación. La metodología consistió en la obtención de medidas de los índices espectrales (NDVI, EVI e GPP) de imágenes MODIS y la elaboración de los perfiles temporales de la vegetación de eucalipto, considerando plantas clonadas y de semilla. Estos perfiles fueron correlacionados con datos de precipitación del TRMM. Los resultados mostraron valores de NDVI supe-riores al EVI, pero sin estacionalidad claramente definida, sin embargo el GPP demostró comportamiento estacional bien definido em todos los años. La correlación entre los índices espectrales y la precipitación presentó resultados representativos en algunos años, incluyendo periodos de El Niño y La Niña. Se concluye que los productos MODIS permiten la evaluación de los ciclos fenológicos en plantaciones de eucalipto, principalmente para las fases de plantío y corte.
Palabras Claves: Índices espectrales; Sensor MODIS; Plantaciones de eucalipto.
www
.mercator
INTRODUCTION
Constant updates of the dynamics of land cover allow new information to be obtained on areas with different uses. Remote sensing is a technique that can provide subsidies for the monitoring of the Earth’s surface, generating continuous data in time and space. Allied to the spatial distribution of georeferenced quantitative data, it allows the spatial and temporal patterns of the various uses and land cover to be determined, making it an important tool for environmental planning.
Remote sensing provides data for the identification and description of ecosystems on multiple scales (Paruelo et al., 2001; SUN et al., 2008). Remotely collected images and the products derived from them can help understand the seasonal dynamics of vegetation (LIANG and SCHWARTZ, 2009), the estimate of land cover and changes on different spatial scales (IPCC, 2001).
The interaction between plant canopies and electromagnetic energy in the process of photosyn-thesis is directly related to how these physiognomies are recorded by remote sensing instruments (JENSEN, 2009). Each plant physiognomy has its own characteristics and structure and, therefore, responds differently to the availability of the components involved in the process of photosynthesis. Based on the complexity of electromagnetic radiation (REM) interactions with plant canopies, indices were created that highlight the differences between the large REM absorption in the visible spectral region of the spectrum and the reflectance in the near infrared spectral region (PONZONI, SHIMABUKURO, 2009). The concept of vegetation index (VI) refers to a spectral transformation of two or more bands, indicated to emphasize the vegetation’s properties, allowing spatial and tem-poral comparisons of the photosynthetic activity and the structural variations of the canopy (HUETE et al., 2002). Moreover, these indices minimize the variability caused by factors external to the vegetation and serve as indicators of the growth and vigor of green vegetation (JENSEN, 2009).
The use of satellite images to obtain data more accurately favors studies related to surface targets and their modifications, as well as biophysical vegetation data, among others (BRIZUELA; MILERA, 2003). To determine spatial / temporal patterns and vegetation monitoring on regional scales (ANDERSON; SHIMABUKURO, 2007), the use of MODIS sensor products (MODerate--resolution Imaging Spectroradiometer) on board TERRA and AQUA platforms, which provide free data and with high frequency, are worthy of note. The data are recorded in spectral bands designed to develop products that can provide specific information about the Earth’s surface and atmosphere.
Among the MODIS products related to the study of terrestrial ecosystems with an emphasis on vegetation are: (i) MOD13 - containing NDVI (Normalized Difference Vegetation Index) and EVI (Enhanced Vegetation Index) vegetation indices, available every 16 days with a spatial resolution of 1 km, 500 m and 250 m (LATORRE et al., 2007) and (ii) the MOD17 product - which contains the data on Gross Primary Production - GPP, with a spatial resolution of 1 km and a periodicity of 8 days (LATORRE et al., 2007).
The objective of this work is to analyze and compare the temporal behavior of the NDVI, EVI and GPP indices in eucalyptus plantations (clonal and seed) in an area of Rio Grande do Sul and correlate them with precipitation data derived from TRMM (Tropical Rainfall Measuring Mission), considering the period from 2003 to 2012.
STUDY AREA
.ufc.br
MODIS Time Series Analysis and TRMM in Eucalyptus Plantations
CMPC - Celulose Riograndense, established in the municipality of Guaíba and responsible for this sector of production.
MATERIALS AND METHODS
To elaborate the temporal series for the eucalyptus vegetation, scenes from the MODIS sensor (tile h13v12) - MOD13Q1 (NDVI and EVI) and MOD17A2 (GPP) products were used. These were made freely available from the Land Processes Distributed Active Archive Center (LP DAAC) / NASA. A total of 23 annual scenes (2 monthly scenes, with the exception of October, with 1 scene) of the three products corresponding to the time series between 2003 and 2012 (totaling 230 scenes - 10 years) were used, with the purpose of analyzing the temporality of the data.
The NDVI and EVI images have a spatial resolution of 250 meters and result from a mosaic of pixels chosen from the daily images in an interval of sixteen days, aiming to extract better quality pixels (without interference from clouds and noise). As for the GPP images, they have a spatial resolution of 1 kilometer and result from an 8-day pixel composition (LATORRE et al., 2007). For the purpose of comparison with similar dates, the GPP images were selected at 16 day intervals, according to the dates of the NDVI and EVI scenes.
In order to modify the format of the files (* .hdf to * .tif) and attribute a cartographic projec -tion, the images were preprocessed with the MRTools software and subsequently incorporated into a database in the Spring 5.1.8 application.
In the Spring 5.1.8 application, polygons with the area corresponding to the pixel size of each product (NDVI and EVI - 250 meters and GPP - 1 kilometer) were generated and related to each plot to be analyzed: three plots with clonal eucalyptus plantations (HF 001, 012 and 071) and three with seedlings (HF 026, 077 and 120) (Figure 1). The stands were chosen for their planting dates during the course of 2003, allowing the phases of vegetation growth since planting to be analysed.
www
.mercator
After the polygons had been vectored, the average of each sample / polygon was extracted for each of the MODIS scenes that compose the time series. To this end, descriptive statistical data were used in the exploratory data analysis tool contained in the Spring application. The values of the averages were plotted in Microsoft Excel software, where graphs were created to describe the temporal behavior of each field.
The relationship between the precipitation and time series data (NDVI, EVI and GPP) was obtained by means of simple linear correlation, calculated in the Microsoft Excel software, betwe-en the annual averages of the spectral variables and the annual average of the precipitation. The rainfall series used in this study was organized by Freitas et al. (2011) using the TRMM product (Tropical Rainfall Measuring Mission). The TRMM data (3B43V6) was acquired using the GES DISC DAAC (Distributed Active Archive System) which is part of NASA’s Goddard Earth Scien-ces (GES) Data and Information ServiScien-ces Center (DISC). The TRMM product corresponds to a series of monthly cumulative precipitation, with an area of approximately 0.25 degrees (27.7 km). The precipitation value was extracted from 1 TRMM pixel at the position closest to the geographic coordinate indicated for each plot.
RESULTS AND DISCUSSION
SPECTRAL INDICES
The graphs representing the EVI time series show values between 0.2 and 0.8 for all the plots. In general, considering the whole temporal series, the clonal eucalyptus species showed small variations (approximately 0.2) between the plots (Figure 2A), while the seedlings (Figure 2B) had greater variations (approximately 0.4) in the same EVI interval (2003-2012). This behavior was reversed in the second and third year of growth, possibly in response to maintenance fertilization (which occurs around 1 year). In addition, this characteristic may be related to soil type, water avai-lability and genetic material, which may present different growth behaviors in different locations (FERREIRA, 2007).
Figure 2 - EVI Time series (2003-2012) in clonal eucalyptus (A) and seed (B) plots.
.ufc.br
MODIS Time Series Analysis and TRMM in Eucalyptus Plantations
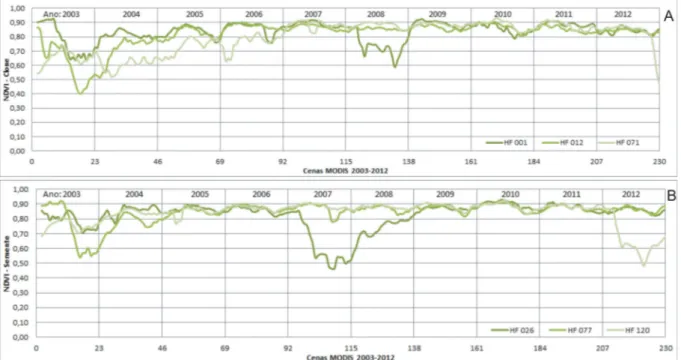
Regarding the NDVI data, represented in figure 4, the interval of values in the clonal and seed plots was 0.4 to 0.9. Among the clonal plots (Figure 3A) there was greater variation in the first years of planting (up to 5 years), followed by a stabilization and little variation from the sixth year onward (scenes 115-138). In HF 001 there was a decline in NDVI in the year 2008, which may be associated to spectral mixing of other targets in the pixel used in the sampling, due to the cutting of vegetation.
The plots planted with seedlings (Figure 3B) show less variation when compared to clonal stands. The exception occurs in HF 026 in the year 2007 (scenes 92-115), which shows a significant fall in the NDVI value, possibly caused by cutting the trees to start a new planting cycle.
Figure 3 - Time series (2003-2012) of NDVI in clonal eucalyptus (A) and seed (B) plots.
In comparison, HF 012 and 077 (clone and seed, respectively) show behavior and values similar to those found by Marsden et al. (2010) and Maire et al. (2011), where the date of the harvest of the previous cycle, the date of planting and the initial period of growth are well defined, with values similar to soil reflectance in the initial growth period, already reaching maximum NDVI values in the second year of planting.
As an example, the behavior of HF 026 can be observed in the EVI and NDVI images, shown in Figure 4. In both, the pixel corresponding to HF 026 has a darker shade when compared to the pixel referring to HF 077. Thus, according to the aforementioned hypothesis for HF 026, the decline in the EVI and NDVI graphs can be confirmed in the images.
www
.mercator
Figure 4 - EVI and NDVI Image (Julian day 257 - year 2007), highlighting the seed plots 026 and 077.
The GPP plots of the clonal (Figure 5A) and seed (Figure 5B) plantations show a similar range of variation (from 2 to 10) and a defined seasonal character, with lower productivity in the winter period and higher in the summer period. In seedlings, there were no differences between the plots. In the graph of the clonal plantation, HF 012 shows smaller values along the time series in relation to HF 001 and 071, which do not display differences between them. The alteration found in HF 012 may be related to the spectral confusion between land cover typologies due to the pixel size (1km), the species, the use of fertilizer or even an error related to the time of planting.
Figure 5 - Time series (2003-2012) of GPP in clonal eucalyptus (A) and seed (B) plots.
.ufc.br
MODIS Time Series Analysis and TRMM in Eucalyptus Plantations
SPECTRAL INDEXES AND PRECIPITATION
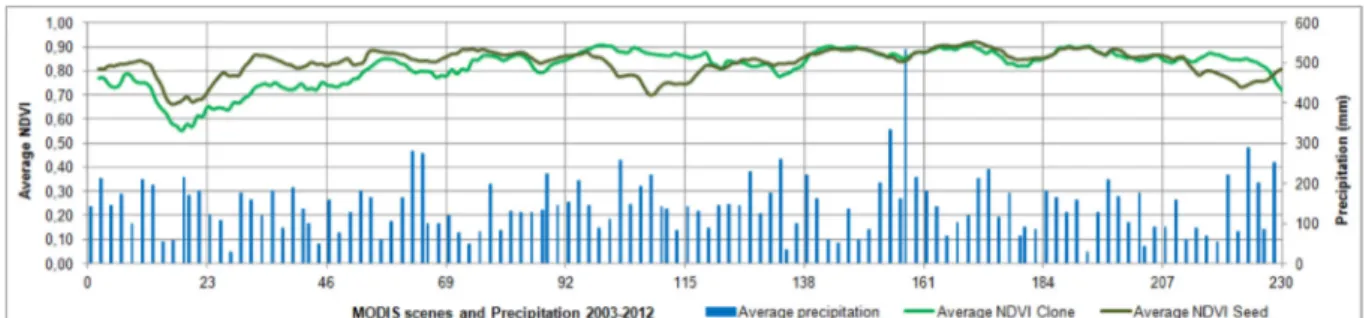
The graphs representing the mean vegetation indexes EVI (Figure 6) and NDVI (Figure 7) show that the NDVI values (0.5 to 0.9) are higher than the EVI values (0.3 to 0.7) , as has already been highlighted in the charts that presented the individual plots.
Figure 6 - Mean of EVI in the clonal and seed plots and its relationship to the cumulative monthly precipitation between 2003-2012.
Observing the annual development of the stands, between planting until approximately the fourth year of growth, the average EVI and NDVI of the seedlings is higher than the clonal plots.
Figure 7 - Average NDVI in the clonal and seed plots and its relationship to the cumulative monthly precipitation between 2003-2012.
This difference may be related to the leaf shape of clonal and seed trees. In general, the clonal plants are from the eucalyptus species saligna, which has a narrow and elongated leaf, while the seed trees generally belong to the species dunnii, and in the first years of development their leaves are more rounded (Figure 8). These characteristics can interfere in the foliar reflectance.
The overall behavior of clonal planting, observed in both the EVI and NDVI data, shows a gradual increase from planting until a peak is reached in the fourth year. The average planting by seed only shows gradual growth in the first year and stabilizes from this time onward. With this difference, it can be affirmed that from the fourth year of growth of the clonal and seed plants, the averages are practically even, demonstrating that the stands have reached their peak growth.
www
.mercator
Figure 8 - Difference between Saligna and Dunnii Eucalyptus leaves.
Contrary to what was observed in this study, Ribeiro et al. (2009), in a study in the State of Espírito Santo, obtained synchrony between the EVI multitemporal data set and climatic variables (such as precipitation), possibly due to the well defined seasonality of the precipitation, unlike the conditions that occur in Rio Grande do Sul.
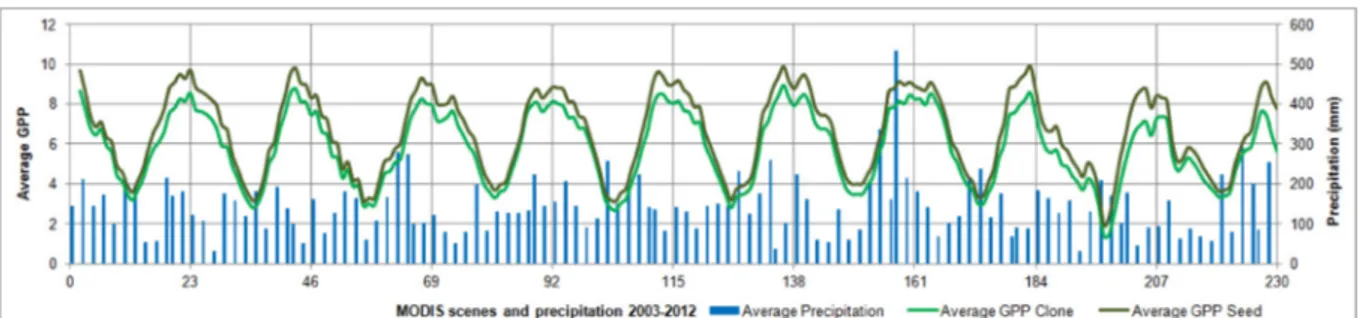
The graph representing the productivity - GPP (Figure 9) also did not present a well-defined relationship with the precipitation, as it did with the EVI and NDVI indices. Considering that the State of Rio Grande do Sul does not have clear seasonal conditions in relation to precipitation, the use of a temperature variable, which has well-defined seasonal conditions in the state, could be considered as hypothesis, and in this case, it could better explain the relationship between eucalyptus tree planting and a climatic variable.
Figure 9 - Average CPG in the clonal and seed plots and its relationship to the cumulative monthly precipitation between 2003-2012.
Although the data (spectral indices and precipitation) did not present visually consistent rela-tionships, statistically it was possible to obtain linear associations (95% confidence level) between the annual averages of the spectral variables and the annual average precipitation (Table 1). The following are noteworthy for the clonal plantations: the NDVI in 2012, the EVI in the years 2003 and 2005 and the GPP in 2008 and 2010. With regard to the seedlings, there is a correlation trend for NDVI data in 2006, for EVI in 2003 and 2005, and GPP in 2008 and 2010. Correlations be-tween the data were also tested, considering the late response of precipitation on tree plantations. However, these relationships did not present significant trends.
.ufc.br
MODIS Time Series Analysis and TRMM in Eucalyptus Plantations
on NDVI and consequently on productivity, with a strong correlation (average of 0.79 in gallery forests) when the spatial scale is adequate.
Table 1 - Annual linear correlations in the period 2003-2012 between the annual averages of the MODIS spectral indexes and the TRMM precipitation.
R Clone 2003 2004 2005 2006 2007 2008 2009 2010 2011 2012
NDVI 0,3390 0,2468 -0,0670 0,0488 -0,2425 -0,3027 -0,3979 0,2393 -0,0858 -0,4153
EVI 0,4408 0,0159 -0,4161 -0,1373 0,3140 -0,0246 -0,2960 -0,0434 0,1485 -0,3451
GPP 0,0003 -0,3216 0,1013 0,0575 -0,3581 -0,4550 0,3848 -0,4858 -0,3540 -0,0779
R Semente 2003 2004 2005 2006 2007 2008 2009 2010 2011 2012
NDVI 0,3355 0,3051 -0,1135 -0,4266 -0,1643 0,0403 -0,3828 0,2829 0,0103 -0,0911
EVI 0,5239 -0,3229 -0,6415 -0,1990 -0,0570 -0,3331 -0,2863 -0,1142 0,2215 -0,1464
GPP -0,0112 -0,3450 0,0992 0,0494 -0,3154 -0,4419 0,3933 -0,4930 -0,3001 0,0315
The values highlighted present significant correlation coefficient α = 5%.
With these results, and in connection with El Niño and La Niña years (CPTEC / INPE), it was observed that in 2002-2003 and 2004-2005 the El Niño phenomenon occurred with moderate and weak intensity, respectively, exactly in the years with a significant correlation with the EVI data. In the same context, in the years when there were correlations with GPP data (2008 and 2010), the La Niña and El Niño phenomena (strong and weak, respectively) occurred. These data indicate the correlation between the precipitation anomalies of the El Niño and La Niña phenomena with the plant variables represented by the MODIS data. However, additional studies are needed to confirm this hypothesis, since they are observations in a short time period and other non-climatic factors may be interfering.
Still observing the results in relation to seasonal behavior, mainly of GPP, the significant va -riation of this index according to the seasons of the year is noteworthy. Thus, climatic temperature data could result in better correlations with the spectral indices for this region, since in the State of Rio Grande do Sul the seasonal dynamics are more influenced by temperature than by precipita -tion. Santana et al. (2008) emphasize that growth factors can become limiting for plants: for a few minutes (temperature), others for days, weeks (water) or even months (nutrients), highlighting the importance of the relationship between climatic conditions and plants.
FINAL CONSIDERATIONS
The temporal comparison of MODIS spectral indices allowed the identification of the spectral behavior of eucalyptus vegetation from the planting season, followed by vegetation growth and the cutting period. The NDVI and EVI did not present very marked seasonal behavior, unlike the GPP, which clearly showed the difference between the winter and summer phases in eucalyptus stands. These results showed the MODIS’ capacity, mainly to evaluate the planting and cutting phases.
www
.mercator
ACKNOWLEDGEMENTS
The first author thanks the Coordination of Improvement of Personnel (CAPES) for granting the doctoral scholarship and the company Celulose Riograndense for their support of the work.
BIBLIOGRAPHIC REFERENCE
ANDERSON, L. O.; SHIMABUKURO, Y. E. Monitoramento da cobertura terrestre: fenologia e alterações
antrópicas. In: B. F. T. RUDORFF; Y. E. SHIMABUKURO; J. C. CEBALLOS. (Org.). Sensor MODIS e
suas aplicações ambientais no Brasil. São José dos Campos: Editora Parêntese, 2007. p. 185-206.
BRIZUELA, A. B.; MILERA, S. G. Actualización de la superficie forestada en cuatro Departamentos de la
Provincia de Entre Ríos. Revista Científica Agropecuaria, Paraná, v. 7, n. 1, Facultad de Ciencias
Agro-pecuarias – UNER, p. 45-50, 2003.
CPTEC - Centro de Previsão de Tempo e Estudos Climáticos. El Niño e La Niña. Disponível em <enos.
cptec.inpe.br/>.
FERREIRA, J. M. A. Ganhos de produtividade de plantações clonais de Eucalyptus Urophylla e suas
correlações com variáveis edafoclimáticas e silviculturais. 2007. 85 f. Dissertação (Mestrado em Ciências
Florestais) - ESALQ/USP, Piracicaba, 2007.
FREITAS, R.M. et. al. Virtual laboratory of remote sensing series: visualization of MODIS EVI2 data set
over South America. Journal of Computational Interdisciplinary Sciences, v. 2, n.1, p. 57-68, 2011.
HUETE, A., et. al. Overview of the radiometric and biophysical performance of the MODIS vegetation
indices. Remote Sensing of Environment, v. 83, p. 195–213, 2002.
IPCC – Painel Intergovernamental Sobre Mudanças do Clima. Climate Change 2001: The Scientific Basis.
Third Assessment Report, 2001. Disponível em <grida.no/publications/other/ipcc_tar/>.
JENSEN, J. R. Sensoriamento Remoto do Ambiente: uma perspectiva em recursos terrestres. Tradução:
EPIPHANIO, J. C. N. et al. São José dos Campos: Parêntese, 2009.
LATORRE, M. L., et al. Produtos para ecossistemas terrestres – MOD-LAND. In: B. F. T. RUDORFF; Y.
E. SHIMABUKURO; J. C. CEBALLOS. (Org.). Sensor MODIS e suas aplicações ambientais no Brasil.
São José dos Campos: Editora Parêntese, 2007. p. 185-206.
LIANG L.; SCHWARTZ M.D. Landscape phenology: an integrative approach to seasonal vegetation
dyna-mics. Landscape Ecology, n. 24, p. 465-472, 2009.
MAIRE, G., et al. MODIS NDVI time-series allow the monitoring of Eucalyptus plantation biomass. Remote
Sensing of Environment, v. 115, p. 2613–2625, 2011.
MARSDEN, C., et al. Relating MODIS vegetation index time-series with structure, light absorption and
stem production of fast-growing Eucalyptus plantations. Forest Ecology and Management, v. 259, p.
1741–1753, 2010.
PARUELO, J.M., et al. Current distribution of ecosystem functional types in temperate South America.
Ecosystems, n. 4, p. 683-698, 2001.
PONZONI, F. J.; SHIMABUKURO, Y. E. Sensoriamento Remoto no estudo da vegetação. São José dos
Campos: Parêntese, 2009.
RIBEIRO, C. A. D., et al. Correlações entre variáveis climáticas e séries multitemporais EVI em floresta
natural e em cultivo agrícola. Cerne, Lavras, v. 15, n. 2, p. 196-204, 2009.
SANTANA, R. C., et al. Estimativa de biomassa de plantios de eucalipto no Brasil. Revista Árvore, Viçosa,
v. 32, n. 4, p. 697-706, 2008.
SOARES, J. V., et al. Histórico e Descrição. In: RUDORFF, B. F. T.; SHIMABUKURO, Y. E.; CEBALLOS,
J. C. (Org.). Sensor MODIS e suas aplicações ambientais no Brasil. São José dos Campos: Editora Pa
-rêntese, 2007. p. 3-21.
SUN W., et al. Mapping plant functional types from MODIS data using multisource evidential reasoning.
.ufc.br
MODIS Time Series Analysis and TRMM in Eucalyptus Plantations
WANG, J., et al. Temporal responses of NDVI to precipitation and temperature in the central Great Plains,