Joana Margarida Franco Dantas
Licenciatura em Química Aplicada
Follow the red road of triheme cytochromes in
Geobacter sulfurreducens
Dissertação para obtenção do Grau de Mestre em
Bioquímica Estrutural e Funcional
Orientador: Prof. Doutor Carlos A. Salgueiro, Professor Auxiliar,
Faculdade de Ciências e Tecnologia, Universidade Nova de Lisboa
Júri
Presidente: Prof. Doutor José Ricardo Ramos Franco Tavares
Arguente: Prof. Doutor Vítor Manuel Bordona de Sousa Paixão
Universidade Nova de Lisboa
Joana Margarida Franco Dantas
Licenciatura em Química Aplicada
Follow the red road of triheme cytochromes in
Geobacter sulfurreducens
Dissertação para obtenção do Grau de
Mestre em Bioquímica Estrutural e Funcional
Orientador: Prof. Doutor Carlos A. Salgueiro, Professor Auxiliar,
Faculdade de Ciências e Tecnologia, Universidade Nova de Lisboa
iii
Follow the red road of triheme cytochromes in
Geobacter
sulfurreducens
“Copyright”
Joana Margarida Franco Dantas
Faculdade de Ciências e Tecnologia
Universidade Nova de Lisboa
Os capítulos 3 e 4 foram parcialmente reproduzidos de artigos publicados sob permissão dos editores originais e sujeitos às restrições de cópia impostos pelos mesmos.
Agradecimentos 2012
v
AGRADECIMENTOS
Um trabalho desta natureza envolve a participação directa ou indirecta de várias pessoas a quem desejo expressar os meus agradecimentos. Em especial:
Ao Prof. Doutor Carlos Alberto Gomes Salgueiro, meu orientador, por exigir sempre o melhor dos seus alunos, por todo o conhecimento transmitido e abertura de novas perspectivas, pelo empenho, pelo exemplo de dedicação à investigação científica e ao trabalho de equipa, pela disponibilidade que sempre manifestou, assim como pela confiança e estímulo para prosseguir e nunca desistir, mesmo em situações complicadas.
À Doutora Leonor Morgado, pela disponibilidade para partilhar o conhecimento e as técnicas laboratoriais, bem como pela boa disposição, companheirismo e pelos momentos de descontracção e conversas diárias.
Às minhas colegas Ana Fernandes e Marta Silva, bem como a todos os outros colegas que passaram pelo Lab. 611, pelo trabalho, dinamismo e alegria que colocam no que fazem. Em particular gostaria de agradecer à Leonor Morgado e Ana Fernandes por terem realizado a expressão e purificação das proteinas PpcB-E, procedimento essencial para a obtenção dos resultados presentes nesta tese, no Capítulo 3.
À Doutora Isabel Couto, pela análise criteriosa deste trabalho e pelas preciosas sugestões transmitidas.
Ao Doutor Ricardo Louro e Ivo Saraiva por terem cooperado no trabalho apresentado no Capítulo 3, tendo determinado a geometria dos ligandos axiais das proteínas PpcA-E.
À Prof. Doutora Maria Manuel Marques e ao Doutor Ângelo Figueiredo, pela clarificação das minhas dúvidas relativas ao trabalho realizado no Capítulo 5.
Ao Doutor Filipe Folgosa pela “má/boa disposição”, pelos conselhos acertados e por dispensar um espaço na arca a -80ºC, essencial para o armazenamento de células competentes.
Aos meus colegas do Mestrado em Bioquímica Estrutural e Funcional, nomeadamente ao Daniel Duarte, à Diana Ribeiro, à Cláudia Couto, à Sofia Garcia, agradeço o companheirismo e capacidade de trabalho em equipa demonstrados durante os momentos mais difíceis deste mestrado, bem como a boa disposição sempre presente.
vi
instalação dos programas de cálculo das estruturas de proteínas, essencial para a conclusão da estrutura do PpcAF15L.À minha grande amiga Sofia Lopes, com a qual, desde os três anos, pude partilhar os bons e os maus momentos.
Aos meus amigos de longa data, nomeadamente “Pessoal fixe de Algés, Miraflores, Linda-a-Velha, Queijas e Dafundo!”, bem como aos meus amigos da FCT-UNL pelo apoio, preocupação e por compreenderem o facto, de por vezes, não estar presente quando o trabalho se sobrepunha ao lazer.
Ao Daniel, por estar sempre presente tanto nos períodos conturbados como também nos bons momentos.
Por fim, gostaria de agradecer à minha família, que sempre me apoiou nesta minha teimosia
da dita “investigação”. Gostaria de agradecer à minha mãe pela paciência demonstrada mesmo nos dias em que o trabalho se prolongou até depois da hora de jantar “sagrada”, bem como pelos conselhos e pelas conversas relativas a este mestrado essenciais nos dias mais complicados. Ao “pai Dantas” pela ajuda na construção da caixa de luzes que tem dado muito
Abstract 2012
vii
ABSTRACT
The bacterium Geobacter sulfurreducens (Gs) is capable of oxidizing a large variety of
compounds relaying electrons out of the cytoplasm and across the membrane in a process designated as extracellular electron transfer. The Gs genome was fully sequenced and a family
composed by five periplasmic triheme cytochromes c7 (designated PpcA-E) was identified. These cytochromes play an important role in the reduction of extracellular acceptors. They contain approximately 70 amino acids, three heme groups with bis-histidinyl axial coordination, and share between 57 and 77% sequence identity.
The triheme cytochrome PpcA is highly abundant in Gs and is most likely the reservoir of
electrons destined for outer surface. In addition to its role in electron transfer pathways this protein can perform e-/H+ energy transduction, a process that is disrupted when the strictly
conserved aromatic residue phenylalanine 15 is replaced by a leucine (PpcAF15L).
This Thesis focuses on the expression, purification and characterization of these proteins using Nuclear Magnetic Resonance and ultraviolet-visible spectroscopy.
The orientations of the heme axial histidine ring planes and the orientation of the heme magnetic axis were determined for each Gs triheme cytochrome. The comparison of the
orientations obtained in solution with the crystal structures available showed significant differences. The results obtained provide the paramagnetic constraints to include in the future refinement of the solution structure in the oxidized state.
In this work was also determined the solution structure and the pH-dependent conformational changes of the PpcAF15L allowing infer the structural origin for e-/H+ energy transduction mechanism as shown by PpcA.
Finally, the backbone and side chain NH signals of PpcA were used to map interactions between this protein and the putative redox partner 9,10-anthraquinone-2,6-disulfonate (AQDS). In this work a molecular interaction was identified for the first time between PpcA and AQDS, constituting the first step toward the rationalization of the Gs respiratory chain.
Keywords: Geobacter; electron transfer; multiheme cytochrome; NMR; protein interactions;
Resumo 2012
ix
RESUMO
A bactéria Geobacter sulfurreducens (Gs) tem a capacidade de oxidar uma grande variedade
de compostos transferindo electrões para o exterior da célula, num processo designado por tranferência extracelular de electrões. A sequência do genoma da bactéria Gs permitiu
identificar uma família de cinco citocromos c7 tri-hémicos, denominados de PpcA-E. Estes citocromos encontram-se localizados no periplasma, onde desempenham um papel importante nas vias metabólicas envolvidas na redução de aceitadores extracelulares. Estas proteínas são constituídas por aproximadamente 70 aminoácidos e três grupos hemo axialmente coordenados por duas histidinas, partilhando 57 a 77% de homologia. Destas proteínas, o citocromo PpcA é o mais abundante, sendo considerado um reservatório de electrões que se destinam à superficie externa desta bactéria. Para além desta função, esta proteína tem ainda a capacidade de acoplar a transferência de electrões e protões. Este mecanismo é interrompido quando o aminoácido fenilalanina 15, um resíduo aromático conservado na família de citocromos c7, é substituído por uma leucina (PpcAF15L).
Nesta Tese efectuou-se a caracterização destas proteínas supracitadas, utilizando espectroscopia de Ressonância Magnética Nuclear (RMN) e de utravioleta-visível. A orientação dos anéis das histidinas ligadas axialmente aos grupos hemo, bem como a orientação dos eixos magnéticos destes grupos, foram determinadas para cada citocromo tri-hémico de Gs. A
comparação das orientações em solução com as obtidas por cristalografia de raios-X demonstrou que as mesmas não são conservadas. Os resultados obtidos poderão ser utilizados no futuro como restrições adicionais no cálculo de estruturas em solução no estado oxidado.
Neste trabalho foi também determinada a estrutura em solução do mutante PpcAF15L, bem como as alterações conformacionais associadas à variação do pH. Este estudo permitiu compreender as bases estruturais do mecanismo de transdução de energia e-/H+ observado no PpcA.
Por último, os sinais NH da cadeia polipeptídica e das cadeias laterais dos resíduos de PpcA foram utilizados no mapeamento de interacções entre esta proteína e o possível parceiro redox
9,10-anthraquinone-2,6-disulfonate (AQDS). Foi identificada pela primeira vez uma interacção
molecular entre o PpcA e o AQDS, facto que constitui um passo fundamental na compreensão da cadeia respiratória de Gs.
Termos chave: Geobacter; transferência de electrões; citocromos multi-hémicos; RMN;
Table of contents 2012
xi
TABLE OF CONTENTS
AGRADECIMENTOS ... v
ABSTRACT ... vii
RESUMO ... ix
TABLE OF CONTENTS ... xi
LIST OF FIGURES ... xiii
LIST OF TABLES ... xv
LIST OF ABBREVIATIONS AND SYMBOLS ... xvii
1. Introduction ... 1
1.1MODEL FOR EXTRACELLULAR ELECTRON TRANSFER IN THE BACTERIUM G. SULFURREDUCENS ... 4
1.2STRUCTURAL FEATURES OF PERIPLASMIC TRIHEME CYTOCHROMES OF G. SULFURREDUCENS ... 5
1.3FUNCTIONAL FEATURES OF PERIPLASMIC TRIHEME CYTOCHROMES FROM GS ... 9
2. Experimental procedures ... 13
2.1BASIC PRINCIPLES OF NMR ... 15
2.2BACTERIAL GROWTH AND PROTEIN PURIFICATION ... 18
2.3NMR STUDIES ... 19
2.3.1PREPARATION OF NMR SAMPLES ... 19
2.3.2NMR EXPERIMENTS IN THE REDUCED FORM ... 20
2.3.3NMR EXPERIMENTS IN THE OXIDIZED FORM ... 20
2.3.4 PH TITRATION OF THE PPCA MUTANT ... 20
2.3.51H-15NHSQCNMRTITRATIONS OF PPCA IN THE PRESENCE OF AQDS ... 21
2.4METHODOLOGY USED IN THE ASSIGNMENT OF THE NMR SIGNALS ... 22
2.4.1ASSIGNMENT OF THE HEME SUBSTITUENTS IN GS TRIHEME CYTOCHROMES ... 22
2.4.2ASSIGNMENT OF THE PROTEIN BACKBONE AND SIDE CHAIN SIGNALS IN PPCA MUTANT F15L ... 24
2.5DETERMINATION OF THE AXIAL LIGAND GEOMETRY ... 24
2.6STRUCTURE CALCULATION AND ANALYSIS ... 25
2.7UV-VISIBLE STUDIES ... 26
2.7.1ASSAYS OF AH2QDS OXIDATION COUPLED TO PPCA REDUCTION ... 26
2.7.2ASSAYS OF AQDS REDUCTION COUPLED TO PPCA OXIDATION ... 26
3. Orientation of the axial ligands and magnetic properties of the hemes in the cytochrome c7 family ... 27
3.1RESULTS ... 30
3.1.1RESONANCE ASSIGNMENT... 31
3.1.2AXIAL LIGAND GEOMETRY ... 32
3.2DISCUSSION ... 34
3.3CONCLUSIONS ... 36
4. Study of the conserved residue Phe15 in the cytochrome c7 family ... 37
4.1RESULTS ... 40
4.1.1PURIFICATION OF 15N-LABELLED AND UNLABELLED PPCAF15L MUTANT ... 40
4.1.2SEQUENTIAL ASSIGNMENT, RESTRAINTS AND STRUCTURE CALCULATION OF PPCAF15L ... 42
4.1.3QUALITY ANALYSIS OF THE STRUCTURES ... 45
xii
4.2DISCUSSION ... 49
4.2.1COMPARISON OF PPCAF15L AND PPCA SOLUTION STRUCTURES ... 50
4.2.2HEME REDUCTION POTENTIALS AND REDOX INTERACTIONS ... 52
4.2.3STRUCTURAL MAPPING OF THE REDOX-BOHR CENTER ... 55
4.3CONCLUSIONS ... 58
5. Mapping the interaction sites of PpcA ... 59
5.1RESULTS ... 62
5.1.1PURIFICATION OF 15N-LABELLED AND UNLABELLED PPCA... 62
5.1.2UV-VISIBLE STUDIES ... 63
5.1.3PPCA-AQDS INTERACTION PROBED BY NMR ... 65
5.2DISCUSSION ... 71
5.3.CONCLUSIONS ... 74
6. Final conclusions ... 75
7. References ... 79
8. Appendix ... 85
A. SUPPLEMENTARY FIGURES ... 87
List of figures 2012
xiii
LIST OF FIGURES
Figure 1 - Proposed model depicting the extracellular electron transfer pathway to Fe(III) oxides in
Geobacter sulfurreducens. ... 5
Figure 2 - Alignment of cytochromes c7 amino acid sequences.. ... 6
Figure 3 - Crystal structures of the five c7 cytochromes from G. sulfurreducens and D. acetoxidans. ... 7
Figure 4 – Spectroscopic properties of c-type heme proteins and electronic properties of iron present in theseproteins. ... 8
Figure 5 - Comparison of PpcA lowest energy solution structure with PpcA crystal structure ... 9
Figure 6 – Electronic distribution scheme and 1D-1H NMR spectra of reduced and oxidized triheme cytochrome. ... 10
Figure 7 - Preferential pathway for electron transfer in PpcA at pH 7.5. ... 11
Figure 8 - Thermodynamic and mechanistic bases for energy transduction by PpcA... 12
Figure 9 - Diagram of heme c numbered according to the IUPAC-IUB nomenclature ... 23
Figure 10 - Diagram of heme c showing the geometric parameters and . ... 25
Figure 11 - 1D-1H NMR spectra obtained for PpcA–E in the oxidized state ... 30
Figure 12 - Orientation of the heme axial ligands, and experimental and calculated shifts of PpcB–E heme -substituents ... 32
Figure 13 – Purification of 15N-labelled PpcAF15L ... 40
Figure 14 - Sequential NOE connectivities involving NH, H and H observed in the 2D-1H-NOESY spectrum for reduced PpcAF15L. ... 42
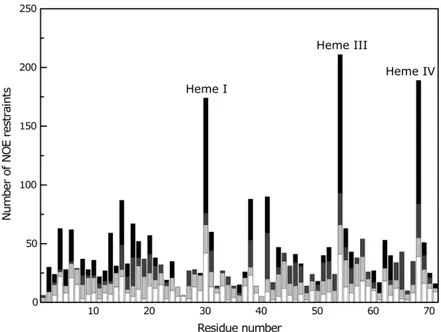
Figure 15 - Number of NOE restraints per residue used for the calculation of the structure of PpcAF15L. ... 44
Figure 16 - PpcAF15L solution structure. ... 45
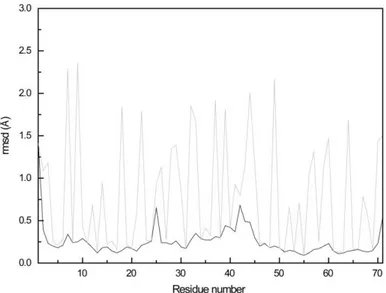
Figure 17 - Average pairwise backbone and heavy atom rmsd values per residue of the family of 20 conformers obtained for PpcAF15L solution structure. ... 46
Figure 18 - Ramachandran plot for the ensemble of the best 20 conformers obtained for PpcAF15L solution structure. ... 46
Figure 19 - Comparison of pH-linked conformational changes in PpcAF15L and PpcA ... 48
Figure 20 – Comparison of the observed heme proton chemical shifts of reduced PpcAF15L and those of PpcA at pH 7.1 and 16ºC ... 49
Figure 21 - 2D-1H-15N HSQC NMR spectra of fully reduced PpcAF15L and PpcA ... 50
xiv
Figure 23 - Orientation of the axial histidines in each heme group for PpcAF15L and PpcA solution structures... 53
Figure 24 - Comparison of PpcAF15L and PpcA lowest energy solution structures... 54
Figure 25 - Spatial disposition of residues Gln21 and His17 in PpcAF15L and PpcA solution structures. ... 56
Figure 26 - Structural map of residues involved in the pH-dependent conformational changes in vicinity of redox-Bohr center P13IV in PpcAF15L and PpcA solution structures. ... 57
Figure 27 – Purification of 15N-labelled PpcA ... 62
Figure 28 - UV-visible absorption spectra of sodium dithionite, PpcA and AQDS at pH 7.1.. ... 63
Figure 29 - Assays of AH2QDS oxidation coupled to PpcA reduction at pH 7.1 ... 64
Figure 30 - Assays of AQDS reduction coupled to PpcA oxidation at pH 7.1. ... 65
Figure 31 - 1H-15N HSQC spectra of 15N-labeled PpcA in the presence of AQDS, in the oxidized form ... 66
Figure 33 - Titration curves of chemical shift changes in 1H-15N HSQC spectra observed for representative residues of PpcA in the reduced and oxidized form, as a function of molar ratio [AQDS]/[PpcA]. ... 68
Figure 34 - 1H chemical shift changes of the PpcA heme groups in the reduced and oxidized form.. ... 69
Figure 35 – 1D-1H NMR spectra of AQDS, PpcA and PpcA in the presence of AQDS in the oxidized form. .... 69
Figure 36 – 2D-1H-NOESY spectra of unlabeled PpcA in the presence and absence of AQDS in the reduced form. ... 70
Figure 37 - 1D-1H NMR spectra of low field region of PpcA in the presence of AQDS, PpcA before and after removal of the ligand by ultrafiltration... 71
Figure 38 – PpcA region containing the most affected residues and heme substituents in the presence of ADQS in the reduced and oxidized forms.. ... 72
Figure A1 - Purification of unlabelled PpcAF15L………87
Figure A2 - Purification of unlabelled PpcA………88
List of tables 2012
xv
LIST OF TABLES
Table 1 – Respiratory versatility of representative Geobacter species ... 3
Table 2 - Heme reduction potentials and pairwise interactions of the fully reduced and protonated forms of PpcA, PpcB, PpcD and PpcE. ... 11
Table 3 – 2D NMR standard experiments used in this work. ... 17
Table 4 - Comparison between the molecular orbital parameters obtained by fitting the 13C signals of the
heme -substituents and the geometry of the axial ligands reported in the X-ray structure. ... 33 Table 5 - Summary of restraint violations and quality analysis for the final family of solution structures for PpcAF15L ... 43
Table 6 - Heme geometry for PpcAF15L and PpcA cytochromes in solution. ... 52
Table 7 - Heme reduction potentials and pairwise interactions of the fully reduced and protonated forms of PpcAF15L and PpcA. ... 52
Table B1 - Chemical shifts of the heme protons of PpcAF15L in the reduced state at pH 8 and 16ºC...90
Table B2 - Chemical shifts of the heme protons of PpcA in the reduced state at pH 8 and 16ºC...91
Table B3 - Structural assignment of the 1H and 13C resonances to the PpcB-E heme -substituents in the
oxidized form, at 16 and 25 ºC, pH 7.1...93
Table B4 - Chemical shifts of the heme protons of PpcA in the absence and presence of AQDS in the reduced state at pH 7.1 and 25ºC...95
List of abbreviations and symbols 2012
xvii
LIST OF ABBREVIATIONS AND SYMBOLS
1D One dimensional
2D Two dimensional
2xYT 2x yeast extract–tryptone medium
AH2QDS 9,10-Anthrahydroquinone-2,6-disulfonate ATP Adenosine triphosphate
AMP Ampicillin
AQDS 9,10-Anthraquinone-2,6-disulfonate BLAST Basic local alignment search tool
BMRB Biological magnetic resonance data bank
CLO Chloramphenicol
COSY Correlation spectroscopy
Dac7 Desulfuromonas acetoxidansc7 cytochrome DNA Deoxyribonucleic acid
EDTA Ethylenediamine tetra-acetic acid FID Free induction decay
Gs Geobacter sulfurreducens
HSQC Heteronuclear single-quantum coherence IPTG Isopropyl -D-1-thiogalactopyranoside
IUPAC-IUB International Union of Pure and Applied Chemistry and International Union of Biochemistry
KD Equilibrium dissociation constant
lov Lower limit volume
MacA Metal reduction associated cytochrome A MFC Microbial fuel cells
NCBI National center for biotechnology information
MW Molecular weight
NMR Nuclear magnetic resonance spectroscopy NOE Nuclear Overhauser effect
NOESY Nuclear Overhauser effect spectroscopy OD600 Optical density at 600 nm
OmcB Outer membrane associated cytochrome B OmcE Outer membrane associated cytochrome E OmcS Outer membrane associated cytochrome S
PDB Protein data bank
PgcA Periplasmic GEMM-regulated cytochrome A
pI Isoelectric point
PpcA Gsc7 cytochrome (GSU0612)
PpcB Gsc7 cytochrome (GSU0364) PpcC Gs c7 cytochrome (GSU0365) PpcD Gs c7 cytochrome (GSU1024) PpcE Gs c7 cytochrome (GSU1760) ppm Parts per million
xviii
rpm Rotations per minuteS Spin angular momentum
SDS-PAGE Sodium dodecyl sulfate polyacrylamide gel electrophoresis TCI Triple-resonance cryoprobe
Tris Tris(hydroxymethyl)aminomethane TOCSY Total correlation spectroscopy
upv Upper limit volume
UV-visible Ultraviolet-visible
δ Chemical shift
Extinction absorption coefficient at 552 nm
Amino acid abbreviations
Alanine Ala A
Arginine Arg R
Asparagine Asn N
Aspartate Asp D
Cysteine Cys C
Glutamate Glu E
Glutamine Gln Q
Glycine Gly G
Histidine His H
Isoleucine Ile I
Leucine Leu L
Lysine Lys K
Methionine Met M
Phenylalanine Phe F
Proline Pro P
Serine Ser S
Threonine Thr T
Tryptophan Trp W
Tyrosine Tyr Y
Introduction 2012
Introduction 2012
3
1. INTRODUCTION
The electron transfer process is fundamental in biological systems. Indeed, every cell must solve the problem of energy production in order to survive. The mechanistic studies of electron transfer processes are of great importance to understand the cellular metabolism of living organisms.
An impressive respiratory versatility was identified in some bacteria from the class of -proteobacteria, which includes the well characterized Geobactereacea family. Members of the
Geobactereacea are generally the predominant Fe(III)-reducing microorganisms in soils and
sediments in which Fe(III) reduction is an important process. However, their respiratory skills are not confined to iron reduction since they can utilize a large diversity of electron donors and acceptors (Table 1) making them important agents in several biogeochemical cycles in natural environments [1].
Table 1 – Respiratory versatility of representative Geobacter species. Adapted from [1].
Name Source Electron donors oxidized with Fe(III) a
Fe forms reduced b
Other electron acceptors a, c
Geobacter metallireducens
Aquatic
sediments Ac, Bz, Bze, BtOH, Buty, Bzo, BzOH, Cr, EtOH, p-HBz, p-HBzOH, IsoB, IsoV, Ph, Prop, PrOH, Pyr, Tol, Val
PCIO, Fe(III)-Cit Mn(IV), Tc(VII), U(VI), AQDS, humics, nitrate
Geobacter sulfurreducens
Contaminated
ditch Ac, H2 PCIO, Fe(III)-Cit, Fe(III)-P Tc(VII), Co(III), U(VI), AQDS, Sº,
Fum, Mal, O2
Geobacter bemidjiensis Fe(III)-reducing subsurface sediment
Ac, Bzo, BtOH, Buty, EtOH, Fum, H2, IsoB, Lac, Mal,
Prop, Pyr, Succ, Val
Fe(III)-Cit,Fe(III)-NTA, Fe(III)-P, PCIO
AQDS, Fum, Mal, Mn(IV)
Geobacter lovleyi
Freshwater
sediment Ac, Bze, Bzo, Buty, Cit, EtOH, For, Glu, Lac, MeOH, Prop, Succ, Tol, YE
Fe(III)-Cit, PCIO PCE, TCE, nitrate, Fum, Mal, Sº,
U(VI), Mn(IV) Geobacter uraniireducens Uranium-contaminated subsurface sediment
Ac, EtOH, Lac, Pyr Fe(III)-NTA,
Fe(III)-P, PCIO, smectite
AQDS, Fum, Mal, Mn(IV), U(VI)
a Abbreviations for electron donors and acceptors: acetate (Ac), 9,10-anthraquinone-2,6-disulfonate (AQDS), benzaldehyde
(Bz), benzene (Bze), benzoate(Bzo), benzylalcohol (BzOH), butanol (BtOH), butyrate(Buty), citrate (Cit), p-cresol (p-Cr), elemental sulfur (Sº), ethanol (EtOH), formate (For), fumarate (Fum), glucose (Glu), hydroxybenzaldehyde (HBz), p-hydroxybenzylalcohol (p-HBzOH), hydrogen (H2), isobutyrate (IsoB), isovalerate (IsoV), lactate(Lac), malate (Mal), methanol (MeOH), manganese oxide (Mn(IV)), phenol (Ph), propanol (PrOH), propionate (Prop), pyruvate (Pyr), succinate (Succ), tetrachloroethylene (PCE), trichloroethylene (TCE), toluene (Tol), trichloroacetic acid (TCA), valerate (Val), xylose (Xyl), yeast extract (YE).
b Fe(III) forms: Poorly crystalline iron oxide (PCIO), ferric citrate (Fe(III)-cit), ferric nitrilotriacetic acid (Fe(III)-NTA), ferric
pyrophosphate (Fe(III)-P)
c Organism has the ability to reduce the metal but not determined whether energy to support growth is conserved from
4
These bacteria are highly effective in completely oxidizing organic compounds to carbon dioxide under anaerobic conditions with electron transfer to metals [2] or onto graphite electrodes, from which electricity can be harvested [3]. The extracellular electron transfer capability presented by Geobacter bacteria has several practical applications in thebioremediation of radioactive and toxic metals in contaminated subsurface environments and also in bioenergy generation, converting organic compounds to electricity in microbial fuel cells (MFC) [4]. However, at present, the power output of MFC is too low for most envisioned applications. The understanding of the respiratory chain is expected to provide valuable information to improve the current-production by these bacteria [5].
1.1MODEL FOR EXTRACELLULAR ELECTRON TRANSFER IN THE BACTERIUM G. SULFURREDUCENS
The Gram-negative bacterium Geobacter sulfurreducens (Gs) is a well-studied member of the
Geobacter genus, currently used as a model, because is easily cultured, its whole genome is
sequenced and can be genetically manipulated for physiological studies [6, 7]. The genome of
Gs encodes for 111 c-type cytochromes [8], most of them holding more than one c-type heme
group and mostly located in the periplasm or in the outer membrane. The abundance of multiheme cytochromes suggests that the electron transport pathways in these bacteria are extremely versatile, allowing a precise and adequate physiological response to the diverse metal ions it can find in the natural environments. Gene knockout and proteomic studies on Gs cells
had contributed to elucidate the participation of some proteins in its electron transport chain. These studies indicated that several c-type cytochromes were produced to a much greater
extent when Fe(III) served as the electron acceptor, which allowed the evaluation of the role of these cytochromes in electron transport to extracellular Fe(III). These include different proteins; namely MacA, which is thought to be associated with the periplasmic surface of the inner membrane [9], PpcA [10] and related periplasmic low molecular-weight cytochromes, and outer membrane c-type cytochromes (OmcB, OmcS, OmcE) [11, 12].
Since Gs requires direct contact for reduction of insoluble Fe(III) oxides [13], it is not
surprising that some of the most important proteins are located on the outer surface of the Gs
cells. OmcB (outer membrane associated cytochrome B) is a 89kDa protein holding 12 hemes [14]. This protein is capable of reducing Fe(III) oxide and chelated Fe(III). Deleting the gene for OmcB inhibited reduction of Fe(III) citrate and Fe(III) oxide [12]. OmcE is another c-type
cytochrome found on the outer cell surface, but its specific location has yet to be pinpointed. This protein has not beenpurified yet, but is predicted to have a molecular weight of 32kDa and four heme groups [11].
OmcS is a six-heme c-type cytochrome with a molecular weight of 47kDa [15], specifically
associated with the pili of Gs [16] and is required for growth on Fe(III) oxide, but not Fe(III)
citrate [11]. Other cytochromes of interest are MacA (metal reduction associated cytochrome A) and PgcA (periplasmic GEMM-regulated cytochrome A). MacA is a 35kDa diheme c-type
Introduction 2012
5
cytochrome has been studied by X-ray in three relevant redox states (reduced, semi-reduced and oxidized) [17]. PgcA is a triheme cytochrome located in the periplasm, but still less studied. This protein is more abundant in cells grown on insoluble Fe(III) oxide than soluble Fe(III) citrate [18]. Combining all this information, a model for the electron transfer to the extracellular acceptor Fe(III) in G. sulfurreducens was proposed (Figure 1).Figure 1 - Proposed model depicting the extracellular electron transfer pathway to Fe(III) oxides in Geobacter sulfurreducens. The white path represents the proposed electron transfer pathway. The
membrane associated cytochrome MacA receives electrons from the menaquinol (MQH2)/menaquinone (MQ)
pool at the inner membrane and reduces the periplasmic triheme cytochromes (PpcA-E). These cytochromes mediate the electron transfer from the periplasm to the outer membrane associated cytochromes (OmcB, OmcE and OmcS) that are likely to be directly involved in the reduction of insoluble Fe(III) oxides. OmcS was shown to be localized along the pili when Gs grows in Fe(III) oxides.
1.2 STRUCTURAL FEATURES OF PERIPLASMIC TRIHEME CYTOCHROMES OF G. SULFURREDUCENS
A family composed by five low molecular weight (~10kDa) cytochromes c7, designated by PpcA, PpcB, PpcC, PpcD, and PpcE was identified in the periplasm of G. sulfurreducens. It is
F o llo w th e r e d r o a d o f tr ih em e cy to ch ro me s in G eo b a ct e r su lfu rr ed u c en s 2 0 1 2
6
10PpcA A D D I V L K A K NGD VKF P H KA H Q K A V P D . C K KC HE . K G P G K I E G F G KE MA HG K G CK G C HE E M K K . . . G P T K . CG E C HK K
PpcB 77% A D T M T F T A K NGN VT F D H KK H Q T I V P D . C A VC HG . K T P G K I E G F G KE MA HG K S CK G C HE E M K K . . . G P T K . CG E C HK K PpcC 62% I D K I T Y P T R I GA VVF P H KK H Q D A L G E . C R GC HE . K G P G R I D G F D KV MA HG K G CK G C HE E M K I . . . G P V R . CG D C HK G G PpcD 57% H D K V V V L E A K NGN VT F D H KK H A G V K G E . C K AC HE T E A G G K I A G M G KD WA H . K T CT G C HK E M G K . . . G P T K . CG E C HK K PpcE 65% A D V I L F P S K NGA VT F T H KR H S E F V R E . C R SC HE . K T P G K I R N F G KD Y A H . K T CK G C HE V R G A . . . G P T K . CK L C HT G Dac7 46% A D V V T Y E N K KGN VT F D H KA H A E K L G . . C D AC HE . G T P A K I . A I DKK S A H K D ACK T C HK S N N . . . . G P T K . CG G C H I K
Gmet0335 62% A D V F E F P A S MGK VT F P H KMH Q E M L K D . C K KC HE . N G P G K I K D F G KD WA H . K T CK G C HT E L K K . . . G P V G . CT DC HK K Gmet1846 54% A D T M I F P A K NGN I T F N H KH H T D L L K E . C K NC HD . K T P G R I A N F G KD Y A H . K T CK G C HE V R G T . . . G P T R . CG L C HR K Gmet2902 81% A D E L T F K A K NGD VKF P H KK H Q Q V V G N . C K KC HE . K G P G K I E G F G KD WA H . K T CK G C HE E M K K . . . G P T K . CG D C HK K Gmet3165 59% I E T I T F P N R I GQVSF P H KK H Q D A L G Q . C R GC HE . K G P G E I D G F D KV L A HG K G CK G C HE A M K R . . . G P V L . CK G C HG G Gmet3166 68% A D T L T F P A K NGN VSF GH KK H Q Q V A G S . C K AC HE . K A P G K I E G F G KD WA H . K T CK G C HE Q K K A . . . G P T K . CG E C HK K Gura1303 43% A Y V F K A Y NGD VT F N H I E H R R N F T . . CG DC HN . G P P R F I E L D H D S . A H . K L CL G C HK K L G A . . . G P L R HCG D C HK Q S Gura3843 74% A D T I T L P A K NGN VT F N H KK H Q E A L K D . C K AC HE . K A P G K I E G F G KD AA H . K L CK G C HE T K K A . . . G P T K . CG E C HK K Gura4121 77% A D T I T L P A K NGN VT F N H KMH Q D T L K D . C K I C HE . K G P G K I E G F G KE L A H . K T CK G C HE E K K A . . . G P T K . CG E C HK K Gura4124 62% A D T V V L K A K NGN VT F D H KK H S A T G D . . C K SC HG . E G T P A K L T L G KD AA H . K L CK G C HE T K K A . . . G P T K . CG E C HK K H Gbem3455 59% A D S V V Y P A K NGN VT F N H KA H Q G K N E . . C K VC HG D G A P A K I A I N KD AA HG K ACK E C HA A K G . . . . G P T K . CG D C HK K Gbem4043 60% A D D A D V V L P A K NGN VT F P H KK H Q D M K E L KC T DC HE T D K G G K I A N L G KE WA H . K T CK G C HT D K G K . . . G P T K . CT E C HK K Gbem4049 72% A D V I T L P A K NGD VT F N H KK H Q D T L K D . C K AC HE K G P G K I E G F G KD F A H . K T CK G C HS D K G A . . . G P T K . CG E C HK K Glov0209 64% A D V I E L P A S MGK VMF P H KK H Q E M L K D . C K KC HE K G P G K . I K E L G KD WA H . K T CK G C HT E G F N G K KG P T A . CK DC HK K Glov2758 56% A D S Y E Y K G G A MGK VAF P H KA H M K L G . . . C A KC HE G A P K K . I E M N KD V A H N K L CV KC HK A E K K . . . G PQ G . CK DC HK K Ppro3509 56% S D V I E F P S S I GK VT F T H KA H Q E L L K D . CQ KC HA S P A G G T I A G F D KD WA H . K T CK G C HV E M K K . . . G P V S . CK E C HK K Adeh1696 56% A E P P A T L T L Q A K PGN VT F P H KA H A D K L G K . C E TC HA T A A G G K I E G F G KD KA H . G L C I EC HK K E A K . . . G P T K . CA E C HK K A Adeh1697 61% A A P A A P T V L K A K NGD VT F N H KT H A A V K . . . C E TC HA T A A G G K I E G F G KE KA H . A T C I EC HK K E A K . . . G P A K . CA E C HK K A
I III I IV III IV
70
20 30 40 50 60
Figure 2 - Alignment of cytochromes c7 amino acid sequences. PpcA-E, Geobacter sulfurreducens; Dac7, Desulfuromonas acetoxidans; Gmet, Geobacter
metallireducens; Gura, Geobacter uraniireducens; Gbem, Geobacter bemidjiensis; Glov, Geobacter lovleyi; Ppro, Pelobacter propionicus; Adeh, Aneromyxobacter
dehalogenans. The numbers refer to the gene that encodes for each cytochrome. The conserved residues in the proteins are boxed: heme attached (gray) and
non-heme attached residues (black). The specific non-heme and the respective attached residues are indicated on the bottom of the last cytochrome c7 amino acid sequence.
Introduction 2012
7
Using the PpcA amino acid sequence, we searched the non-redundant amino acid database of NCBI using the Basic Local Alignment Search Tool (BLAST) [20] and in addition to these five cytochromes c7 mentioned above, 18 additional cytochromes c7 were found: five fromGeobacter metallireducens, four from Geobacter uraniireducens, three from Geobacter
bemidjiensis, two from Anaeromyxobacter dehalogenans and Geobacter lovleyi, and one from
Desulfuromonas acetoxidans strain 5071 and Pelobacter propionicus. All of these bacteria from
the -proteobacteria class have the ability to use Fe(III) as a terminal electron acceptor [21, 22].
All of these proteins contain three c-type heme groups covalently linked to the polypeptide
chain by two cysteine residues of the conserved CXXCH binding motif (where X corresponds to any amino acid). A sequence alignment of these proteins is depicted in Figure 2 and shows that of the 21 highly conserved residues, only nine are not cysteine or histidine residues directly involved in heme binding.
Amongst these 23 cytochromes c7, the best studied one are the family of five periplasmic proteins from G. sulfurreducens (PpcA-E) and the triheme cytochrome from D. acetoxidans
(Dac7) [23]. The crystal structures of these cytochromes have been determined and are indicated in Figure 3.
Figure 3 - Crystal structures of the five c7 cytochromes from G. sulfurreducens and D.
acetoxidans. PpcA is represented in gray with the deoxycholate acid molecule used for crystallization in
black (PDB 1OS6 [19]), PpcB in green (PDB 3BXU [24]), PpcC in blue (PDB 3H33), PpcD in orange (PDB 3H4N), PpcE in cyan (PDB 3H34) [25] and Dac7 in magenta (PDB 1HH5) [23]. PpcB and PpcD displayed two
molecules in the crystal asymmetric unit (monomers A and B) and monomer A is represented. The molecules are all in the same orientation.
8
lowest similarity is found near heme I [25]. The heme core structures of the cytochromes c7 aresimilar, with hemes I and III roughly parallel to each other and both nearly perpendicular to heme IV [19, 24, 25]. The spatial arrangement of the hemes in cytochromes c7 is superimposable with those of the structurally homologous tetraheme cytochromes c3, with the sole difference being the absence of heme II and the corresponding polypeptide segment. For this reason, the three heme groups in cytochromes c7 have been numbered as I, III and IV. In these cytochromes all hemes are axially coordinated by two histidine residues and are low-spin, both in the diamagnetic reduced (Fe(II), S=0) and in the paramagnetic oxidized (Fe(III), S=½) forms. Typical spectral signatures are observed in this case, where c-type cytochromes hold all
hemes in the low spin state. To illustrate these features, the UV-visible spectrum obtained for PpcA is indicated in Figure 4.
Figure 4 – Spectroscopic properties of c-type heme proteins and electronic properties of iron present in these proteins. A) Typical UV-visible absorption spectra for a c-type heme protein. The
oxidized form (solid line) is dominated by a band with a maximum at 406nm (Soret band), whereas for the reduced form (dashed line), three bands are observed at 417nm (Soret band), 522nm (β band) and 552nm ( band) [26]. The inset displays a c-type heme axially coordinated by two histidine residues. B) Spin-states
of octahedral Fe(III) and Fe(II) at low spin state, where the crystal field, o, is higher than the energy
required to pair electrons in the same orbital, P (o>P).
Introduction 2012
9
Figure 5 - Comparison of PpcA lowest energy solution structure (PDB 2LDO) [27] with PpcA crystal structure (PDB 1OS6) [19]. Structures were superimposed in MOLMOL using backbone atoms.
PpcA solution structure is colored light gray, and PpcA crystal structure is green. The deoxycholate molecule used in the crystallization is represented in black.
1.3 FUNCTIONAL FEATURES OF PERIPLASMIC TRIHEME CYTOCHROMES FROM GS
Despite the structural similarity presented by this family of cytochromes c7, gene knockout studies of Gs cells suggested that these proteins may have functional specificities, since the
Fe(III) reduction was differently affected [28]. The characterization of the redox properties of multiheme cytochromes is complex due to the co-existence of several heme groups. Indeed, in monoheme cytochromes only the fully reduced and oxidized states may coexist in solution, whereas in multiheme cytochromes several one-electron reversible transfer steps convert the fully reduced state in the fully oxidized state (Figure 6A). Consequently, different redox stages are defined, each grouping microstates with the same number of oxidized hemes.
10
these thermodynamic parameters, it is necessary to monitor the stepwise oxidation of each heme oxidation at several pH values. To date, NMR is the only technique that allows probing the individual heme oxidation profiles due to the spectral signatures of the NMR spectra of low-spin multiheme in the reduced and oxidized states (Figure 6B).Figure 6 – Electronic distribution scheme and 1D-1
H NMR spectra of reduced and oxidized triheme cytochrome. A) Electronic distribution scheme for a triheme cytochrome with a proton-linked
equilibrium, showing the 16 possible microstates. The three inner circles represent the hemes, which can be reduced (dark blue) or oxidized (white). The outer circles with solid and dashed lines represent the protonated and deprotonated microstates, respectively. The microstates are grouped according to the number of oxidized hemes in four oxidation stages (S0–3) connected by one electron step. P0H and P0
represent the reduced protonated and deprotonated microstates, respectively. PijkH and Pijk indicate the
protonated and deprotonated microstates, respectively, where i, j and k represent the heme(s) that are oxidized in that particular microstate. B) 1D-1H NMR spectra of reduced and oxidized triheme cytochrome
PpcA obtained at 25 ºC.
In conditions of fast intramolecular electron exchange (between the different microstates within the same oxidation stage) and slow intermolecular electron exchange (between different oxidation stages) on the NMR time scale [24], the heme oxidation fraction can be determined from the chemical shifts of the heme substituents in the different oxidation stages. Heme methyl resonances are the easiest identifiable NMR signals of all heme substituents and their largest paramagnetic shifts make them ideal candidates for following the setpwise oxidation of the heme throughout a redox titration. The paramagnetic shifts of the heme methyls are proportional to the oxidation fraction of a particular heme and as a result, contain information about the redox properties of each heme group [30]. However, the NMR data per se are
insufficient to determine the absolute thermodynamic parameters and need to be complemented with data from redox titrations monitored by visible spectroscopy [29]. Once determined the thermodynamic parameters it is possible to evaluate the contribution of each microstate and their relevance to the electron transfer mechanism. The thermodynamic
e- e- e
-P134 P0H P0 P4H P3H P1H P4 P3 P1 P34H P14H P13H P134H
S0 S1 S2 S3
Reduced protein (S0)
Oxidized protein (S3)
A B
P34
P14
Introduction 2012
11
parameters of PpcA, PpcB, PpcD, and PpcE were determined [30] and are summarized in Table 2.Table 2 - Heme reduction potentials and pairwise interactions (mV) of the fully reduced and protonated forms of PpcA, PpcB, PpcD and PpcE [30].
Heme redox potentials Redox interactions Redox-Bohr interactions
I III IV I-III I-IV III-IV I-H III-H IV-H
PpcA -154 -138 -125 27 16 41 -32 -31 -58
PpcB -150 -166 -125 17 8 32 -16 -9 -38
PpcD -156 -139 -149 46 3 14 -28 -23 -53
PpcE -167 -175 -116 27 5 22 -12 2 -13
The heme reduction potentials of PpcA, PpcB, PpcD and PpcE are negative, differ from each other, and cover different functional ranges. These reduction potentials are strongly modulated by heme-heme interactions and by interactions with protonated groups (the redox-Bohr effect), yielding different cooperative networks for each protein. In particular, PpcA displays the necessary properties to couple e-/H+ transfer (Figure 7).
Figure 7 - Preferential pathway for electron transfer in PpcA at pH 7.5. The dominant microstates
are highlighted in blue and the preferential electron transfer pathway is indicated by the orange arrows. An e-/H+ coupling is observed between oxidation stages 1 and 2.
e- e- e
-P134 P0H P0 P4H P3H P1H P4 P3 P1 P34H P14H P13H P134H
S0 S1 S2 S3
P13
P14
12
In the case of PpcA the thermodynamic studies showed that the protein not only transfers electrons but can also couple the transference of proton(s), in a process designated by redox-Bohr effect [30, 31]. As depicted in Figure 7, stage 0 is dominated by the protonated form P0H and stage 1 is dominated by the oxidation of heme I (P1H) while keeping the acid-base center protonated. Stage 2 is dominated by the oxidation of heme IV and deprotonation of the acid-base center (P14), which remains deprotonated in stage 3 (P134). Therefore, a route is defined for the electrons: P0H → P1H → P14 → P134 [30]. Considering the thermodynamic properties and the periplasmic location of this protein in Gs, it was proposed that PpcA might contribute to thetransmembrane pH gradient that drives ATP synthesis [32, 33]. Under such hypothesis, PpcA can receive weakly acidic protons (pKa > 8.0) and electrons from donor(s), which will then be
released in the more-acidic periplasmic space with a lower pKa (<7.5) upon electron transfer to
the acceptor according to the scheme represented in Figure 8 [30].
Figure 8 - Thermodynamic and mechanistic bases for energy transduction by PpcA (adapted from [30]). The functional pathway involving the significantly populated microscopic redox states is indicated by
arrows. The microstates are labeled as in Figure 7. The redox potential for the equilibrium involving the protonated microstates P1Hand P14H(-109 mV) is obtained by the sum of the heme IV redox potential in the
fully reduced and protonated protein (-125 mV) and I-IV redox interaction (16 mV).
Given the importance of periplasmic triheme cytochromes in Gs, and in particular PpcA, this
Thesis focused on the elucidation of structural and functional characteristics of these proteins. The main technique used in this work was NMR spectroscopy, whose basic principles are revisited in chapter two, together with the description of expression, purification and preparation of the protein samples and also, with a brief description of NMR solution structure calculation methods. Chapter three describes the determination of the orientations of the heme axial histidines ring planes and the orientation of the heme magnetic axis for each Gs triheme
cytochrome. Chapter four reports the determination of the solution structure and the pH-dependent conformational changes of a PpcA mutant. Finally, Chapter five describes the use of
1H and 15N backbone and side chain signals of PpcA to map interactions between this protein
Experimental procedures 2012
Experimental procedures 2012
15
2. EXPERIMENTAL PROCEDURES
2.1 BASIC PRINCIPLES OF NMR
Nuclear magnetic resonance spectroscopy (NMR) studies the properties of molecules containing magnetic nuclei by applying a magnetic field and observing the frequencies of the resonant electromagnetic field. Indeed, in the presence of a magnetic field, a sample can absorb electromagnetic radiation in the radio frequency region at frequencies governed by the characteristics of the sample.
Nuclei are characterized by a quantum spin number (I), which can be determined from the atomic mass and the atomic number. When I=0, there is no nuclear spin and it is NMR silent. Spectra of several nuclei can be readily obtained (e.g., 1H, 3H, 13C, 15N, 19F) since they have
spin numbers I of ½ and a uniform spherical charge distribution. Of these by far, the most widely observed in NMR spectroscopy are 1H and 13C. Nuclei with a spin number I =1 or higher have a non-spherical charge distribution. This asymmetry is described by an electrical quadrupole moment, which affects the relaxation time and, consequently, the linewidth of the signals and coupling with neighbouring nuclei. The value of the quantum spin number determines the number of orientations that a nucleus may assume in presence of an external uniform magnetic field in accordance with the formula 2I+1.
For a nuclei with I=½, the energy difference (ΔE) between the energy states (mI=+½) and (mI=-½) gives rise to the frequency of the spectra, whereas intensities of the signals are proportional to the population difference of the two and states. The ratio of the populations in the states is quantitatively described by the Boltzmann equation (Equation 1):
(1)
where N, represents the number of nuclei in each possible spin orientation, kB the Boltzmann constant and T the temperature. It follows that decreasing the temperature, increases the intensity by increasing the population differences. NMR transitions can be enhanced significantly by increasing the strength of the applied magnetic field, since it is proportional to the signals intensity.
In presence of an external magnetic field, nuclei have an intrinsic frequency, which is known as the Larmor frequency. For instance, in a molecule, all protons have the same Larmor frequency. However, the signals of interest are those precessing at frequencies slightly different from the Larmor frequency, an effect caused by the electron density surrounding each individual proton.
16
question and that of a reference standard (νref) (Equation 2). By convention, NMR spectra areplotted with increasing from right to left and is expressed in ppm (parts per million).
(2)
The approach to any structural or mechanistic problem will invariably start with the acquisition of one dimensional (1D) spectra, since these provide the foundations for further work. In a 1D experiment, the FID (free induction decay) is acquired after a radio frequency pulse or pulses (called the preparation period). A plot of the frequencies of the absorption peaks versus peak
intensities constitutes the 1D-NMR spectrum. For small molecules, a 1D spectrum contains valuable information and can be acquired in a few seconds. On contrary, for a macromolecule the 1D spectrum becomes more complex. For example, for a 1D 1H spectrum of a protein the side-chain region is very crowded with severe spectral overlap due to the large number of backbone and side-chain protons and, concomitantly the spectral assignment is extremely complex. To improve the resolution for spectral assignment, a second frequency dimension is introduced to disperse the signals over two frequency dimensions, forming a two-dimensional (2D) NMR spectrum.
In a 2D experiment, one additional period called the evolution time, which contains a variable time delay t1, is introduced into the experiment between the preparation and acquisition periods. The evolution delay increases systematically by the same amount of time for each increment during a 2D experiment from zero to the final value determined by the number of increments.
After the experiment is done, all the FIDs are transformed with the same phase parameters. Fourier transformation of the second FID obtained by the t1 evolution time generates another frequency domain as the transformation of the acquired FIDs. The result of the two Fourier transformations is a two-dimensional NMR spectrum with two frequency axes and an intensity axis on the third dimension that is usually plotted as contours.
Experimental procedures 2012
17
Table 3 – 2D NMR standard experiments used in this work. The H and X represent a proton and an heteroatom, respectively. Adapted from [34, 35].
NMR
technique Comment Correlation Pulse sequence
a
1H-1H-COSY Proton J-coupling typically over two
or three bonds
1H-1H-TOCSY
Relayed proton J-couplings within a coupled spin system
1H-1H-NOESY Through-space
correlations 1H-X-HSQC One-bond heteronuclear coupling with proton observation
a Black and white rectangles represent 90º and 180º radio frequency pulses, respectively. The gray triangle
represent the data acquisition period. t1 and m represent a time delay period and a mixing time period,
respectively. A DIPSI-2 pulse train is applied with low power during the spin lock period.
1H-1H COSY (correlation spectroscopy) and 1H-1H TOCSY (total correlation spectroscopy)
experiments use scalar coupling (through bond nuclear interactions) to correlate the spins within a spin system. These types of experiments provide geometric information about the molecules via three-bond J coupling in addition to the correlation used in resonance assignment. In the case of the 1H-1H COSY experiment is typically used to correlate protons coupled over two or three bonds. Further information can be achieved using the 1H-1H TOCSY experiment since it correlates the coupled homonuclear spins and those that reside within the same spin system but which may not share mutual couplings. Thus, employs the propagation of magnetization along a continuous chain of spins.
In the 1H-1H-NOESY (nuclear Overhauser effect spectroscopy) experiment the magnetization is exchanged between all protons using the NOE (nuclear Overhauser effect), establishing spatial proximity between protons. The NOE is defined as the change in intensity of one NMR resonance that occurs when another is saturated. It results from dipole–dipole cross-relaxation between nuclei, and its usefulness arises because the strength of a given NOE enhancement is approximately correlated with inter-nuclear separation (actually r−6, where r is the inter-nuclear distance). For small molecules in solution, the NOE is positive (affected resonances increase in
J
X X
H H t1
Acquisition J X X H H J X H Acquisition time t1 DIPSI-2 Acquisition X X H H NOE Acquisition time
t1 m
Acquisition J X X H H Acquisition t1
/2 /2
Acquisition time
Decouple
/2 /2
1H
18
intensity) whereas for larger molecules, the NOE is negative (affected resonances decrease in intensity). The NOESY spectrum can be used both to help assignment (especially of aromatic residues) and to get structural restraints for solution structure determination.Finally, the HSQC (heteronuclear single-quantum coherence) experiment correlates coupled heteronuclear spins across a single bond and identify directly connected nuclei. The pulse sequence of HSQC (heteronuclear single-quantum coherence) uses the INEPT (insensitive nuclei enhancement by polarization transfer) sequence to transfer proton magnetization into heteronuclear single-quantum coherence. The magnetization is transferred from hydrogen to attached nuclei (e.g., 15N, 13C, 19F) via the J-coupling. In the case of macromolecules, such as
proteins, the 1H-15N HSQC experiment is the most standard experiment and shows all H-N correlations. Mainly these are the backbone amide groups are visible, but the NH signals of the side chain of some amino acids are also visible. In this experiment the chemical shift is evolved on the nitrogen and the magnetization is then transferred back to the hydrogen for detection.
2.2BACTERIAL GROWTH AND PROTEIN PURIFICATION
The triheme cytochromes PpcB, PpcC, PpcD and PpcE were previously purified and were available in the laboratory. The triheme cytochromes PpcA and PpcA with phenylalanine 15 replaced by a leucine (PpcAF15L) were expressed and purified in this work according with the protocol described below. In each case the expression and purification protocols used were identical.
Escherichia coli strain BL21(DE3) harbouring the plasmid pEC86 [36], containing the
cytochrome c maturation gene cluster, ccmABCDEFGH [36], was transformed with the plasmid
pCK32, the expression vector containing the gene sequence encoding for each triheme cytochrome following standard protocols. Transformed E. coli cells were grown in 2x yeast
extract–tryptone medium (2xYT) supplemented with 34µg/mL chloramphenicol (CLO) and 100 µg/mL ampicillin (AMP), both from NZYTech. Cultures were grown aerobically to mid-exponential phase (OD600>1.5) at 30°C and 200rpm after cultures. Production of unlabeled and labelled proteins were carried out through two different processes, respectively: (i) unlabeled protein expression was induced with 10µM isopropyl-β-D-thiogalactopyranoside (IPTG) from NZYTech; (ii) after cultures reaching an OD600>1.5, 1L of 2xYT growth media were harvested by centrifugation at 6400g during 30min. The cell pellet was then washed twice with 500mL of a
salt solution containing 110mM KH2PO4, 240mM Na2HPO4, and 43mM NaCl (Panreac). Then, cells were resuspended in 250mL of minimal media containing 22mM KH2PO4, 48mM Na2HPO4, 8.6mM NaCl, 20mg/L biotin (Sigma), 2mM MgSO4.7H2O (Panreac), 0.1mM CaCl2 (Sigma-Aldrich), 5M MnCl2·4H2O (Baker’s), 10M FeSO4.7H2O (Merck), 20mg/L vitamin B1 (Merck), 4g/L glucose (Sigma) as carbon source, 5g/L 15NH
Experimental procedures 2012
19
overnight incubation at 30°C and 180rpm, cells were harvested and the periplasmic fraction was isolated by centrifugation at 6400g for 20min at 4°C. The cell pellet was gently resuspended in30ml of lysis buffer (20% sucrose (Fisher scientific), 100mM Tris-HCl (Nzytech) pH 8.0 and 0.5mM EDTA (Sigma) containing 0.5mg/mL of lysozyme (Fluka)), per liter of initial cell culture. Then, lysis buffer was added (30mL of initial cell culture) and the suspension was incubated on ice during 15min and then centrifuged at 15000g for 20min at 4°C. The supernatant constituted
the periplasmic fraction, which was ultracentrifuged at 150000g for 1h 30min at 4°C and then
dialysed against 10mM Tris-HCl pH 8.5.
The purification of the proteins was performed using two chromatographic methods: cation exchange and molecular exclusion. For cation exchange chromatography 2x5mL Econo-Pac High S cartridges (Bio-Rad) equilibrated with 10mM Tris HCl pH 8.5 were used and proteins were eluted with a 0-300mM NaCl gradient in 10mM Tris HCl pH 8.5, at a flow rate of 1mL/min. For molecular exclusion chromatography, red coloured fractions were concentrated to 1mL and then injected in a Superdex 75 molecular exclusion column (GE Healthcare) equilibrated with 100mM sodium phosphate buffer, pH 8.0. Protein was eluted at a flow rate of 1mL/min and the protein purity was evaluated by SDS-PAGE (15%), stained with Coomassie brilliant blue (Sigma).
2.3 NMR STUDIES
All of the NMR experiments were acquired in a Bruker Avance III 600 spectrometer equipped with a triple-resonance cryoprobe (TCI). 1H chemical shifts were calibrated using the water signal as internal reference and the 15N and 13C chemical shifts calibrated through indirect referencing [37]. Spectra were processed using TopSpin (Bruker BioSpin, Karlsruhe, Germany) and analysed with the program Sparky.
2.3.1PREPARATION OF NMR SAMPLES
For NMR studies, 15N-labelled samples were prepared in 92%H
2O/8%2H2O and unlabelled samples prepared in 92% H2O/8% 2H2O or in pure 2H2O (CIL isotopes). Protein samples with ~1mM concentration were prepared in 45mM or 80mM phosphate buffer pH 7.1 or 8.0 with NaCl (100mM or 250mM final ionic strength, respectively).
For the experiments in the fully reduced form, the NMR tubes were sealed with a gas-tight serum cap and the air was flushed out from the sample, to avoid oxidation of the samples. Then, NMR samples were reduced directly in the NMR tube with gaseous hydrogen in the presence of catalytic amounts of hydrogenase from Desulfovibrio vulgaris (Hildenborough), as previously
20
2.3.2NMR EXPERIMENTS IN THE REDUCED FORM
For the assignment of protein heme substituents in the reduced form, 2D-NMR experiments including 1H-1H-NOESY with 80ms mixing-time and 1H-1H-TOCSY with 45ms mixing-time, were acquired. 2D-NMR spectra were recorded with 256 scans, and spectral width of 14kHz, using a pulse sequence with water pre-saturation. 2D experiments were acquired with a sweep width of 512Hz in F2 and 4096Hz in F1. The experiments were acquired at 16ºC or 25ºC.
For the determination of solution structure of PpcAF15L, the following set of experiments were acquired for (i) 15N labelled in 92% H
2O/8% 2H2O: 2D-1H-15N-HSQC; (ii) for unlabelled sample in 92% H2O/8% 2H2O: 2D-1H-COSY, 2D-1H TOCSY with 60ms mixing time and 2D-1H-NOESY with 50ms mixing time. 2D-1H-TOCSY (45ms mixing-time) and 2D-1H-NOESY (100ms mixing-time). NMR spectra were also acquired for the unlabeled sample prepared in pure 2H
2O to assist in the assignment of the heme proton signals. Before and after all two dimensional experiments, 1D-1H NMR spectra were recorded in order to verify the protein integrity and fully reduction.
2.3.3NMR EXPERIMENTS IN THE OXIDIZED FORM
Two-dimensional NMR 1H-1H-NOESY, 1H-1H-TOCSY and 1H-13C HSQC experiments were performed at 16ºC and 25ºC [38]. 2D-1H-NOESY NMR spectra were collected with a mixing time of 80ms and a sweep width of 24kHz in both dimensions. 2D-1H-TOCSY NMR experiments were performed with 45ms mixing-time and a sweep width of 24kHz. The 1H-13C HSQC NMR spectra, obtained from natural abundance samples, were acquired with a sweep width of 24kHz in F2 and 45kHz in F1.
2.3.4 PH TITRATION OF THE PPCA MUTANT
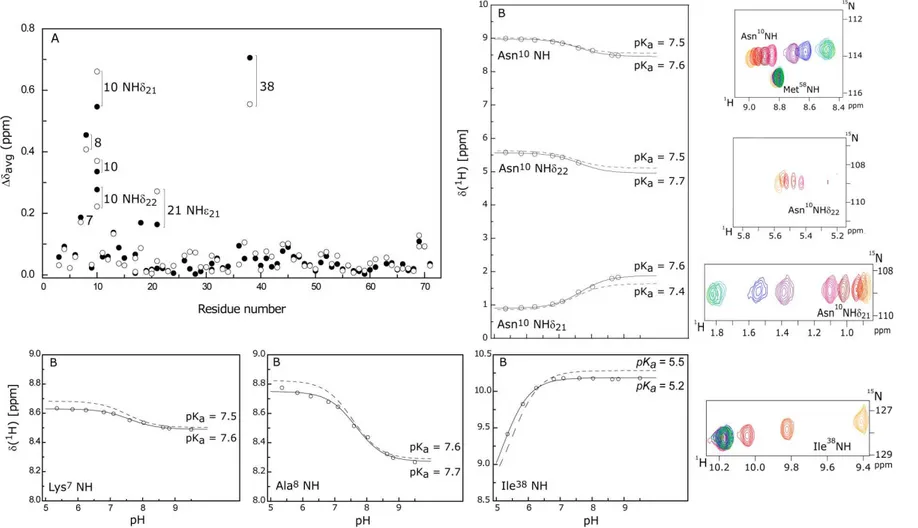
The pH titration of PpcAF15L was carried out by 1H-15N-HSQC NMR in the pH range 5.4-9.5 and all 1H and 15N chemical shifts of the polypeptide backbone (except for residues 1 and 2) and side chains were measured. To adjust the pH of the samples minimal amounts of either NaO2H or 2HCl were added inside an anaerobic glove chamber at <1 ppm oxygen, in order to avoid sample oxidation. The weighted average chemical shift (∆avg) of each backbone and side chain amide was calculated as described in Equation 3:
√


![Figure 5 - Comparison of PpcA lowest energy solution structure (PDB 2LDO) [27] with PpcA crystal structure (PDB 1OS6) [19]](https://thumb-eu.123doks.com/thumbv2/123dok_br/16490185.733121/28.892.250.675.124.495/figure-comparison-lowest-energy-solution-structure-crystal-structure.webp)


![Figure 11 - 1D- 1 H NMR spectra obtained for PpcA–E in the oxidized state (25ºC and pH 7.1) [58]](https://thumb-eu.123doks.com/thumbv2/123dok_br/16490185.733121/49.892.210.679.367.948/figure-nmr-spectra-obtained-ppca-oxidized-state-ºc.webp)