Artigo
*e-mail: [email protected]
ARSENIC AND TRACE METALS IN WATER AND SEDIMENT OF THE VELHAS RIVER, SOUTHEASTERN IRON QUADRANGLE REGION, MINAS GERAIS, BRAZIL
Danilo de C. Silvaa, Carlos R. Bellatoa,*, José de O. Marques Netoa and Maurício P. F. Fontesb aDepartamento de Química, Universidade Federal de Viçosa, 36570-000 Viçosa – MG, Brasil bDepartamento de Solos, Universidade Federal de Viçosa, 36570-000 Viçosa – MG, Brasil
Recebido em 03/05/2018; aceito em 17/07/2018; publicado na web em 21/08/2018
This work was undertaken in the Velhas River Basin, in the municipalities of Rio Acima, Nova Lima, Raposos and Sabará, upstream of the city of Belo Horizonte in Minas Gerais State, Brazil. Velhas River provides the public water supply for much of this region. The gold and iron mining activities in the Velhas River yield considerable amounts of suspended solids as well as metals to the hydrological system of the region. Thus, the present study sought to evaluate the concentrations of arsenic and trace metals in the waters and their distribution and mobility in sediment by BCR sequential extraction. Arsenic concentrations in the water samples were between 78.1 and 85.3 µg L-1, which exceeded 10 µg L-1 (maximum limit permitted by Brazilian environmental regulations for water destined to human consumption, CONAMA Resolution 357/2005). The sequential extraction of the sediment showed considerable amounts of As (20%), Cd (55%), Co (56%), Cr (16%), Cu (23%), Ni (29%), Pb (47%) and Zn (71%) associated with the geochemical fractions considered potentially available for the remobilization to the aquatic environment. The presence of the elements in these fractions indicated high ecotoxicological risk and potential harm to the health of the local population.
Keywords:BCR-sequential extraction, fractionation, arsenic, trace metals, bioavailability
INTRODUCTION
The Velhas River Basin is an area of considerable socioeconomic relevance, since it provides water to the entire metropolitan region of the city of Belo Horizonte, for human consumption and agricultural and industrial uses. The highest part of the basin is a region of springs, located southeast of the so-called Iron Quadrangle (IQ), where the intense mining activity generates effluents with high contents of suspended solids and various metal species.1,2 The IQ region has been mined since the mid-seventeenth century, with historical release of metals into the watercourses that drain the region.3 In the River Basin, arsenic (As) has been found in surface waters at concentrations exceeding the established limits for water destined for human consumption.4 In some parts of the IQ, the concentration of As in surface water has reached as high as 414 µg L-1.5 Anthropic As contamination in the Nova Lima region was investigated by Matschullat et al.,3 who measured the levels of As in the urine of children aged from 7 to 12 years. The values obtained were between 2 and 106 µg L-1, with 22% of the children presenting concentrations above 40 µg L-1, which may have toxic effects.
The presence of arsenic in IQ sediments has been studied during several decades.6–10 Borba et al.10 reported As concentrations exceeding 1000 µg g-1 in sediments of the Velhas River between 1997 and 1998. Deschamps et al.6 studied the same area and found values up to 3300 µg g-1 between the years 1998 and 2003. These findings showed that arsenic was present in sediments of this region at concentrations much higher than 17.0 µg g-1 (Level 2 - probable effects level in the environment) established in the CONAMA Resolution 454 (2012).11 Besides arsenic, quantities of Cd (5.9-6.9 mg kg-1), Co (29.9-48.4 mg kg-1), Cr (61.7-102.5 mg kg-1), Cu (24.3-34.8 mg kg-1), Ni (22.0-69.0 mg kg-1), Pb (21.9-37.1 mg kg-1) and Zn (33.1-77.7 mg kg-1) were also found in sediments in this region.9 These studies have focused only on the investigation of the total metal contents in sediments. However, it cannot provide
sufficient information about the mobility, bioavailability and toxicity of metals. The speciation of metals in sediments is therefore a critical factor in the assessment of the potential environmental impacts.12–14 Chemical speciation can be defined as the process of identification and quantification of different species, forms or phases of chemicals present in a material.15
Sequential extractions are widely used to investigate the association between trace metals and the different mineral and organic phases in sediments. The results can be used to predict the mobility and potential bioavailability of the metals.16–19 The advantage of the sequential extractions is the provision of detailed information about the origins, modes of occurrence, physicochemical and biological availability, mobilization and transport of trace metals.20–25
The technique uses reagents to carry out successive leaching of specific geochemical fractions and several different protocols are proposed in the literature. The first, developed by Tessier et al.,26 proposed a five-step extraction to establish the different fractions to which the elements are sorbed. Subsequent authors, including Ure et al.27 and Rauret et al.,28 have adapted this protocol by using other reagents or by adding or reducing the number of steps in order to improve the efficiency and selectivity of the protocol. However, the sequential extraction protocols are criticized for the lack of selectivity and readsorption phenomena of the elements.29 Moreover, the element mobility is assessed under specific physicochemical conditions imposed by the chemical reagents used.17
aimed to: (i) study the total concentrations of arsenic and trace metals (Cd, Co, Cr, Cu, Ni, Pb and Zn) in sediments from the upper part of the Velhas River; (ii) assess the mobility of these elements through fractionation studies; and (iii) determine the total concentrations of these elements in water samples.
EXPERIMENTAL SECTION
Area under study
Minas Gerais state represents one of the largest mining potential of the country. Consequently, the environmental problems resulting from this mineral-extractive activity in the region are extremely relevant. Therefore, in the Iron Quadrangle (IQ), where much of the mining activities of the state is developed, there is a huge environmental impact on water resources. The IQ is a mountainous region with great concentrations of iron, gold, manganese, aluminum and topaz.1
The Velhas River is the largest tributary of the São Francisco river basin, whose source is located in the municipality of Ouro Preto. It discharges into the São Francisco river, downstream of the Três Marias dam. It has about 761 km of length, an average width of 38.4 m, and drains an area of 29,173 km2. The highest portion of the Velhas River basin, region of springs, located southeast of the IQ, presents intense mining activity and consequent generation of effluents with high levels of suspended solids and different metal species. Its area is also of great socio-economic relevance because it provides water for the entire metropolitan area of Belo Horizonte, for human consumption, agricultural and industrial use, among other purposes. The Velhas River currently supplies water to more than two million people, from an extraction point in the district of Bela Fama (20°00’15.70”S, 43°49’53.20”W), in the municipality of Nova Lima, operated by the Minas Gerais Sanitation Company (Copasa). This water accounts for approximately 60% of the water supply of
the Metropolitan Region of Belo Horizonte, and is distributed to the municipalities of Belo Horizonte, Nova Lima, Raposos, Ribeirão das Neves, Sabará and Santa Luzia.
Sample collection and preparation
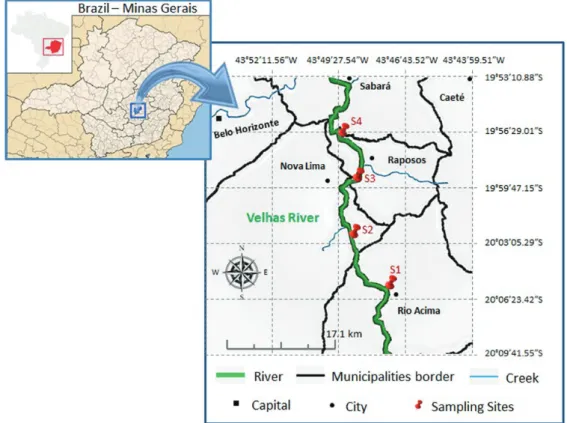
Four water and sediment samples (S1 to S4) were collected along a ~40 km stretch of the Velhas River, on July 7, 2016, in the municipalities of Rio Acima, Nova Lima, Raposos and Sabará (Figure 1). The water samples were collected at each sampling point, backwater areas, using 1000 mL polytetrafluoroethylene flasks previously washed and rinsed with water. The samples were acidified to pH 2 with nitric acid, and immediately transported in coolers to the laboratory, where they were kept refrigerated at 4 °C until analysis was performed. For sediment sampling, backwater areas were selected, where the lower energy of the fluvial system favors the deposition of thinner material which makes them more interesting for the environmental evaluation of the behavior of the chemical elements.1 About 2 kg of composed sediment samples (0 – 20 cm) were collected in each fluvial segment, according to USGS30 recommendations, using a polyethylene sampler manufactured in the laboratory (plastic shovel), and placed in plastic bags. The sediment samples were transferred to plastic bags and transported in coolers to the laboratory, where they were dried naturally, sieved (< 2 mm), carefully ground in a porcelain mortar, and homogenized. No preservatives were added to the sediments. Part of the samples (< 2 mm) was submitted to physical and chemical characterization and part was sieved to < 1 mm for sequential extraction analyses.
Reagents and glassware
The sampling flasks and glassware were immersed in 10% (v/v) nitric acid for 48 h and then thoroughly rinsed with high purity deionized water from a Milli-Q® system (Millipore, Bedford, MA,
USA). All the reagents used were analytical grade. A multielement stock standard solution containing 10 mg L-1 of As and the metals Cd, Co, Cr, Cu, Ni, Pb, and Zn was obtained from Perkin Elmer. Ultrapure 69.5% (w/w) HNO3 (Fluka) was used for the preparation of all the standard solutions and preservation and dilution of the samples.
Instrumentation
The arsenic and trace metals were analyzed using an ICP-MS (model NexION 300D, Perkin Elmer) in kinetic energy discrimination (KED) mode with helium gas. Table 1S presents the instrumental parameters of ICP-MS. All of the isotopes were selected according to their natural abundance and spectral interference possibility. Multielement standards were used to construct a linear calibration curve. All measurements were performed by employing optimized conditions previously established. A portable pH, redox potential and temperature meter (WTW, model 340i) and a portable dissolved oxygen (DO) meter (HANNA, model HI-9142) were used to characterize the physicochemical properties of the water samples. An analytical balance (AB204-S; METTLER TOLEDO, Brazil), a Fanen 315 centrifuge (São Paulo, Brazil) and a Milestone Ethos 1 microwave oven for closed-vessel acid digestion (Milestone, Sorisole, Italy) were also used.
Analytical procedure
Physicochemical characterization of the samples
The redox potential, pH, temperature and DO were determined using portable devices to characterize the physicochemical properties of the water samples in the field. The analysis of the arsenic and trace metals in the water samples was carried out by adding 5 mL of concentrated nitric acid to 45 mL of water. The mixture was digested in a microwave oven, where the temperature was raised to 160 °C in 10 min (1,000 W) and maintained under these conditions for 10 min. After digestion, the aliquots were filtered into 50 mL flasks and the volume was completed with purified water (Milli-Q). For Cu dissolved analysis, the samples were filtered through a cellulose acetate filter, 0.45 µm pore size. The determination of arsenic and trace metals was performed using an ICP-MS.
For the physicochemical characterization of the sediment samples, the procedures included pH, cationic exchange capacity (CEC), organic matter determination, grain size analysis and X-ray diffraction. The sediment samples were sieved (< 2 mm) and submitted to chemical and physical characterization. The pH was determined on a 1:2.5 soil: deionized water and KCl 1 mol L-1 ratio; the potential acidity (H + Al) was extracted with Ca(OAc)2 0.5 mol L−1 buffered to pH 7.0, and quantified by titration with NaOH 0.0606 mol L−1. Exchangeable Ca2+, Mg2+ and Al3+ were extracted with 1 mol L−1 KCl and Na+ and K+ were extracted with Mehlich-1.31 The effective cation exchange capacity was calculated by the sum of cations (Ca2+, Mg2+, Na+, K+ and Al3+). The total cation exchange capacity was estimated by the sum of bases (SB) and potential acidity. The organic matter was determined according to Walkley–Black titration method32 by wet oxidation with K2Cr2O7 0.167 mol L−1 in the presence of sulfuric acid with external heating.33 The textural analysis, the proportion of different grain sizes, was performed by sieving (sand fraction) and by the pipette method (silt and clay fractions).31,34
Diffractograms were obtained using powder X-ray diffraction, performed on a Panalytical X’Pert PRO diffractometer equipped with a cobalt tube (Co-Kα radiation, λ = 1.790269 Å) operated at 40 kV and 40 mA. Scanning was performed using the step-by-step method, ranging between 4° and 50° 2θ, with an increment of 0.05° and time of 1 s per step.
BCR sequential extraction procedure
The partitioning of As and trace metals in the different sediment fractions was determined using the BCR sequential extraction procedure described by Ure et al.27 and Rauret et al.28 (Table 2S) employing ~0.8000 g portions of sediment sieved to < 1 mm, which were transferred to 50 mL centrifuge tubes. At the end of each step, the extracts were separated from the residual solids by centrifugation for 20 min at 3000 rpm. The residue was washed by adding 16 mL of water and stirring for 15 min, and the resulting suspension was centrifuged. The supernatant was decanted and discarded. In the fourth step, the residue was subjected to pseudo-total digestion by the addition of 12 mL of aqua regia and heating in a microwave oven, where the temperature was raised to 200 °C in 10 min (at a power of 1,200 W) and the final temperature for 15 min was maintained.
The same digestion process was applied to 0.5000 g of whole sediment (not subjected to the extraction steps), in order to determine the pseudo-total (PT) contents of the analytes. For each step of the BCR procedure, and after the pseudo-total digestion, the element concentrations were determined by inductively coupled plasma mass spectrometry (ICP-MS). Internal standard (Rh 5 µg L-1) and collision cell (He > 99.999%) were used during the determinations to avoid interferences.
Quality control of metal analysis
The limits of detection (LOD) for the BCR method were calculated based on the expression 3s/b, where s is the standard deviation of the blank and b is the slope of the calibration graph.35 Ten analytical blanks were analyzed for each step of the extraction process. Since it is difficult to obtain a blank sediment, the signal obtained using the reagents for each extraction stage was treated as the blank. The LOD calculation considered the use of 1 g portions of sample in extractions, and any necessary dilutions. The LOD values varied from 0.01 µg L-1 (Co) to 0.09 µg L-1 (Zn) (Table 3S). The correlation coefficients (r) of the calibration curves were greater than 0.998 for all elements studied (Table 3S). These detection limits are considered acceptable for general analysis in environmental studies,35,36 and are comparable to those obtained in previous work using similar material.37-39
The SRM 2704 reference material from the National Institute of Standards and Technology (NIST; Buffalo River Sediment) was submitted to the first three steps of the BCR extraction method. The recoverability capacity of the method was evaluated by the relationship between the sum of the content extracted in the three initial steps and the certified values. The accuracy and interference effects were evaluated using SRM 2704 reference material and addition-recovery experiments. The addition-recovery experiments were carried out using three concentration levels (10 µg kg-1, 25 µg kg-1 and 50 µg kg-1).38 In order to perform these procedures, sub-samples of a randomly selected sample (S2) were digested in triplicate with aqua regia in a microwave oven, maintaining the same conditions described above and subsequently analyzed by ICP-MS.
RESULTS AND DISCUSSION
Sediment analysis
Physicochemical characterization
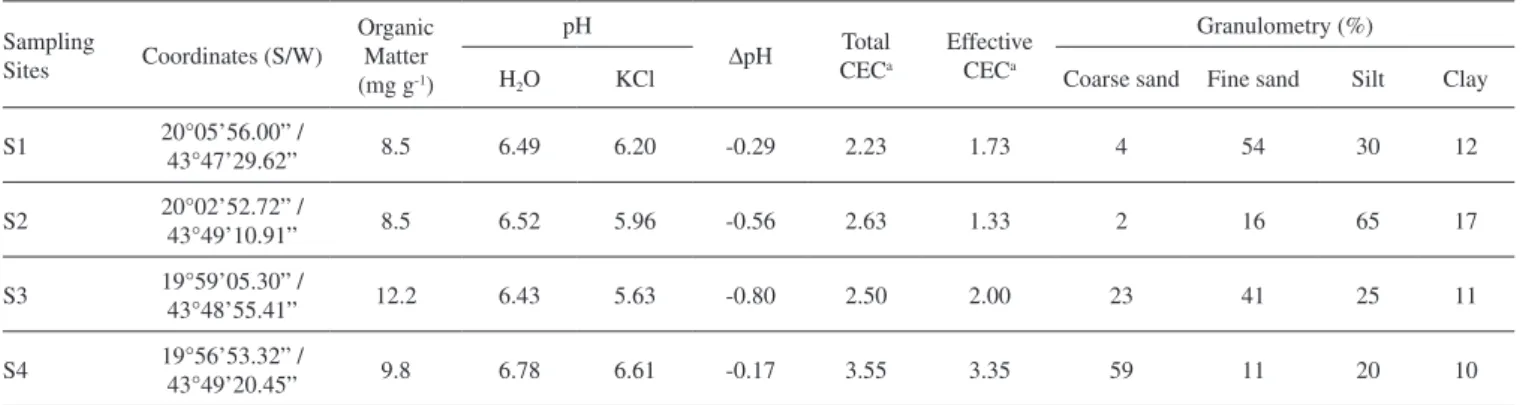
∆pH (Table 1), obtained as the difference between the pH in KCl and the pH in H2O, indicated the prevalence of negative charges on the surfaces of the sediment particles, which could permit the adsorption of trace elements.9 The collected sediment samples showed low Cation Exchange Capacity (CEC), which can be explained by the absolute prevalence of the sand fraction.
Organic matter contents shown in Table 1 ranged from 8.5 to 12.2 mg g-1. The presence of organic matter enabled interactions with other components and changes in the physical, chemical, and biological properties of soils and sediments. Furthermore, organic matter interrupt or release toxic elements to the plants, thus affecting the mobility, availability, volatility, and biodegradability of organic and inorganic molecules.8 The X-ray diffractograms of the sediment samples (Figure 2) revealed the presence of secondary minerals (gibbsite, goethite and hematite), which also indicated good capacity for the retention of trace elements on the surfaces of iron and aluminum oxides.9,40
Concentrations of As and trace metals
Table 2 shows the concentrations of arsenic and the trace metals for the sediment samples. There were large variations in the concentrations of As (30.8-206.7 mg kg-1), Cr (133.2-302.5 mg kg-1), Ni (45.5-140.1 mg kg-1), and Zn (20.5-89.8 mg kg-1). The highest concentrations were found for Cr at point S4 (302.5 mg kg-1) and As at point S3 (206.7 mg kg-1).
Brazilian legislation has not established the maximum permissible concentrations of the elements studied in the sediments. The National Environment Council (CONAMA), in Resolution 454 of 1st November 2012,11 has set out the general guidelines and minimum procedures for the assessment of sediments to be dredged, adopting the criteria established by the Canadian Council of Ministers of the Environment (CCME)41 for arsenic, heavy metals, and organic compounds, in order to protect aquatic life. CONAMA11 Level 1 corresponds to the TEL
(threshold effects level) of the CCME index. Environmental damage is not expected for values below Level 1. The values between Level 1 and Level 2 indicate occasional adverse effects. Level 2 corresponds to the PEL (probable effects level) of the CCME index.41 Values above Level 2 often present adverse effects on the environment.41
The concentrations of As, Cd, Cr, and Ni were above the PEL (Level 2) in all the samples evaluated (Table 2), which may
Figure 2. X-ray diffraction spectra from silt fraction of the sediments samples. Sampling sites S1 to S4
Table 1. Characterization of the sediments collected along the Velhas River
Sampling
Sites Coordinates (S/W)
Organic Matter (mg g-1)
pH
∆pH CECTotal a
Effective CECa
Granulometry (%)
H2O KCl Coarse sand Fine sand Silt Clay
S1 20°05’56.00” / 43°47’29.62” 8.5 6.49 6.20 -0.29 2.23 1.73 4 54 30 12
S2 20°02’52.72” / 43°49’10.91” 8.5 6.52 5.96 -0.56 2.63 1.33 2 16 65 17
S3 19°59’05.30” /
43°48’55.41” 12.2 6.43 5.63 -0.80 2.50 2.00 23 41 25 11
S4 19°56’53.32” / 43°49’20.45” 9.8 6.78 6.61 -0.17 3.55 3.35 59 11 20 10 aCEC cation exchange capacity.
Table 2. Arsenic and trace metals in sediment sample from the Velhas River
Sampling Sites Concentration of As e trace metals in (mg kg -1)a
As Cd Co Cr Cu Ni Pb Zn
TELb 5.9 0.6 --- 37.3 35.7 18 35 123
PELc 17 3.5 --- 90 197 35.9 91.3 315
indicate adverse biological effects. The sediment samples showed concentrations of copper below the lowest level (S1), or between the lowest and highest limits (S2-S4). Only Pb and Zn were present at concentrations considered to be rarely associated with adverse biological effects for all samples. No criteria have been established for Co. Previous work in the IQ region also showed arsenic content above TEL and PEL values.1,7 The concentrations of Pb and Zn in the sediments presented no ecotoxicological risk, according to the PEL and TEL values. However, this approach does not consider the distributions of the elements among the different sediment fractions. The use of the BCR fractionation method provided a better evaluation of the ecological and toxicological risks and showed that Pb and Zn were present at significant concentrations in potentially remobilizable sediment fractions.
Fractionation of As and trace metals
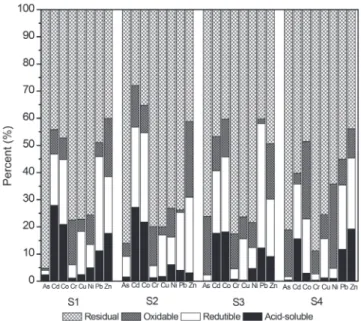
The sequential extraction procedure allowed determining the distribution of the arsenic and trace metals between the different geochemical fractions, which reflected the relative proportions of each metal transported by different chemical mechanisms.9,19,21,37
The acid soluble fraction (F1) shows the amount of each element that would be released into the environment if conditions became more acidic. It is the fraction with the most labile bonding to the sediment and, consequently, the greatest environmental risk. The reducible fraction (F2) theoretically represents the content of each metal bound to iron and manganese oxides that would be released if the sediment were subjected to more reducing conditions. The oxidizable fraction (F3) reflects the amount of metal bound to the organic matter and sulfides, which would be released if conditions became oxidizing. Such a change may occur during dredging. The residual fraction (R) contains the metals with the strongest association with the crystalline structures of the minerals, which are therefore the most difficult to separate from the sediments.16,19,20,24
Figure 3 and Table 4S show the results of the fractionation of arsenic and trace elements. In general, the chemical elements in the four fractionated sediments have similar behavior.
In the fraction F1, the proportions of the elements As, Cr, Cu, and Ni were relatively low (<10%), while higher percentages were found for Cd (1.5-25.3%), Co (1.2-21.8%), Pb (2.7-17.2%), and
Zn (3.1-19.2%). The presence of these metals in fraction F1 reflect their higher mobility and the greater risk they could present to the environment.37,39,42-46 This implied that the toxic species Cd, Pb, and Zn could be potentially harmful to the aquatic biota, since they could be remobilized under changing environmental conditions.43,46-49
In the fraction (F2), Co, Cu, Pb, and Zn presented relatively high percentages (>10%), which accounted for averages of 19.1, 11.3, 26.9, and 22.7% of the total concentrations of Co, Cu, Pb, and Zn, respectively. Due to their large surface areas available for adsorption, the Fe and Mn hydroxides contained in this fraction can readily adsorb these metals. The adsorbed metals can potentially be converted into available forms, following the changes in the redox potential or pH of the medium.43,50
In the fraction (F3), Co and Zn presented percentages higher than 10% for most of the sampling points. On average, 24.4% of Co and 25.9% of Zn were found in this fraction, with 8.0-70.1% range for Co and 10.8-47.4% range for Zn. The association between metals and organic matter is due to the high affinity of the elements for the humic substances present in the organic matter.50 These metals are strongly complexed in sediments and can be released after the degradation of the organic matter or oxidation of sulfides to sulfates.43
The residual fraction (R) corresponded to the portion of the elements that remained occluded as a constituent of the crystalline structures of non-silicate minerals. This fraction is considered stable, resistant to weathering, non-bioavailable, without any potential for release into the aquatic environment. It was extracted in the final stage of the procedure, by digestion using aqua regia. The residual fraction presented the highest percentages (above 50%), among all the elements studied. The large amounts of the metals in this fraction showed that they were bound to the crystalline networks of primary and secondary minerals and difficult to remobilize to the aquatic environment.43
Availability of As and trace metals
The sediment fractions obtained using the optimized BCR protocol reflect the mechanisms by which the metals are associated with the sediment.17,20,29 The metals extracted in the first fraction (F1) correspond to those weakly adsorbed or associated with carbonates. The second fraction (F2) contains those associated with Fe and Mn oxides, while the third fraction (F3) encompasses those associated with sulfides and organic minerals derived from natural geological formations, which can contain trace metals within their crystalline structures. The residual fraction (R) contains the primary and secondary minerals derived from natural geological formations, which can contain trace metals within their crystalline structures.17,19,37
When the presence of metals and metalloids in aquatic environments is only related to the local lithology, with release caused by natural weathering, the elements are mainly found in the residual fraction. On the other hand, in the presence of anthropogenic activities, high concentrations are expected in the potentially remobilizable fractions, due to the incorporation of the elements in the sediment by means of adsorption, precipitation, and co-precipitation.1,17–19
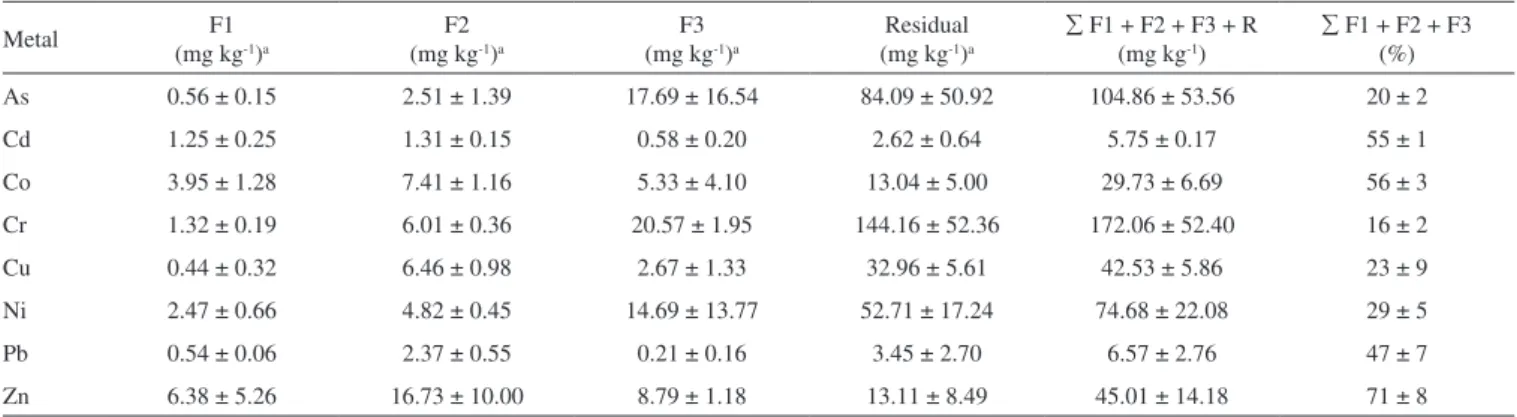
Table 3 presents the concentrations of As, Cd, Co, Cr, Cu, Ni, Pb and Zn (as mg kg−1, on a dry mass basis) obtained for each stage of sequential extraction, together with the sum of the four fractions (F1+F2+F3+R) and the percentages (%) of the eight elements extracted from the most labile fractions (F1+F2+F3). The results showed that the highest amounts of Zn, Co, Cd, and Pb were found in the labile fractions (F1+F2+F3), with mean values of 71, 56, 55, and 47% of the total contents, respectively.
The environmentally mobile fraction (F1) was generally the smallest, and the reducible (F2), oxidizable (F3) and residual (R)
Figure 3. Fractionation of As, Cd, Co, Cr, Cu, Ni, Pb and Zn in the sediment
fractions, the most significant. This can be seen in Figure 3, which illustrates the results as percentages of metal extracted in each fraction, for the four sediment samples. The percentage of metal extracted was calculated from the ratio between the concentration of the element in each fraction, and the sum of the concentrations in all fractions.
In the most labile fraction, the metals are weakly bound with the sediment, and are therefore considered to be the most unstable and reactive phase. The fraction of extractable metal is determined by electrostatic adsorption, and metals that have affinity for carbonates can co- precipitate as carbonate minerals at high pH.9,37 It is extremely important to determine these, since they indicate both the pollution potential of the metals contained in the sediment, and of more recent contamination.
Previous studies on the IQ region also showed high arsenic and trace metals contents present in the most labile sediment fraction.1,9 It has already been found that Zn is weakly adsorbed (retained on the sediment surface by weak electrostatic interaction), the oxides of Fe and Mn are important scavengers of Pb, and the other metals are less available to the aquatic system.1,9,21 The presence of these elements in labile fractions indicates high potential risk of contamination of the aquatic biota, since small changes in environmental conditions, such as pH or redox potential of the medium, could lead to the remobilization of the elements.9,20,24
Method efficiency
The pseudo-total (PT) digestion of the sediment was performed using aqua regia, which does not release the fraction of trace elements present in the crystalline structure of silicate minerals. However, this
analysis is useful for calculating the recovery percentage (the ratio between the sum of the concentrations obtained in steps F1, F2, F3, and R, and the pseudo-total concentration), which provides an internal check of the extraction efficiency. The results of the pseudo-total digestion of the sediment samples with aqua regia are shown in Table 4S. Acceptable recovery percentages were obtained for the BCR method, from 76 to 115%. The application of this method to the SRM 2704 NIST reference material (Table 5S) also showed satisfactory recoveries in relation to the certified values: As (95%), Cd (81%), Co (87%), Cr (98%), Cu (99%), Ni (94%), Pb (93%) and Zn (95%). Very good agreement was also achieved, with no significant differences between the values at the 95% confidence level (t-test). Recoveries higher than 97% and less than 105% were obtained in the addition-recovery experiments carried out in the sample S2, using the three concentration levels (10 µg kg-1, 25 µg kg-1 and 50 µg kg-1). These values reflect the efficiency of the method, as well as the precision of the results, and are considered satisfactory, given the complexity of the sediment matrix.37
Water analysis
The results of the physicochemical analyses of the samples collected in the Velhas River are shown in Table 4. The pH values were within the limits established in CONAMA Resolution 357/20054 for Class 2 waters (pH 6.0-9.0). The redox potentials (Eh) of the samples ranged from 183 to 262 mV, which indicates oxidizing conditions, as expected for well-oxygenated surface waters. The dissolved oxygen concentrations complied with the limit established in Brazilian environmental legislation (values above 5 mg O2 L-1).4 In Table 3. Results obtained for the average concentration of As, Cd, Co, Cr, Cu, Ni, Pb and Zn in each fraction, Σ F1 + F2 + F3 + R and Σ F1 + F2 + F3 for sediment samples from the Velhas River
Metal (mg kgF1 -1)a (mg kgF2 -1)a (mg kgF3 -1)a (mg kgResidual -1)a ∑ F1 + F2 + F3 + R (mg kg-1) ∑ F1 + F2 + F3 (%) As 0.56 ± 0.15 2.51 ± 1.39 17.69 ± 16.54 84.09 ± 50.92 104.86 ± 53.56 20 ± 2 Cd 1.25 ± 0.25 1.31 ± 0.15 0.58 ± 0.20 2.62 ± 0.64 5.75 ± 0.17 55 ± 1 Co 3.95 ± 1.28 7.41 ± 1.16 5.33 ± 4.10 13.04 ± 5.00 29.73 ± 6.69 56 ± 3 Cr 1.32 ± 0.19 6.01 ± 0.36 20.57 ± 1.95 144.16 ± 52.36 172.06 ± 52.40 16 ± 2 Cu 0.44 ± 0.32 6.46 ± 0.98 2.67 ± 1.33 32.96 ± 5.61 42.53 ± 5.86 23 ± 9 Ni 2.47 ± 0.66 4.82 ± 0.45 14.69 ± 13.77 52.71 ± 17.24 74.68 ± 22.08 29 ± 5 Pb 0.54 ± 0.06 2.37 ± 0.55 0.21 ± 0.16 3.45 ± 2.70 6.57 ± 2.76 47 ± 7 Zn 6.38 ± 5.26 16.73 ± 10.00 8.79 ± 1.18 13.11 ± 8.49 45.01 ± 14.18 71 ± 8 aMean of 3 repetitions ± standard deviation.
Table 4. Physical–chemical parameters related to water quality and arsenic and trace metals level in samples of water
pH Redox Potential
(mV)
Tempera-ture (°C)
Dissolved Oxygen (mg L-1)
Concentration in µg L-1a
As Cd Co Cr Cuc Ni Pb Zn
BESb 6.0-9.0 > 5 10 1 50 9 25 30 180
Sampling sites
the environment, oxygen acts as the main electron acceptor, and when present in high amounts, other dissolved chemical species, such as Fe, Mn, and nitrogen and sulfur compounds will mainly exist in oxidized forms, which results in higher Eh values in the aquatic environment. Differences in temperature between the collection sites could be considered normal and were due to diurnal variations.
Table 4 also shows the total concentrations of arsenic and trace metals in the water samples collected in the Velhas River. The four surface water samples exceeded the permissible limits for As in Class 1 and 2 watercourses (10 µg L-1).4 The high concentration of As in the water samples is very alarming, since the consumption of water containing arsenic can cause dermatitis, skin cancer, neurological disorders, hepatomegaly, cardiac problems, internal cancers, and poisoning.51,52 The study area is very rich in sulfide minerals containing As, such as arsenopyrite and pyrite, which can be leached into the aquatic ecosystem.10,53-55 Therefore, the origin of As in the surface waters of the IQ is associated with weathering and involves the natural oxidation of minerals, together with anthropic activity leading to discharges of mining wastes into drainages.53,54 The total As values were in agreement with those reported in previous studies on As in surface waters of the Velhas River,5–8,10,55 and were within the range found in other regions of the IQ.3 Flowing water samples collected along the Velhas River by Borba et al.10 in April 1998 contained As, in the soluble fraction, at concentrations between 12 and 160 µg L-1.
When As levels in water are compared to the distribution of arsenic among the different fractions of the sediments at each of the sampling sites, it is possible to observe a correlation between the amounts of arsenic in the oxidizable fraction of the sediments and the As concentration in water samples. Since the in situ measurements of redox potential (Eh) indicate oxidizing conditions, the greater the As concentration present in the oxidizable fraction the higher the As mobilized into the aquatic media.
In the present study, the total concentrations of trace metals in the four water samples (Table 4) were below the limit values for Class 2 watercourses.
The recoveries obtained in the fortification (spike) assays were 98% (As), 93% (Cd), 94% (Co), 88% (Cr), 99% (Cu), 98% (Ni), 104% (Pb) and 103% (Zn). For the concentrations studied, these results were satisfactory, according to the AOAC guidelines (where recoveries of 80-110% are considered acceptable), and indicated that there was no influence of the matrix on the recovery rates and that the elements remained solubilized in the extract.56 The results obtained for the check samples (which were analyzed every 10 readings) showed variation ≤ 1.5%.
CONCLUSIONS
The total concentrations of As, Cd, Co, Cr, Cu, Ni, Pb and Zn in water and sediment and their concentrations in the different fractions of the sediment were measured in samples collected from the Velhas River in the southeastern Iron Quadrangle, Brazil. The results showed concentrations of As in water samples ranging from 78.1 to 85.3 µg L-1, exceeding the maximum limit established in the Brazilian environmental legislation (10 µg L-1). According to water analyses, none of the trace metals studied reached the maximum limit established by the Brazilian Standards.
Analyses of the sediment samples showed large amounts of As and trace metals extracted associated with the residual fraction. Nevertheless, considerable amounts of Zn (71%), Co (56%), Cd (55%), Pb (47%), Ni (29%), Cu (23%), As (20%) and Cr (16%) were extracted as easily remobilizable fractions, wich indicates the potential for remobilization of these elements from sediments
to the aquatic medium. It is also important to considerer that local waterways are used as water destined for human consumption, and the potential risk to human health due to the presence of As and toxic metals in the sediment fractions considered easily remobilizable cannot be ignored.
SUPPLEMENTARY MATERIAL
Supplementary data (Table 1S, Table 2S, Table 3S, Table 4S and Table 5S) are available free of charge at http://quimicanova.sbq.org. br as PDF file.
ACKNOWLEDGEMENT
The authors acknowledge the financial support of the Fundação de Amparo à Pesquisa do Estado de Minas Gerais (FAPEMIG, Universal Demand, process No. APQ-00445-14) and the Conselho Nacional de Desenvolvimento Científico e Tecnológico (CNPq) and CAPES.
REFERÊNCIAS
1. Pereira, J. C.; Guimarães-Silva, A. K.; Nalini, H. A.; Pacheco-Silva, É.; De Lena, J. C.; Quim. Nova2007, 30, 1249.
2. Weber, A. A.; Moreira, D. P.; Melo, R. M. C.; Vieira, A. B. C.; Prado, P. S.; da Silva, M. A. N.; Bazzoli, N.; Rizzo, E.; Sci. Total Environ.2017, 592, 693.
3. Matschullat, J.; Perobelli Borba, R.; Deschamps, E.; Figueiredo, B. R.; Gabrio, T.; Schwenk, M.; Appl. Geochemistry2000, 15, 181.
4. CONAMA – Conselho Nacional do Meio Ambiente. Resolução No. 357. Brasil: Ministério do Desenvolvimento Urbano e Meio Ambiente, Brasília, 2005.
5. Costa, R. de V. F.; Leite, M. G. P.; Mendonça, F. P. C.; Junior, H. A. N.; Geosciences2015, 43.
6. Deschamps, E.; Ciminelli, V. S. T.; Weidler, P. G.; Ramos, A. Y.; Clays Clay Miner.2003, 51, 197.
7. Rezende, P. S.; Costa, L. M.; Windmöller, C. C.; Arch. Environ. Contam. Toxicol.2015, 68, 588.
8. Rezende, P. S.; Moura, P. A. S.; Durão, W. A.; Nascentes, C. C.; Windmöller, C. C.; Costa, L. M.; J. Braz. Chem. Soc.2011, 22, 910. 9. Varejão, E. V. V; Bellato, C. R.; Fontes, M. P. F.; Mello, J. W. V; Environ.
Monit. Assess.2011, 172, 631.
10. Borba, R. P.; Figueiredo, B. R.; Rawlins, B.; Matschullat, J.; Rev. Bras. Geociências2000, 30, 558.
11. CONAMA – Conselho Nacional do Meio Ambiente. Resolução No. 454. Brasil: Ministério do Desenvolvimento Urbano e Meio Ambiente, Brasília, 2012.
12. Yuan, C. G.; Shi, J. B.; He, B.; Liu, J. F.; Liang, L. N.; Jiang, G. B.; Environ. Int.2004, 30, 769.
13. Liu, Q.; Wang, F.; Meng, F.; Jiang, L.; Li, G.; Zhou, R.; Mar. Pollut. Bull.2018, 126, 293.
14. Kang, X.; Song, J.; Yuan, H.; Duan, L.; Li, X.; Li, N.; Liang, X.; Qu, B.; Ecotoxicol. Environ. Saf.2017, 143, 296.
15. Abdallah, M. A. M.; Arab. J. Chem.2017, 10, 68.
16. Fernández-Ondoño, E.; Bacchetta, G.; Lallena, A. M.; Navarro, F. B.; Ortiz, I.; Jiménez, M. N.; J. Geochemical Explor.2017, 172, 133. 17. Hamdoun, H.; Leleyter, L.; Van-Veen, E.; Coggan, J.; Basset, B.;
Lemoine, M.; Baraud, F.; C. R. Geosci.2015, 347, 94.
18. Kovács, K.; Halász, G.; Takács, A.; Heltai, G.; Széles, É.; Győri, Z.; Horváth, M.; Microchem. J.2018, 136, 80.
19. Pérez-Moreno, S. M.; Gázquez, M. J.; Pérez-López, R.; Bolivar, J. P.; Chemosphere2018, 198, 397.
21. Nemati, K.; Bakar, N. K. A.; Abas, M. R.; Sobhanzadeh, E.; J. Hazard. Mater.2011, 192, 402.
22. Nemati, K.; Kartini, N.; Bakar, A.; Sobhanzadeh, E.; Abas, M. R.; Microchem. J.2009, 92, 165.
23. Sungur, A.; Soylak, M.; Ozcan, H.; Chem. Speciat. Bioavailab.2014, 26, 219.
24. Sungur, A.; Soylak, M.; Yilmaz, S.; Özcan, H.; Environ. Earth Sci.2014, 72, 3293.
25. Prohic, E.; Kniewald, G.; Mar. Chem.1987, 22, 279.
26. Tessier, A.; Campbell, P. G. C.; Bisson, M.; Anal. Chem.1979, 51, 844. 27. Ure, A. M.; Quevauviller, P.; Muntau, H.; Griepink, B.; Int. J. Environ.
Anal. Chem.1993, 51, 135.
28. Rauret, G.; López-Sánchez, J. F.; Sahuquillo, A.; Rubio, R.; Davidson, C.; Ure, A.; Quevauviller, P.; J. Environ. Monit.1999, 1, 57.
29. Gleyzes, C.; Tellier, S.; Astruc, M.; TrAC -- Trends Anal. Chem.2002, 21, 451.
30. Shelton, L. R.; Capel, P. D.; Guidelines for collecting and processing samples of stream bed sediments for analysis of trace elements and organic contaminants for the National Water-Quality Assessment Program, USGS, 1994, Open-File Report 94-458.
31. Donagema, G. K.; Campos, D. V. B. de; Calderano, S. B.; Teixeira, W. G.; Viana, J. H. M.; Manual de Métodos de Análise de Solo, 2nd ed., Rio de Janeiro: Embrapa Solos, 2011.
32. Mebius, L. J.; Anal. Chim. Acta1960, 22, 120.
33. Yeomans, J. C.; Brenner, J. M.; Commun. Soil Sci. Plant Anal.1988, 19, 1467.
34. Ruiz, H. A.; Rev. Bras. Cienc. Solo2005, 29, 297.
35. Mihajlovic, J.; Stärk, H.-J.; Rinklebe, J.; Geoderma2014, 228-229, 160. 36. Zemberyová, M.; Barteková, J.; Hagarová, I.; Talanta2006, 70, 973. 37. Passos, E. de A.; Alves, J. C.; dos Santos, I. S.; Alves, J. do P. H.; Garcia,
C. A. B.; Spinola Costa, A. C.; Microchem. J.2010, 96, 50.
38. Junior, R. a M.; Mimura, A. M. S.; Divino, A. C.; Silva, R. F.; Silva, J. C. J.; Ciminelli, V. S. T.; Soil Sediment Contam.2014, 23, 257.
39. Passos, E. D. A.; Alves, J. D. P. H.; Garcia, C. A. B.; Costa, A. C. S.; J. Braz. Chem. Soc.2011, 22, 828.
40. Varejão, E. V. V; Bellato, C. R.; Fontes, M. P. F.; Environ. Monit. Assess. 2009, 157, 125.
41. Canadian Council of Ministers of the Environment, E.; Canadian Environmental Quality Guidelines,Winnipeg, 1999, p. 5.
42. Guillén, M. T.; Delgado, J.; Albanese, S.; Nieto, J. M.; Lima, A.; De Vivo, B.; J. Geochemical Explor.2012, 119–120, 32.
43. Huang, L.; Pu, X.; Pan, J. F.; Wang, B.; Chemosphere2013, 93, 1957. 44. Yang, Y.; Chen, F.; Zhang, L.; Liu, J.; Wu, S.; Kang, M.; Mar. Pollut.
Bull.2012, 64, 1947.
45. Kartal, Ş.; Aydin, Z.; Tokalioǧlu, Ş.; J. Hazard. Mater.2006, 132, 80. 46. Liu, H.; Li, L.; Yin, C.; Shan, B.; J. Environ. Sci. (China)2008, 20, 390. 47. Ahumada, I.; Marican, A.; Retamal, M.; Pedraza, C.; Ascar, L.;
Carrasco, A.; Richter, P.; J. Braz. Chem. Soc.2010, 21, 721.
48. Ianni, C.; Magi, E.; Soggia, F.; Rivaro, P.; Frache, R.; Microchem. J. 2010, 96, 203.
49. Sundaray, S. K.; Nayak, B. B.; Lin, S.; Bhatta, D.; J. Hazard. Mater. 2011, 186, 1837.
50. Wali, A.; Colinet, G.; Ksibi, M.; Environ. Res. Eng. Manage.2015, 70, 14.
51. Shevade, S.; Ford, R. G.; Water Res.2004, 38, 3197.
52. Marques Neto, J. O.; Bellato, C. R.; Milagres, J. L.; Pessoa, K. D.; De Alvarenga, E. S.; J. Braz. Chem. Soc.2013, 24, 121.
53. Borba, R. P.; Figueiredo, B. R.; Cavalcanti, J. A.; Geociências2004, 57, 45.
54. Borba, R. P.; Figueiredo, B. R.; Rev. Bras. Geociências2004, 34, 489. 55. Borba, R. P.; Figueiredo, B. R.; Matschullat, J.; Environ. Geol.2003, 44,
39.
56. González, A. G.; Herrador, M. A.; Asuero, A. G.; Talanta1999, 48, 729.