Article
J. Braz. Chem. Soc., Vol. 22, No. 5, 828-835, 2011. Printed in Brazil - ©2011 Sociedade Brasileira de Química 0103 - 5053 $6.00+0.00
A
*e-mail: [email protected]
Metal Fractionation in Sediments of the Sergipe River, Northeast, Brazil
Elisangela de Andrade Passos,*,a Jose do Patrocínio H. Alves,a
Carlos Alexandre B. Garciaa and Antonio C. Spinola Costab
aDepartamento de Química, Universidade Federal de Sergipe, 49100-000 São Cristóvão-SE, Brazil
bInstituto de Química, Universidade Federal da Bahia, 40170-115 Salvador-BA, Brazil
O procedimento de extração seqüencial proposto pelo European Community Bureau of Reference (BCR) foi empregado para o fracionamento de Cd, Cr, Cu, Ni, Pb e Zn em sedimentos do estuário do Rio Sergipe, Brasil. O método empregado apresentou-se adequado com limite de detecção e desvio padrão aceitável para a determinação de metais em amostras de sedimentos. Cd foi o metal com maior percentagem na fração extraível. Ni e Pb estão presentes principalmente nas frações oxidável e redutível. Cr, Cu e Zn foram encontrados predominantemente na fração residual. A ordem de mobilidade dos metais extraídos foi Pb > Cd > Ni > Cu > Cr > Zn. De acordo com o código de avaliação de risco (RAC), as amostras de sedimentos mostraram risco baixo a médio para todos os metais analisados.
The sequential extraction procedure proposed by the European Community Bureau of Reference (BCR) was applied for the fractionation of Cd, Cr, Cu, Ni, Pb and Zn in sediments from the Sergipe Estuary, Brazil. The method showed satisfactory recoveries, detection limits and standard deviations for trace metals determinations in sediment samples. Cd was the metal with the greatest percentage in the exchangeable fraction. Pb and Ni were present mainly in the reducible and oxidizable fractions. Cr, Cu and Zn were predominantly associated with the residual fraction. The order of mobility of metals extracted was Pb > Cd > Ni > Cu > Cr > Zn. According to the risk assessment code (RAC), the sediments showed low to medium risk for all metals.
Keywords: sequential extraction, trace metals, estuarine sediment, risk assessment code
Introduction
Metals enter the environment by two means: natural processes (including erosion of rocks, volcanic activity and forest ires), and processes derived from human activities involving pollution of the atmosphere, waterways and terrestrial ecosystems. Human activity (settlements and industry) is often concentrated in luvial watersheds and along estuarine margins, so that these areas are therefore important receptors of contaminants.1,2
Trace metals are widely dispersed in the aquatic environment, and ultimately deposit in the sediment, which is therefore of particular interest concerning its metal content.3
Sediments have a high storage capacity for pollutants; in no part of the hydrological system more than 1% of these substances are actually dissolved in the water, while more than 99% are stored in the sediments.4 Aquatic sediments
consist of several different geochemical phases that act as reservoirs of trace metals. These phases include carbonates, sulides, organic matter, iron and manganese oxides, and clays, all of which may occur in a variety of structural forms.5
Determination of the total concentration of a metal in sediment is not a particularly useful indicator of sediment toxicity, as it does not distinguish between the natural and anthropogenic components of the metal. Quantifying the available or labile metals in the sediment provides a better indicator of sediment toxicity.6 Leaching
techniques are widely used for the assessment of heavy metal mobilization.7 Extraction procedures are undertaken
to evaluate the metal availability and bioavailability.8 In
sequential extraction, several selective reagents are used consecutively to extract “operationally deined phases” from the sediment in a set sequence.
Many of these are variants on the scheme proposed by Tessier et al.9 As part of a attempt to harmonize
methodology for leaching/extraction tests throughout the European Community, the BCR (now the Standards, Measurement and Testing Programme) developed a three-stage, sequential extraction protocol,12 in which metals
are divided into acid soluble/exchangeable, reducible and oxidizable fractions.13 The acid soluble/exchangeable
fraction contains the metals that are precipitated or co-precipitated with carbonate, and is affected by pH changes. The reducible fraction contains metals associated with Fe-Mn oxides, which can be dissolved by changes in redox potential. In the oxidizable fraction, metals may be associated, through complexation or bioaccumulation processes, with various forms of organic material such as living organisms, detritus or coatings on mineral particles. In this fraction, metals remain in the sediment for longer periods, but may be mobilized by decomposition processes (under oxidizing conditions).14 The BCR method has proved
to be reproducible, and has given good recoveries when compared to full acid dissolution. Sediment reference materials are available (CRM 601 and 701), that are certiied for metals extractable by the procedure.15
Fractionation is not only very useful for determining the degree of association of the metals in the sediments, and to what extent they may be remobilized into the environment,16
but also for distinguishing those metals with a lithogenic origin from those with an anthropogenic origin. According to Rubio et al.,17 metals with anthropogenic origins are
mainly contained in the earlier extractions, while those from lithogenic sources are present in the residual fraction.
In some studies18-23 the risk assessment code (RAC)
has been used to assess environmental risks and estimate possible damage to benthic organisms caused by contaminated sediments. The RAC considers the percentage fraction of metals that are exchangeable and associated with carbonates. In this fraction, the metals are weakly bound to the sediment, and present a greater environmental risk since they are more available to the aquatic system. The RAC classiication deines risk levels as zero, low, medium, high and very high, depending on the percentage value.21
The present work presents the distributions of the trace metals Cd, Cr, Cu, Ni, Pb and Zn in surface sediments of the Sergipe River (Sergipe State, northeast Brazil), obtained using the optimized three stage BCR extraction procedure of the Standards, Measurements and Testing Programme (SM&T), proposed by the European Community Bureau of Reference. The first three fractions contained the most labile metals and the residual fraction the least bioavailable/mobile metals. The RAC was determined for risk assessment for each metal the environment.
Experimental
Description of the study area
The Sergipe River Basin is located in the State of Sergipe, in the northeast of Brazil, and covers an area of 3673 km2.
The river has an average discharge of 560,000 m3 day-1
in the rainy season and 70,000 m3 day-1 in the dry season.
It lows about 210 km from its source, before reaching the Atlantic Ocean at the city of Aracaju, the State capital.24
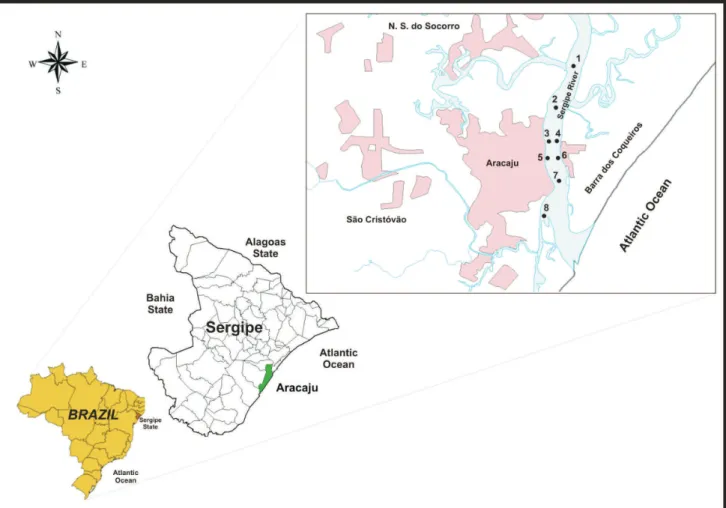
The study area extended over 6 km, covering the lower part of the Sergipe River Estuary, between latitudes 10°52’S and 10°56’S, and longitudes 37°02’W and 37°03’W (Figure S1). Water salinity values varied from 27 to 33, very close to the value of the salinity of sea water (35). The estuary directly receives industrial discharges, dominated by emissions from food, plastic, textile, ceramic and metallurgical industries. Domestic sewage from neighboring cities is also released into the estuary, both in natura and as the efluent from sewage treatment facilities in Aracaju.25 Lately, the estuary has shown hypoxic
conditions and characteristics of an environment in the process of eutrophication.26
Sampling
Surface sediments (5 cm depth) were collected from the intertidal area at eight sites in the Sergipe Estuary (Figure S1), during March 2009. Three samples were taken at each location, using a core sampler composed of cellulose acetate butyrate. Samples were stored in closed plastic vials, and kept in ice until arrival at the laboratory. The sediments were then dried at 60 °C for 72 h (until constant mass was achieved), and homogenized to a ine powder in a porcelain mortar. Then the sediment samples were sieved through a 2 mm sieve. They were then stored in plastic containers until the analyses were performed.
Apparatus
An atomic absorption spectrometer (AA-6800, Shimadzu Co. Ltd., Kyoto, Japan) was used, itted with lame or graphite furnace atomization, D2 background
respectively. Argon gas (1L min-1) was used as the purge
gas except during the atomization step.
An end-over-end mechanical shaker (CT 712 R, CINTEC Co., SP, Brazil) and a centrifuge (T23, Janetzki MLW Co., Wallhausen, Germany) were used for extraction and to separate extractants from residues in the sequential extraction procedure. PTFE vials were used throughout the entire procedure. Additional equipment used was a pH meter (DM 20, Digimed Co., SP, Brazil), a water bath (MA 156, Marconi Co. Ltd., SP, Brazil) and a digester block (TE 007A, Tecnal Co., SP, Brazil).
Reagents
All reagents were analytical grade or Suprapur quality (Merck, Darmstadt, Germany), and ultrapure water (18 MΩ cm) was supplied from a Millipore Milli-Q system. Stock standard solutions, containing 1000 mg L-1 of the
metals (Tritisol, Merck), were prepared from standard vials. Cleaning of plastic and glassware was carried out by soaking in 50% (v/v) HNO3 for 24 h, and then rinsing
with ultrapure water.
Quality control of metal analysis
Calculation of the limits of detection (LOD) for each step of the BCR method was based on the expression 3s/b, where s is the standard deviation of the blank and b is the slope of the calibration graph.27 Ten analytical blanks
were analyzed for each step of the extraction process. Since it is dificult to obtain a blank sediment, the signal obtained using the reagents for each extraction stage was treated as the blank. LOD values took into account the use of 1 g portions of sample in extractions, and any necessary dilutions. Correlation coeficients (r) of the calibration curves were better than 0.998 for all elements studied.
The accuracy of the analytical procedures for metal determinations in each extraction step was checked by analysis of four replicates of certiied sediment reference material (BCR-701 river sediment). The BCR-701 analysis was performed as part of the batch, at the same time as the sample analyses. The measured contents of the elements were compared with the certiied extractable contents of Cd, Cr, Cu, Ni, Pb and Zn.
Sequential extraction procedure
Sequential extraction was performed using the optimized BCR procedure.28 A detailed description of this
procedure is provided below.
Step 1 (exchangeable fraction, water and acid soluble)
40 mL of acetic acid (0.11 mol L-l) was added to 1 g of
dry sediment in a 100 mL PTFE bottle. The bottle was then shaken for 16 h at 22 °C using an end-over-end mechanical shaker at a speed of 125 rpm. The supernatant was separated from the solid residue by centrifugation at 3000 rpm for 20 min, and stored in a clean polyethylene bottle at 4 °C before analysis. The residue was washed by shaking with 20 mL Milli-Q water for 15 min, and then centrifuged. To prevent trace element losses, the washings were not discarded, but were stored with the extracts.
Step 2 (reducing conditions)
A 40 mL volume of hydroxylammonium chloride (0.5 mol L-l, adjusted to pH 1.5 with nitric acid) was added
to the residue from Step 1. The extraction procedure was repeated as described above.
Step 3 (oxidizing conditions)
A 10 mL volume of hydrogen peroxide (8.8 mol L-l) was
added carefully (to avoid losses due to violent reaction with organic matter) to the residue from Step 2. The bottle was capped, and the contents digested at ambient temperature for 1 h with occasional manual shaking. Digestion was continued by heating the bottle at 85 °C in a water bath for 1 h. The cap was removed, and the solution reduced to a small volume (2-3 mL). A second aliquot of 10 mL of hydrogen peroxide was added, and the bottle again capped, heated at 85 °C for 1 h, and the solution reduced to a small volume. A 50 mL volume of ammonium acetate (1 mol L-l, adjusted to pH 2 with nitric acid)
was then added to the cool and moist residue. Separation of the supernatant was conducted as described in the previous steps.
Step 4 (residual fraction)
Step 3 residue was digested using a mixture of the acids HNO3 (4 mL), HCl (2 mL), and HF (4 mL), to determine
the metal content, as described by Alves et al.24
Risk assessment code (RAC)
The RAC considers the different binding strengths of the metals in the various sediment fractions. It assesses the availability of metals in solution by applying a scale to the percentage of metals in the exchangeable and carbonate sediment fractions. This classiication is described by Perin et al.29
Statistical analysis
Results and Discussion
Quality assurance
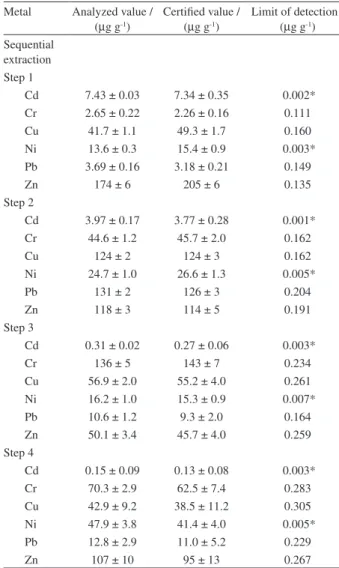
The accuracy of the sequential extraction procedure was assessed by analysis of four replicates of the BCR-701 certiied sediment reference material. The measured contents of the elements were compared with the certiied extractable contents of Cd, Cr, Cu, Ni, Pb and Zn. The results (mean values ± standard deviation, n = 4) of the contents obtained using FAAS and ETAAS are compared with the certiied values in Table 1. Very good agreement was achieved, with no signiicant differences between values at the 95% conidence level. These values relect the eficiency of the method, as well as the precision of the results, and are considered satisfactory given the complex nature of the sediment matrix. Similar values have been reported in the literature.15,30-32
Limits of detection (LOD) were calculated as 3s divided by the slope of the calibration graph, for ten reagent blanks in each fraction (Table 1). The LOD values varied from 0.001 µg g-1 (Cd) to 0.305 µg g-1 (Cu). These detection
limits are considered acceptable for general analysis in environmental studies,15 and are comparable to those
obtained in previous work using similar material.30,31
Evaluation of results
The sequential extraction procedure allowed determination of the distribution of the trace metals between the different geochemical fractions, relecting the relative proportions of each metal transported by different chemical mechanisms. The acid soluble fraction (F1) shows the amount of each element that would be released into the environment if conditions became more acidic. It is the fraction with the most labile bonding to the sediment and, therefore, presents the greatest environmental risk. The reducible fraction (F2) theoretically represents the content of each metal bound to iron and manganese oxides that would be released if the sediment were subjected to more reducing conditions.12 The oxidizable fraction (F3)
relects the amount of metal bound to the organic matter and sulides, which would be released if conditions became oxidizing. Such a change may occur during dredging.11 The
residual fraction (R) contains the metals with the strongest association with the crystalline structures of the minerals, and which are therefore the most dificult to separate from the sediments.8
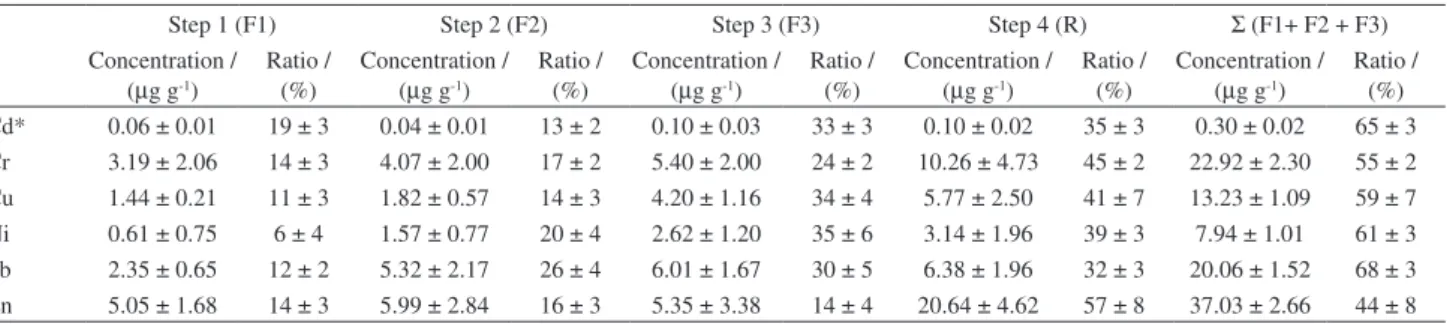
Table 2 provides the extractable average contents of Cd, Cr, Cu, Ni, Pb and Zn, the extracted percentages of the metals with respect to the sums of the 4 fractions, and the contents considering the most labile fractions (ΣF1+F2+F3). The values shown are the means of four independent analyses. The standard deviations of the four replicas range from 1 to 10%, indicating good repeatability.
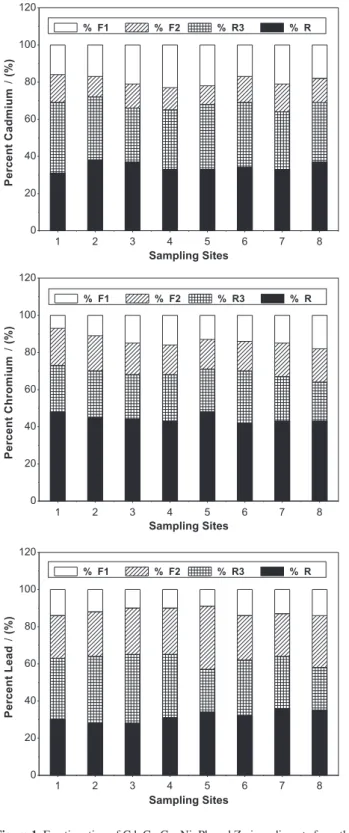
The environmentally mobile (F1) and reducible (F2) fractions were generally the smallest, and the oxidizable (F3) and residual (R) fractions the most signiicant. This can be seen in Figure 1, which illustrates the results as percentages of metal extracted in each fraction, for the eight sediment samples. Each of the equivalent fractions (acid soluble, reducible, oxidizable and residual) is shown with the same type of ill, and the different fractions that have been grouped together in each equivalent fraction are separated by horizontal lines. The metal distribution in the sediment fractions is similar along the estuary. This result indicates that these elements must have similar origin and deposition mechanism.
Table 1. Results of analysis of standard reference material BCR-701 (mean ± standard deviation, n = 4), and detection limits
Metal Analyzed value / (µg g-1)
Certiied value / (µg g-1)
Limit of detection / (µg g-1)
Sequential extraction Step 1
Cd 7.43 ± 0.03 7.34 ± 0.35 0.002* Cr 2.65 ± 0.22 2.26 ± 0.16 0.111 Cu 41.7 ± 1.1 49.3 ± 1.7 0.160 Ni 13.6 ± 0.3 15.4 ± 0.9 0.003* Pb 3.69 ± 0.16 3.18 ± 0.21 0.149
Zn 174 ± 6 205 ± 6 0.135
Step 2
Cd 3.97 ± 0.17 3.77 ± 0.28 0.001* Cr 44.6 ± 1.2 45.7 ± 2.0 0.162
Cu 124 ± 2 124 ± 3 0.162
Ni 24.7 ± 1.0 26.6 ± 1.3 0.005*
Pb 131 ± 2 126 ± 3 0.204
Zn 118 ± 3 114 ± 5 0.191
Step 3
Cd 0.31 ± 0.02 0.27 ± 0.06 0.003*
Cr 136 ± 5 143 ± 7 0.234
Cu 56.9 ± 2.0 55.2 ± 4.0 0.261 Ni 16.2 ± 1.0 15.3 ± 0.9 0.007*
Pb 10.6 ± 1.2 9.3 ± 2.0 0.164
Zn 50.1 ± 3.4 45.7 ± 4.0 0.259 Step 4
Cd 0.15 ± 0.09 0.13 ± 0.08 0.003* Cr 70.3 ± 2.9 62.5 ± 7.4 0.283 Cu 42.9 ± 9.2 38.5 ± 11.2 0.305 Ni 47.9 ± 3.8 41.4 ± 4.0 0.005* Pb 12.8 ± 2.9 11.0 ± 5.2 0.229
Zn 107 ± 10 95 ± 13 0.267
In the sediments from the Sergipe Estuary, Cd was the metal with the greatest percentage in the mobilizable fraction (more than 19% of the total content). In other words, this metal is more available to aquatic life. Other studies have also reported that Cd in sediments is associated with the labile fraction.33-35 The proportion of cadmium
in the second fraction was relatively small (13%), and in the third and fourth fractions was high (33% and 35%, respectively).
In contrast, Zn was found predominantly in the residual fraction (57%), bound in the mineral lattice. Metals in the residual fraction are associated mainly with aluminosilicate minerals, and are therefore unlikely to be released to the aqueous phase. This is consistent with the results reported by other investigators.33,36
Pb and Ni were found mainly in association with the oxidizable (30% and 35%, respectively) and reducible (26% and 20%, respectively) fractions, for which predictions can be made concerning the mobility of metals and their possible release to the wider environment.
Finally, Cr and Cu appeared to be similarly partitioned in the sediments. The residual fraction accounted for high proportions of Cr (up to 45%) and Cu (up to 41%) in sediments from the Sergipe Estuary. Significant contributions of these metals were also found in the acid soluble fraction (14% and 11%, respectively). According to Perez et al.,37 the metals associated with exchangeable
ions and carbonates are extremely important, because they can be easily remobilized by changes in environmental conditions, such as pH or salinity.
Identiication of natural and anthropogenic sources
Fractionation studies are not only very useful for determining the degree of association of metals in sediments, and to what extent they may be remobilized into the environment,16,21 but also for distinguishing
those metals with a lithogenic origin from those with an anthropogenic origin. According to Rubio et al.,17 metals
with an anthropogenic origin are mainly present in the irst three extraction fractions (soluble in acid, associated with Fe and Mn oxides, and associated with organic matter and sulides), while in the last stage of the process the residual fraction is obtained, corresponding to metals with lithogenic origins.
When the percentage of metals extracted in the most labile fractions (sum of F1+F2+F3) is examined, the order of mobility (from most to least bioavailable) was: Pb (68%) > Cd (66%) > Ni (61%) > Cu (59%) > Cr (55%) > Zn (43%) (Table 2). The highest concentrations in the bioavailable fractions were observed for Pb, Cd and Ni, with 30%, 33% and 35% of the total contents in the third fraction, respectively. These results are in agreement with data reported in the literature.34,38-40 The release of
metals under oxidizing conditions can be explained by binding to a mineral fraction, such as sulides, that is unstable under oxidizing conditions. Thus, heavy metals of anthropogenic origin are found predominantly in labile sediment fractions.41,42 Pb, Cd and Ni usually form stable
organic complexes and are bound to sulides.
According to the results, Zn, Cr and Cu, were the least mobilisable metals (57%, 45% and 41% of these metals was in the inert fraction, respectively), while Cd, Ni and Pb are more mobile metals. Similar results for these metals have been reported previously.21,22,31,42 Elevated concentrations
of metals in the residual fraction indicate that sediments are relatively unpolluted, and that the elements derive mainly from lithogenic origins. Anthropogenic metals are predominantly found in the most labile sediment fractions, which are vulnerable to small changes in environmental conditions, such as those caused by human activity. Hence, the signiicant amount of metal present in the most bioavailable fractions is likely to be due to the presence of anthropogenic material. The Sergipe Estuary receives discharges from textile, ceramic and metallurgical industries. In addition, domestic efluents directly enter into the Estuary through drains and channels from Aracaju city. These efluents contribute to the input of metals in the water bodies.
Table 2. Results obtained for average ratio and concentrations of Cd, Cr, Cu, Ni, Pb and Zn in each fraction, and Σ (F1+ F2 + F3), for surface sediments from the Sergipe River Estuary (mean ± standard deviation, n = 8)
Step 1 (F1) Step 2 (F2) Step 3 (F3) Step 4 (R) Σ (F1+ F2 + F3)
Concentration / (µg g-1)
Ratio / (%)
Concentration / (µg g-1)
Ratio / (%)
Concentration / (µg g-1)
Ratio / (%)
Concentration / (µg g-1)
Ratio / (%)
Concentration / (µg g-1)
Ecological risk assessment
The distribution of metals in different phases, using the BCR procedure, offers an indication of their availability, which in turn relects the risk associated with the presence of metals in the aquatic environment.34 The fractions most
inluenced by human activity include the exchangeable
and carbonate-bound fractions, which are considered to be weakly retained and may equilibrate with the aqueous phase, hence becoming more rapidly bioavailable.43 The
risk assessment code gives an indication of the possible risk by applying a scale to the percentage of metals present in the exchangeable and carbonate fractions. Accordingly, if this value is < 1% there is no risk for the aquatic system,
1-10% indicates low risk, 11-30% medium risk, 31-50% high risk, and > 50% very high risk.21,44 This classiication
scheme is presented in Table 3.
The RAC values of metals at the different sites are illustrated in Figure 2. In general, the sediments showed low to medium risk for all metals, with RAC values greater than 11% indicating a substantial risk of metal mobilization from sediments across the entire study region. The code as applied to the present study revealed that 16-23% of Cd, 7-18% of Cr, 8-15% of Cu, 3-13% of Ni, 9-14% of Pb and 9-20% of Zn were present in exchangeable fractions. Cd showed medium risk at most sites, so could readily enter the food chain and pose serious problems to the ecosystem due to its toxicity and availability.45
Ishikawa et al.18 in study of avaliation of the environmental
risk by metal in sediments from lakes formed by the Cambé stream (Brazil) showed low to medium risk for Cu and Pb, and a very high risk for Zn. According to Trujillo-Cardenas
et al.19 metals chemical fractionation in the Lake Chapala
sediments (Mexico) show Cd, Pb, Cr present in exchangeable and carbonate fractions indicating very high risk of pollution for water column due to high potential detachment of metals. Similar results found by Arcega-Cabrera et al.,20
in the mine-impacted Taxco River (México), showed that
bio-available Pb in river bed sediments was greater than 50% in 80% indicating a high potential environmental risk, according to RAC.
In India, similar work undertaken by Jain,21 using
sediments from the Yamuna River, highly polluted by contaminants contained in domestic and industrial efluents, showed that 30% to 50% of Cd and Pb were present in the irst sediment fraction, resulting in a high risk to the environment. Jain et al.22 found that the F1 percentages of
Cu, Ni, Cr, Pb, Cd and Zn in sediments from Nainital lake were lower than 30%, with associated low to medium risks, and similar results for these six metals were obtained using sediments from the Narmada River.23
Conclusions
Sequential extraction procedures permit evaluation of the various chemical forms of metals present in sediments. Here, the BCR fractionation scheme was employed to determine soluble, oxidizable, reducible and residual metal fractions.
The concentrations of six trace metals (Cd, Cr, Cu, Ni, Pb and Zn) were determined in surface sediment samples collected from the Sergipe River Estuary. A signiicant amount of Cd was present in the soluble fraction, Pb and Ni showed important oxidizable and reducible fractions, and substantial amounts of Cr, Cu and Zn were present in the residual fraction.
The sum of the amounts of metals associated with the first three fractions (exchangeable, reducible and oxidizable) was high. Mobility was in the order Pb > Cd > Ni > Cu >Cr > Zn. Pb, Cd and Ni, preferentially associated with the more labile fractions, could be used as indicators for inputs from anthropogenic sources, while Cu, Cr and Zn were associated to a greater extent with the residual fraction, indicative of natural origins.
Risk assessment code evaluation showed low to medium risk to the environment for all metals in most samples. The results suggested that luctuations in pH or salinity could mobilize the metals from sediments to the water column.
All of the sediment samples presented evidence of anthropogenic enrichment, so that metal concentrations were not representative of natural conditions in this estuarine region. Around 30% of the metal content was present in the residual fraction, similar to the proportion found for contaminated regions worldwide.
Supplementary Information
Supplementary information is available free of charge at http://jbcs.sbq.org.br as a PDF ile.
Table 3. Risk assessment codes
RAC Criterion / (%)
No risk < 1
Low risk 1-10
Medium risk 11-30
High risk 31-50
Very high risk > 50
Acknowledgments
The authors gratefully acknowledge Dr. Andrew Allen (University of Birmingham) for his assistance with the English in this manuscript, the Coordenação de Aperfeiçoamento de Pessoal de Nível Superior (CAPES) for a studentship and the Laboratório de Química Analítica Ambiental (LQA) for technical support.
References
1. Clark, R. B.; Marine Pollution, Oxford University Press: Oxford, 2001.
2. Prego, R.; Cobelo-Garcıa, A.; Environ. Pollut. 2003, 121, 425. 3. Gomes, M. V. T.; Costa, A. S.; Garcia, C. A. B.; Passos, E. A.;
Alves, J. P. H.; Quim. Nova2010, 33, 2088.
4. Salomons, W.; Stigliani. W.; Biogeodynamics of Pollutants in Soils and Sediments, Springer-Verlag: Heidelberg, 1995. 5. Gao, X.; Chen, C. T A.; Wang, G.; Xue, Q.; Tang, C.; Chen, S.;
Estuar. Coast. Shelf Sci.2010, 86, 369.
6. Larner, B. L.; Palmer, A. S.; Seen, A. J.; Townsend, A. T.; Anal. Chim. Acta2008, 608, 147.
7. Gleyzes, C.; Tellier, S.; Astruc, M.; TrAC, Trends Anal. Chem.
2002, 21, 451.
8. Kersten, M.; Förstner, U. In Chemical Speciation in the Environment; Ure, A. M; Davidson, C. M., eds.; Blackie Academic and Professional: Glasgow, UK, 1995.
9. Tessier, A.; Campbell, P. G. C.; Bisson, M.; Anal. Chem. 1979,
51, 844.
10. Meguellati, M.; Robbe, D.; Marchandise, P.; Astruc, M. In Proc. Int. Conf. on Heavy Metals in the Environment, Heidelberg CEP Consultants: Edinburgh, 1983, p. 1090.
11. Förstner, U. In Chemical Methods for Assessing Bioavailable Metals in Sludges; Lechsber, R.; Davis, R. A.; Hermitte, P. L., eds.; Elsevier: London, 1985.
12. Rauret, G.; Talanta1998, 46, 449.
13. Davidson, C. M.; Ferreira, P. C. S.; Ure, A. M.; Fresenius J. Anal. Chem. 1999, 363, 446.
14. Filgueiras, A. V.; Lavilla, I.; Bendicho, C.; J. Environ. Monit.
2002, 4, 823.
15. Zemberyova, M.; Bartekova, J.; Hagarova, I.; Talanta2006, 70, 973. 16. Förstner, U.; Ahlf, W.; Calmano, W.; Kersten, M.; Schoer, J.
In Metal Speciation in the Environment(NATO AS1 Series, Ecological Sciences), Broeckaert, J. A. C.; Gicer, S.; Adams, F., eds.; Springer: Berlin, 1990, Vol. 23, pp. 1-41.
17. Rubio, R.; Lopez-Sanchez, J. F.; Rauret, G.; Anales de Quimica
1991, 87, 599.
18. Ishikawa, D. N.; Noale, R. Z.; Ohe, T. H. K.; De Souza, E. B. R.; Scarmínio, I. S.; Barreto, W. J.; Barreto, S. R. G.; Quim. Nova
2009,32, 1744.
19. Trujillo-Cardenas, J. L; Saucedo-Torres, N. P.; del Valle, P. F. Z.; J. Mex. Chem. Soc.2010, 54, 79.
20. Arcega-Cabrera, F.; Armienta, M. A.; Daesslé , L. W.; Castillo-Blum, S. E.; Talavera, O.; Dótor, A.; Appl. Geochem.2009, 24, 162. 21. Jain, C. K.; Water Res.2004, 38, 569.
22. Jain, C. K.; Malik, D. S.; Yadav, R.; Environ. Monit. Assess.
2007, 130, 129.
23. Jain, C. K.; Gupta, H.; Chakrapani, G. J.; Environ. Monit. Assess.
2008, 141, 35.
24. Alves, J. P. H.; Passos, E. A.; Garcia, C. A. B.; J. Braz. Chem. Soc. 2007, 18, 748.
25. Garcia, C. A. B.; Barreto, M. S.; Passos, E. A.; Alves, J. P. H.;
J. Braz. Chem. Soc. 2009, 20, 1334.
26. Passos, E. A.; Barbieri, E.; Garcia, C. A. B.; Alves, J. P. H.; O Mundo da Saúde2005, 29, 226.
27. Miller, J. C.; Miller, J. M.; Statistics for Analytical Chemistry, 3rd ed., Ellis Horwood PTR Prentice Hall: New York, 1993. 28. Sutherland, R.; Tack, F. M. G.; Adv. Environ. Res.2003, 8, 37. 29. Perin, G.; Craboledda, L.; Lucchese, M; Cirillo, R.; Dotta, L.;
Zanette, M. L.; Orio, A. A. In Heavy Metal in the Environment; Lekkas, T. D., ed., CEP Consultants: Edinburg, 1985, vol. 2, p. 454-456.
30. Passos, E. A.; Alves, J. C.; Santos, I. S.; Alves, J. P. H.; Garcia, C. A. B.; Costa, A. C. S.; Microchem. J.2010, 96, 50. 31. Cuang, D. T.; Obbard, J. P.; Appl. Geochem.2006, 21, 1335. 32. Pueyo, M.; Mateu, J.; Rigol, A.; Vidal, M.; López-Sánchez, J.
F.; Rauret, G.; Environ. Pollut. 2008, 152, 330.
33. Sekhar, K. C.; Chary, N. S.; Kamala, C. T.; Raj, D. S. S.; Rao, A. S.; Environ. Pollut.2003, 29, 1001.
34. Pertsemli, E.; Voutsa, D.; J. Hazard. Mater. 2007, 148, 529. 35. Yang, C. X.; Chen, Y. H.; Peng, P.; Li, C.; Chang, X. Y.; Xi, C.
S.; Sci. Total Environ. 2005, 341, 159.
36. Davidson, C. M.; Thomas, R. P.; McVey, J.; Perala, R.; Littlejohn, D.; Ure, A. M.; Anal. Chim. Acta1994, 291, 277. 37. Perez, M.; Usero, J.; Gracia, I.; Cabrera, F.; Toxicol. Environ.
Chem. 1991, 31, 275.
38. Tüzen, M.; Microchem. J.2003, 74, 105.
39. Morillo, J.; Usero, J.; Gracia, I.; Chemosphere2004, 55, 431. 40. Li, R. Y.; Yang, H.; Zhou, Z. G.; Lü, J. J.; Shao, X. H.; Jin, F.;
Pedosphere2007, 17, 265.
41. Pempkowiak, J.; Sikora, A.; Biernacka, E.; Chemosphere1999,
39, 313.
42. Sakan, S.; Grñetiƒ. I.; Worpeviƒ, D.; Environ. Sci. Pollut. Res.
2007, 14, 229.
43. Rath., P.; Panda, U. C.; Bhatta, D.; Sahu, K. C.; J. Hazard. Mater.2009, 163, 632.
44. Singh, K. P.; Mohan, D.; Singh, V. K.; Malik, A.; J. Hydrol.
2005, 312, 14.
45. Arain, M. B.; Kazi, T. G.; Jamali, M. K.; Afridi, H. I.; Jalbani, N.; Sarfraz, R. A.; Baig, J. A.; Kandhro, G. A.; Memon, M. A.;
J. Hazard. Mater. 2008, 160, 235.
Supplementary Information
S
I
J. Braz. Chem. Soc., Vol. 22, No. 5, S1, 2011. Printed in Brazil - ©2011 Sociedade Brasileira de Química 0103 - 5053 $6.00+0.00
*e-mail: [email protected]
Metal Fractionation in the Sediments of Sergipe River, Northeast, Brazil
Elisangela de Andrade Passos,*,a Jose do Patrocínio H. Alves,a
Carlos Alexandre B. Garciaa and Antonio C. Spinola Costab
aDepartamento de Química, Universidade Federal de Sergipe, 49100-000 São Cristóvão-SE, Brazil
bInstituto de Química, Universidade Federal da Bahia, 41000-000 Salvador-BA, Brazil