Article
, Vol. 29, No. 9, 1885-1893, 2018 Printed in Brazil - ©2018 Sociedade Brasileira de Química*e-mail: [email protected]
Application of Factorial Design and Desirability Function to Develop a Single
Analytical Procedure for the Determination of Metals in Different Tissues of
Blue Crab (
Callinectes danae
)
Daniel C. Lima,*,a Wesley N. Guedes,a,b Vinicius C. Costaa,c and Fábio A. C. Amorima
aDepartamento de Ciências Exatas e Tecnológicas, Universidade Estadual de Santa Cruz,
45662-900 Ilhéus-BA, Brazil
bDepartamento de Química Analítica, Instituto de Química,
Universidade Estadual Paulista (Unesp), 14800-060 Araraquara-SP, Brazil
cGrupo de Análise Instrumental Aplicada (GAIA), Departamento de Química,
Universidade Federal de São Carlos (UFSCar), 13565-905 São Carlos-SP, Brazil
In this scientific work, it was developed a single analytical procedure for the sample preparation of different tissues of blue crabs using microwave-assisted digestion for the determination of Cu, Mn, Fe and Zn by fast sequential flame atomic absorption spectrometry (FS FAAS). The limits of quatification were 10.5, 1.6, 8.9 and 19.3 µg g-1 for Cu, Mn, Fe and Zn, respectively. The precision
was estimated in terms of repeatability using the relative standard deviation (RSD, n = 7) 3.4% for Cu; 4.8% (Mn); 4.7% (Fe) and 4.7% (Zn) and accuracy of the procedure was confirmed by analysis of certified reference material (CRM) of oyster tissue (NIST 1566B) with concentration values of 71.3 for Cu, 18.3 for Mn, 202.5 for Fe and 1415 µg g-1 for Zn. The procedure has been
applied for the determination of Cu, Mn, Fe and Zn in several blue crab samples from Cachoeira River estuary, Ilhéus, Bahia, Brazil.
Keywords: factorial design, desirability function, effect of matrix, singles analytical procedure
Introduction
Quantification of metals in different tissues of crustaceans has been receiving great importance, due to the information about the following items: relation to food quality control, indication of the environment where they live and extinction of some crustaceans species.1-4 However, there are three
distinct groups of metals with relation to toxicity for living organisms: the first group is considered of low toxicity, which is considered as micronutrients, but in high concentrations, they are toxic. The elements that belong to this group are: iron, aluminum, cobalt, copper, manganese, molybdenum, selenium, vanadium, zinc and tin. The second group consists of metals with probability of cancer risk: beryllium, chromium and nickel. The third group has a significant toxic character and its members are not included in the previous groups: lead, cadmium, mercury and arsenic. These elements do not have any known physiological function for living organism so far.5-8
However, the determination of the elements of the above-mentioned groups is not always a simple task, and in this context the analytical method flame atomic absorption spectrometry (FAAS) shows itself as an excellent tool of determination mainly for its robustness.9,10 In addition,
this method is consolidated and is widely used worldwide because of its simplicity, adequate sensitivity to determine several micro and macronutrients and have relatively low cost compared to other methods9 such as inductively coupled
plasma optical emission spectrometry (ICP OES) and inductively coupled plasma mass spectrometry (ICP-MS).
The sequence of a development of an analytical procedure is first based on the choice of analytical method for the determination of chemical species, because it will determine the sample treatment. For example, there are several analytical instruments with different manners of sample introduction. In a device with introduction system by nebulization, the solid samples need a digestion step to become an aqueous solution and different matrices may require different treatments because they are different with relation to the amount of protein and lipids. Therefore, the residual solution will have physical and chemical properties, and differentiated aspiration rate by analytical instruments could feature a systematic error.17
The chemometrics is a statistical tool widely used to provide information regarding the concentration of the analytes in different samples, screening factors and mathematical modeling of analytical procedures with decrease of dimensionality to obtain information about interactions, cluster and others, but there are no scientific studies that blend into these chemometrics tools to prepare distinct diagnosis of samples with different matrices seeking a single condition for this purpose.18-22
In this context, this research had as goal the development of a single analytical procedure for the determination of Cu, Mn, Fe and Zn in different tissues of blue crab by fast sequential flame atomic absorption spectrometry (FS FAAS) applying factorial design and desirability function.
Experimental
Instrumentation
A flame atomic absorption spectrometer (Varian model SpectrAA 240FS, Mulgrave, Victoria, Australia) with fast sequential (FS) software equipped with an air-acetylene burner was used for absorbance measurements. Hollow cathode lamps (Varian Instruments, Palo Alto, California, USA) were used as light sources in the respective wavelengths: 324.8 (Cu), 279.5 (Mn), 248.3 (Fe) and 213.9 nm (Zn). Deuterium lamp background correction was also used. The flame composition was the mixture between acetylene (flow rate: 2.0 L min-1) and air (flow rate:
13.5 L min-1). Sample aspiration rate was of 5.0 mL min-1.
A freeze-drying instrument, model L101 LIOTOP (São Carlos, São Paulo, Brazil), was used to lyophilize the samples. A ball mill model 8000 FL SHIMIDT (Spex Sample Prep, Metuchen, USA) was used for reducing the particles size. An analytical balance model BL D105 (Sartorius, Gottiengen, Germany) was used to establish the sample mass. The total digestion of the blue crab samples was carried out with a microwave oven closed-vessel model
MDS 40, Master Sineo equipped with 40 digestion tubes (Shanghai, China).
Reagents and solutions
All reagents were analytical reagent grade and the solutions were prepared using high-purity water that had a resistivity of 18.2 MΩ cm obtained from a Milli-Q Plus water purification system from Millipore (Bedford, MA, USA). Nitric acid (HNO3) (65%, m m-1) and hydrogen peroxide
(H2O2) (30%, m m-1) (Merck, Darmstadt, Germany) were
used in total digestion. The analyte solutions used for external calibration were prepared from 1,000 mg L-1 standard
solutions (Merck, Darmstadt, Germany). All laboratory glassware used were previously immersed in HNO3 solution
(10%, m m-1) for 12 h for decontamination prior to use and
then rinsed several times with deionized water.
Sampling and preliminary treatment of the samples
For the purpose of catching blue crabs in estuarine environment (in situ), it was used a trap with metal rim and a fishing net. A boat was used to move in the area to proceed sampling. The trap was put in seven points of the Cachoeira River estuary where 36 blue crabs were captured, used for optimization of the method, with biometrics range of 88.0 to 117.0 mm. The animals were found between the following coordinates: from (–14.807786, –39.040824) to (–14.808461, –39.026431). In the laboratory, the muscles of the legs and claws were manually removed from the exoskeleton. Exoskeleton was broken with the support of a pistil and the soft tissues removed with the aid of an acrylic spatula. For the removal of the hepatopancreas, the ventral part of the exoskeleton was opened and with the aid of an acrylic spatula the tissue was removed.
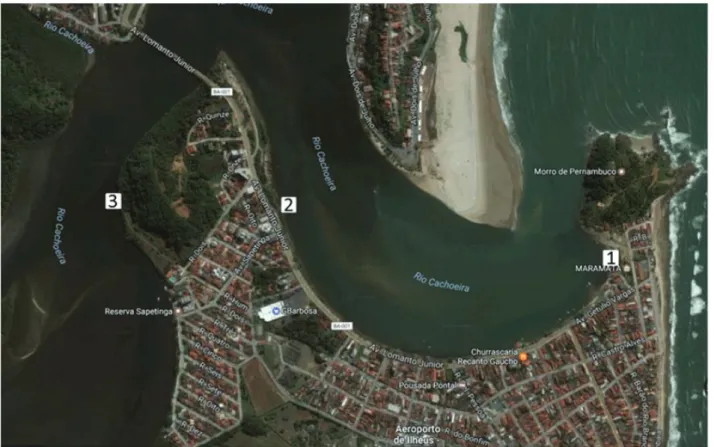
Afterwards, in this process the total masses of each tissue were kept in Petri dishes separately, to be lyophilized. Following lyophilization, the samples were ground in a ball mill to reduce particle size and homogenize the tissues. Then the samples of the three tissues were kept in polypropylene bottles, previously decontaminated, and stored in a desiccator. The procedure developed was applied for the determination of Cu, Mn, Fe and Zn in the tissues of 47 blue crabs captured in three points along the Cachoeira River estuary, Ilhéus City. Figure 1 shows the total area where the sampling was done.
Strategy for the procedure optimization
and hepatopancreas. A full four-level factorial design (24)
was used in order to verify the influence and interactions of the following variables and levels: digestion time (15, 18 and 21 min), digestion temperature (120, 140 and 160 °C), volume of HNO3 (1.0, 2.0 and 3.0 mL) and volume of
H2O2 (1.0, 2.0 and 3.0 mL). The factorial design totalized
19 experiments, including three replicates at the central point. Responses for experimental designs were obtained by evaluating the concentrations of the analytes studies after microwave-assisted digestion. The data analysis was performed using the software Statistica 8.0.23 To allow
simultaneous optimization of the responses obtained, a mathematical approach developed by Derringer and Suich24
was used. It is based on desirability functions applied in optimizing multi-response experiments. The approach first converts each response (yi)into an individual desirability
function (di), which varies within the range 0 ≤ di≤ 1. If the
response is desired, di= 1 and, if the response is outside the
acceptable region, di= 0. The individual desirability (di) is
calculated according to equation 1:
(1)
where Lis the lowest acceptable value for the response, T is the target value and s is the weight (when equal to 1 = linear desirability function). In this work, L values were the lowest concentration in a set of experiments for each element and Tvalues were the highest concentration for each element.
The overall desirability (OD) is calculated according to equation 2:
(2)
where mis the number of response variables.
Sample preparation
Microwave-assisted digestion
Digestion was performed in triplicate according to the following procedure: 200 mg of each sample was accurately weighed in digestion tubes and 1.0 mL of HNO3 (65%, m m-1)
and 1.0 mL of H2O2 (30%, m m-1) were added. The samples
Validation and analytical features of the analytical procedure The limit of detection (LOD) and the limit of quantification (LOQ) were determined according to International Union of Pure and Applied Chemistry (IUPAC) recommendations.25 Precision was estimated as
the relative standard deviation (RSD, percentage). The accuracy of the procedure was confirmed by analysis of the certified reference material (CRM, Gaithersburg, MD, USA), oyster tissue NIST 1566b.
Results and Discussion
Optimization of the procedure
Optimized conditions for acidic digestion, according to the 24 factorial design, were performed to get a single
analytical condition to prepare the samples of the different tissues of blue crabs by microwave-assisted digestion. In order to obtain a single condition to the factors of the digestion of all tissues, OD was used to join the different analytical responses of the different tissues, using a mathematical-statistical tool that is based on the use of a desirability function (D). This function was obtained using
the concentrations of the analytes studies. Initially, it was realized a factorial design for each tissue and obtained an overall desirability in function of the concentrations of Cu, Mn, Fe and Zn. Afterwards the obtainment of OD for each tissue, the same were utilizing to generate a single OD that allowed the utilization of a single step of digestion for all tissues.
After data processing, the evaluation of best conditions for digestion was performed by analysis of Pareto graphic, evaluating the significance of all factors and their interactions at a confidence level of 95%. The magnitude of effects is represented by columns, and the vertical line indicates statistical significance at p = 0.05, so the factors with values that exceed the vertical line are statistically significant at a confidence level of 95%.26 Figure 2 shows
the Pareto graphics for the tissues of claws muscles, legs muscles and hepatopancreas.
Pareto graphic obtained for the claws muscles (Figure 2a) shows that factors and their interactions are not significant inside this experimental domain. They did not influence the analytical response obtained in function of OD. However, the Pareto graphic obtained for legs muscles (Figure 2b) shows that the significant factor are digestion
time and temperature, as well as the interaction between them. On the other hand, the Pareto graphic obtained for the hepatopancreas (Figure 2c) shows that all factors were significant, as well as the interactions between: temperature with time, HNO3 with H2O2, temperature with HNO3 and
time with HNO3.
According to the different profiles of the graphics of Pareto, it was observed that the hepatopancreas is the most complex of the tissues from blue crabs submitted to the procedure of digestion. The hepatopancreas tissue had the highest magnitude of the significant factors and their interaction for the analytical response among tissues, these factors are related to efficiency for the analytical procedure digestion. This can be explained by the fact that hepatopancreas has a high percentage of lipids, fatty acids, proteins and carbohydrates when compared to other tissues, thus making its decomposition more difficult.27,28
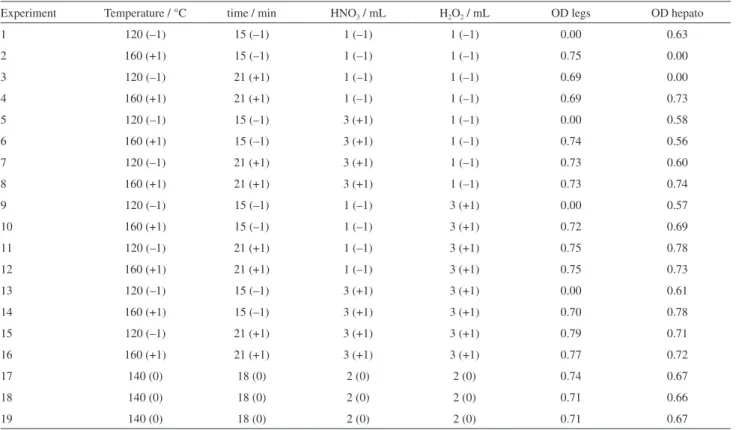
Therefore, the optimization considered only the desirability values (Table 1) of the tissues of the hepatopancreas and of the legs muscles.
The claws muscles tissue was disregarded for the new array of data because all factors and your interactions were not significant for the analytical response. The aim of the new array was to get a trend of a single condition of sample preparation for the different tissues. From the desirability,
it was obtained the OD for each tissue, promoting an ideal and single condition for the three tissues. Figure 3 shows the graph of the desirability function obtained for the tissues of the legs muscles and hepatopancreas with optimized values. The optimized conditions for the microwave-assisted digestion were: temperature of 160 ºC; time of 21 min, 1.0 mL of HNO3 and 1.0 mL of H2O2. As
the volumes of HNO3 and H2O2 in the graphic of predicted
values and desirability remained constant in the range of 1.0 to 3.0 mL, it was opted the use of the minimum value of the experimental domain.
Matrix effect
Physical interference disturbs the phases of introduction of the sample, formation and transport of aerosol, size of drops, desolvation and volatilization, affecting the efficiency of nebulization and significantly the analytical response. This type of interference comes from the physico-chemical characteristics of the matrix of the solution of samples as viscosity, the superficial tension and the tension of steam of the samples and the presence of organic compounds, which are directly related with the matrix of the residual digested.29
In order to check whether the matrix of the samples
Table 1. Experimental matrix with values of OD for the tissues of the legs muscles and hepatopancreas
Experiment Temperature / °C time / min HNO3 / mL H2O2 / mL OD legs OD hepato
1 120 (–1) 15 (–1) 1 (–1) 1 (–1) 0.00 0.63
2 160 (+1) 15 (–1) 1 (–1) 1 (–1) 0.75 0.00
3 120 (–1) 21 (+1) 1 (–1) 1 (–1) 0.69 0.00
4 160 (+1) 21 (+1) 1 (–1) 1 (–1) 0.69 0.73
5 120 (–1) 15 (–1) 3 (+1) 1 (–1) 0.00 0.58
6 160 (+1) 15 (–1) 3 (+1) 1 (–1) 0.74 0.56
7 120 (–1) 21 (+1) 3 (+1) 1 (–1) 0.73 0.60
8 160 (+1) 21 (+1) 3 (+1) 1 (–1) 0.73 0.74
9 120 (–1) 15 (–1) 1 (–1) 3 (+1) 0.00 0.57
10 160 (+1) 15 (–1) 1 (–1) 3 (+1) 0.72 0.69
11 120 (–1) 21 (+1) 1 (–1) 3 (+1) 0.75 0.78
12 160 (+1) 21 (+1) 1 (–1) 3 (+1) 0.75 0.73
13 120 (–1) 15 (–1) 3 (+1) 3 (+1) 0.00 0.61
14 160 (+1) 15 (–1) 3 (+1) 3 (+1) 0.70 0.78
15 120 (–1) 21 (+1) 3 (+1) 3 (+1) 0.79 0.71
16 160 (+1) 21 (+1) 3 (+1) 3 (+1) 0.77 0.72
17 140 (0) 18 (0) 2 (0) 2 (0) 0.74 0.67
18 140 (0) 18 (0) 2 (0) 2 (0) 0.71 0.66
19 140 (0) 18 (0) 2 (0) 2 (0) 0.71 0.67
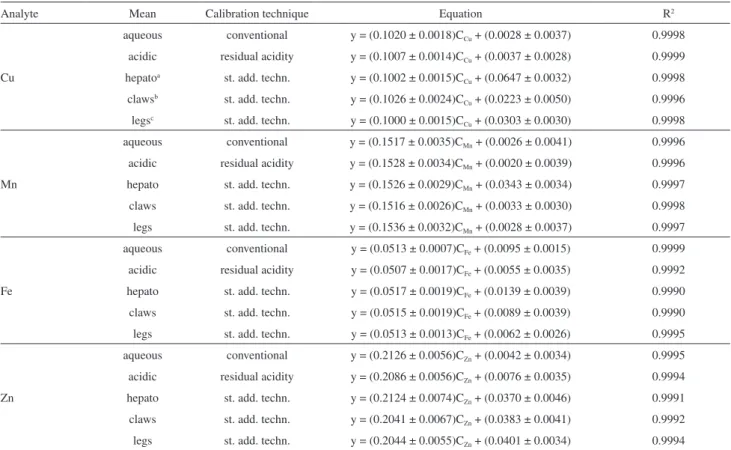
interferes in determination of analyte, the aqueous calibration techniques, standard addition technique and calibration residual acidity were evaluated by statistics using analysis of variance (ANOVA) with significant difference at a 95% confidence level. Equations of the curve of calibration for the different conditions for each analyte and tissues are shown in Table 2.
Afterwards, the slopes of the curves were plotted applying, when appropriate, the hypothesis test (α = 0.05).30 To evaluate the significant difference between the values of the angular coefficients of standard addition technique, significance tests (α = 0.05) were applied. From those results, the matrix effect was analyzed for all calibration techniques. Considering the statistic test, it can report that there is no significant difference (α = 0.05) between the analytical curves in the media studied, thus demonstrating that the matrix does not affect the determination of the elements and the calibration can be performed by any calibration techniques. Because of the simplicity, aqueous calibration method was used for the determination of analytes. For determination of the Zn, the digests of all tissues needed to be diluted in the
factor of 50 times to stay in the calibration linear range of analytical method, FS FAAS.
Validation of the analytical procedure and analytical features
The LOD and LOQ were calculated as the concentration of the analyte corresponding to three and ten times, respectively, the standard deviation of ten independent measurements of the analytical blank divided by the slope of the calibration curve. For the proposed procedure, LODs were: 3.2 for Cu; 0.5 for Mn; 2.7 for Fe and 5.8 µg g-1 for
Zn, and LOQs were: 10.5 for Cu; 1.6 for Mn; 8.9 for Fe and 19.3 µg g-1 for Zn, and the precision, expressed in terms
of repeatability using the relative standard deviation (RSD in percentage) for 7 digestions of the same sample with concentration of Cu (51.2 µg g-1), Mn (108.2 µg g-1), Fe
(245.2 µg g-1) and Zn (92.1 µg g-1), was 3.4, 4.8, 4.7 and
4.7%, respectively.
evaluation using the expanded uncertainty proved that there is no significant difference in the level of 95% of confidence between the values obtained with the proposed procedure and the reference values.
Application
The proposed procedure was applied in determination of Cu, Mn, Fe and Zn in the tissues samples of 47 blue crabs captured in three points around the Cachoeira River estuary (Figure 1), in Ilhéus City, Bahia, Brazil. The coordinates of the location of sampling points were obtained from the
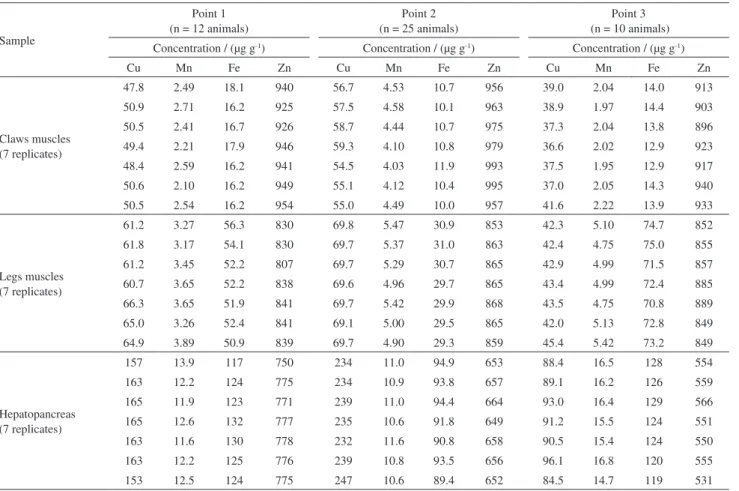
Global Positioning System (GPS). At point 1 (–14.811308, –39.028705) 12 animals with biometrics between 7.8-11.0 cm were captured, at point 2 (–14.807113, –39.036143) 25 animals with biometrics between 8.1-13.1 cm were captured and at point 3 (–14.807010, –39.041157) 10 animals with biometrics between 7.6-10.8 cm were captured. The tissues of the animals were divided into claws muscles, legs muscles and hepatopancreas. After this process, these tissues were lyophilized and homogenized with balls mill, obtaining three batches of mass of each one of the tissues. This process was repeated for each one of the 3 sampling points. Then, seven replicates with mass of 0.2000 g were withdrawn from each batch to perform the total digestion in microwave oven. The Cu, Mn, Fe and Zn concentrations were determined by FS FAAS and the values are shown in Table 4.
Other works found in literature already reported the determination of Cu, Mn, Fe and Zn in muscles and hepatopancreas of blue crabs. Türkmen et al.,31 at the
Northern Skenderun Bay, East Mediterranean, determined the concentrations of Cu, Mn, Fe and Zn in the muscles
of C. sapidus. The concentrations of Cu and Mn were
similar to present study, but the concentration of Fe was higher than the Zn. Similar result was reported in the work Table 2. Equations of the calibration curves obtained in aqueous, residual acidity and standard addition technique for the determination of Cu, Mn, Fe and Zn in tissues samples
Analyte Mean Calibration technique Equation R2
Cu
aqueous conventional y = (0.1020 ± 0.0018)CCu + (0.0028 ± 0.0037) 0.9998
acidic residual acidity y = (0.1007 ± 0.0014)CCu + (0.0037 ± 0.0028) 0.9999
hepatoa st. add. techn. y = (0.1002 ± 0.0015)C
Cu + (0.0647 ± 0.0032) 0.9998
clawsb st. add. techn. y = (0.1026 ± 0.0024)C
Cu + (0.0223 ± 0.0050) 0.9996
legsc st. add. techn. y = (0.1000 ± 0.0015)C
Cu + (0.0303 ± 0.0030) 0.9998
Mn
aqueous conventional y = (0.1517 ± 0.0035)CMn + (0.0026 ± 0.0041) 0.9996
acidic residual acidity y = (0.1528 ± 0.0034)CMn + (0.0020 ± 0.0039) 0.9996
hepato st. add. techn. y = (0.1526 ± 0.0029)CMn + (0.0343 ± 0.0034) 0.9997
claws st. add. techn. y = (0.1516 ± 0.0026)CMn + (0.0033 ± 0.0030) 0.9998
legs st. add. techn. y = (0.1536 ± 0.0032)CMn + (0.0028 ± 0.0037) 0.9997
Fe
aqueous conventional y = (0.0513 ± 0.0007)CFe + (0.0095 ± 0.0015) 0.9999
acidic residual acidity y = (0.0507 ± 0.0017)CFe + (0.0055 ± 0.0035) 0.9992
hepato st. add. techn. y = (0.0517 ± 0.0019)CFe + (0.0139 ± 0.0039) 0.9990
claws st. add. techn. y = (0.0515 ± 0.0019)CFe + (0.0089 ± 0.0039) 0.9990
legs st. add. techn. y = (0.0513 ± 0.0013)CFe + (0.0062 ± 0.0026) 0.9995
Zn
aqueous conventional y = (0.2126 ± 0.0056)CZn + (0.0042 ± 0.0034) 0.9995
acidic residual acidity y = (0.2086 ± 0.0056)CZn + (0.0076 ± 0.0035) 0.9994
hepato st. add. techn. y = (0.2124 ± 0.0074)CZn + (0.0370 ± 0.0046) 0.9991
claws st. add. techn. y = (0.2041 ± 0.0067)CZn + (0.0383 ± 0.0041) 0.9992
legs st. add. techn. y = (0.2044 ± 0.0055)CZn + (0.0401 ± 0.0034) 0.9994
aHepato: hepatopancreas; bclaws muscles; clegs: legs muscles; R2: coefficient of determination; st. add. techn.: standard addition technique.
Table 3. Comparison of the value obtained through the proposed procedure with the certified value for CRM oyster tissue NIST 1566B (average ± confidence interval, n = 3)
Analyte
Concentration / (µg g-1) Test CRM
(expanded uncertainty) Certified value Proposed procedure
Cu 71.6 ± 1.6 71.3 ± 2.3 0.3 ≤ 2.89
Mn 18.5 ± 0.2 18.3 ± 0.9 0.2 ≤ 1.13
Fe 205.8 ± 6.8 202.5 ± 2.5 1.4 ≤ 5.19
Zn 1424 ± 46 1415 ± 36 9.0 ≤ 51.04
of Mutlu et al.32 for the concentrations of Cu, Mn, Fe and
Zn in muscles of C.sapidus at Mediterranean Lagoons, Turkey, finding the concentration of Fe higher than the concentration of Zn. These results differ from the present study, which found the concentration of Zn higher than the concentrations of Cu, Mn and Fe in the claws muscles, legs muscles and in the hepatopancreas, which is in agreement with several authors.
In the work of Bordon et al.,33 it was determined
the concentrations of Cu, Mn, Fe and Zn in muscles of
C. danae in Santos Estuarine System, São Paulo State,
Brazil. In this study, the concetrations of Zn were higher than the concentrations of Cu, Mn and Fe. In another study of Bordon et al.,34 the concentrations of Fe and Zn
in muscles and hepatopancreas were determined and also it was obtained higher concentrations of Zn compared to the concentrations of Fe. Andrade et al.35 also determined Cu,
Fe and Zn in C.ornatus in Lagoa de Iquiparí, RJ, Brazil, being the values of concentrations of Zn higher than the concentrations of Cu and Fe.
Recent works also show uniformity with the present study. Lavradas et al.3 determined the concentrations of
Cu and Zn in muscles and hepatopancreas of C.sapidus
in Ilha Grande Bay, Rio de Janeiro, Brazil and obtained concentrations of Zn higher than the concentrations of Fe, as well as the work of Genç and Yilmaz36 that determined
Cu, Mn, Fe and Zn in the muscles and hepatopancreas of
C.sapidus in the estuary of Koycegiz Lake, South-West,
Turkey, obtaining concentrations of Zn higher than the concentrations of Cu, Mn and Fe, corroborating with the results found in the present study.
Conclusions
Multivariate optimization using the full-four level factorial design (24) and desirability function, made it
possible to obtain a single condition (instrumental and chemical) that enabled the simultaneous microwave-assisted decomposition for the three crab tissues and hepatopancreas samples as the most complex matrix among the evaluated tissues. The optimized conditions for the microwave-assisted digestion were: temperature of 160 ºC, time of 21 min, 1.0 mL of HNO3 and 1.0 mL of H2O2.
Main advantage of this analytical procedure was getting a single procedure to decompose three tissues (claws muscle, legs muscle and hepatopancreas) of blue crabs Table 4. Concentration range for Cu, Fe, Mn and Zn, in the three studied blue crab tissues, in the respective sampling points
Sample
Point 1 (n = 12 animals)
Point 2 (n = 25 animals)
Point 3 (n = 10 animals) Concentration / (µg g-1) Concentration / (µg g-1) Concentration / (µg g-1)
Cu Mn Fe Zn Cu Mn Fe Zn Cu Mn Fe Zn
Claws muscles (7 replicates)
47.8 2.49 18.1 940 56.7 4.53 10.7 956 39.0 2.04 14.0 913
50.9 2.71 16.2 925 57.5 4.58 10.1 963 38.9 1.97 14.4 903
50.5 2.41 16.7 926 58.7 4.44 10.7 975 37.3 2.04 13.8 896
49.4 2.21 17.9 946 59.3 4.10 10.8 979 36.6 2.02 12.9 923
48.4 2.59 16.2 941 54.5 4.03 11.9 993 37.5 1.95 12.9 917
50.6 2.10 16.2 949 55.1 4.12 10.4 995 37.0 2.05 14.3 940
50.5 2.54 16.2 954 55.0 4.49 10.0 957 41.6 2.22 13.9 933
Legs muscles (7 replicates)
61.2 3.27 56.3 830 69.8 5.47 30.9 853 42.3 5.10 74.7 852
61.8 3.17 54.1 830 69.7 5.37 31.0 863 42.4 4.75 75.0 855
61.2 3.45 52.2 807 69.7 5.29 30.7 865 42.9 4.99 71.5 857
60.7 3.65 52.2 838 69.6 4.96 29.7 865 43.4 4.99 72.4 885
66.3 3.65 51.9 841 69.7 5.42 29.9 868 43.5 4.75 70.8 889
65.0 3.26 52.4 841 69.1 5.00 29.5 865 42.0 5.13 72.8 849
64.9 3.89 50.9 839 69.7 4.90 29.3 859 45.4 5.42 73.2 849
Hepatopancreas (7 replicates)
157 13.9 117 750 234 11.0 94.9 653 88.4 16.5 128 554
163 12.2 124 775 234 10.9 93.8 657 89.1 16.2 126 559
165 11.9 123 771 239 11.0 94.4 664 93.0 16.4 129 566
165 12.6 132 777 235 10.6 91.8 649 91.2 15.5 124 551
163 11.6 130 778 232 11.6 90.8 658 90.5 15.4 124 550
163 12.2 125 776 239 10.8 93.5 656 96.1 16.8 120 555
being a complex study to determine chemistry species in different samples with difference among physical and chemistry features. These results confirm the great feasibility of applying this procedure for the determination of Cu, Mn, Fe and Zn in blue crabs captured around the Cachoeira River estuary, which may cover other studies in different science areas.
Acknowledgments
Authors acknowledge the financial support of Fundação de Amparo à Pesquisa do Estado da Bahia (FAPESB, PET0025/2012), Conselho Nacional de Desenvolvimento Científico e Tecnológico (CNPq), Coordenação de Aperfeiçoamento de Pessoal de Nível Superior (CAPES), Financiadora de Estudos e Projetos (FINEP) and Santa Cruz State University (UESC, 0220.1100.899).
References
1. Zhou, Q.; Zhang, J.; Fu, J.; Shi, J.; Jiang, G.; Anal. Chim. Acta 2008, 606, 135.
2. Cherkashin, S. A.; Blinova, N. K.; Hydrobiol. J. 2008, 44, 89. 3. Lavradas, R. T.; Hauser-Davis, R. A.; Lavandier, R. C.; Rocha,
R. C. C.; Saint’Pierre, T. D.; Seixas, S.; Kehrig, H. A.; Moreira, I.; Ecotoxicol. Environ. Saf. 2014, 107, 55.
4. Adams, D. H.; Engel, M. E.; Ecotoxicol. Environ. Saf. 2014, 102, 196.
5. Yedjou, G. C.; Tchounwou, P. B.; Int. J. Environ. Res. 2008, 4, 132.
6. Tchounwou, P. B.; Ishaque, A.; Schneider, J.; Mol. Cell. Biochem. 2001, 222, 21.
7. Sutton, D.; Tchounwou, P. B.; Ninashvili, N.; Shen, E.; Int. J. Environ. Res. 2002, 3, 965.
8. Tchounwou, P. B.; Centeno, J. A.; Patlolla, A. K.; Mol. Cell. Biochem. 2004, 255, 47.
9. Amorim, F. A. C.; Lobo, I. P.; Santos, V. L. C. S.; Ferreira, S. L. C.; Quim. Nova 2008, 31,1784.
10. Amorim, F. A. C.; Costa, V. C.; Guedes, W. N.; Sá, I. P.; Santos, M. C.; Silva, E. G. P.; Castro, D. C.; Food Anal. Methods 2016, 9, 1719.
11. Santos, W. P. C.; Hatje, V.; Santil, D. S.; Fernandes, A. P.; Korn, M. G. A.; Souza, M. M.; Microchem. J. 2010, 95, 169. 12. Raposo, J. C.; Villanueva, U.; Bartolomé, L.; Olivares, M.;
Carrero, J. A.; Sarmiento, A.; Etxebarria, N.; Madariaga, J. M.; Microchem. J. 2011, 99, 252.
13. Weber, P.; Behr, E. R.; Knorr, C. L.; Vendruscolo, D. S.; Flores, E. M. M.; Dressler, V. L.; Baldisserotto, B.; Microchem. J. 2013, 106, 61.
14. Schenone, N. F.; Avigliano, E.; Goessler, W.; Cirelli, A. F.; Microchem. J. 2014, 112, 127.
15. Macedo, G. R.; Tarantino, T. B.; Barbosa, I. S.; Pires, T. T.; Rostan, G.; Goldberg, D. W.; Pinto, L. F. B.; Korn, M. G. A.; Franke, C. R.; Mar. Pollut. Bull. 2015, 94, 284.
16. Ferreira, K. S.; Ferreira, W. A.; Gomes, J. M. M.; Correa-Júnior, J. D.; Donnici, C. L.; Silva, J. B. B.; Microchem. J. 2016, 124, 350. 17. Korn, M. G. A.; Morte, E. S. B.; Santos, D. C. M. B.; Castro, J. T.; Barbosa, J. T. P.; Teixeira, A. P.; Fernandes, A. P.; Welz, B.; Santos, W. P. C.; Santos, E. B. G. N.; Korn, M.; Appl. Spectrosc. Rev. 2008, 43, 67.
18. Ferreira, S. L. C.; Korn, M. G. A.; Ferreira, H. S.; Silva, E. G. P.; Araujo, R. G. O.; Souza, A. S.; Macedo, S. M.; Lima, D. C.; Jesus, R. M.; Amorim, F. A. C.; Sendra, J. M. B.; Appl. Spectrosc. Rev. 2007, 42, 475.
19. Santos, W. P. C.; Castro, J. T.; Bezerra, M. A.; Fernandes, A. P.; Ferreira, S. L. C.; Korn, M. G. A.; Microchem. J. 2009, 91, 153. 20. Leardi, R.; Anal. Chim. Acta 2009, 652, 161.
21. Amorim, F. A. C.; Costa, V. C.; Silva, E. G. P.; Castro, D. L.; Jesus, R. M.; Bezerra, M. A.; Food Chem. 2017, 227, 41. 22. Bezerra, M. A.; Santos, Q. O.; Santos, A. G.; Novaes, C. G.;
Ferreira, S. L. C.; Souza, V. S.; Microchem. J. 2016, 124, 45. 23. Statistica 8.0, Statsoft, Tulsa, USA, 2007.
24. Derringer, G.; Suich, R.; J. Qual. Technol. 1980, 12, 214. 25. Thompson, M.; Ellison, S. L. R.; Wood, R.; Pure Appl. Chem.
2002, 74, 835.
26. Costa, S. S. L.; Pereira, A. C. L.; Passos, E. A.; Alves, J. P. H.; Garcia, C. A. B.; Araujo, R. G. O.; Talanta 2013, 108, 157. 27. Freire, C. A.; Togni, V. G.; Hermes-Lima, M.; Comp. Biochem.
Physiol., Part A: Mol. Integr. Physiol. 2011, 160, 291. 28. Latyshev, N. A.; Kasyanov, S. P.; Kharlamenko, V. I.; Svetashev,
V. I.; Food Chem. 2009, 116,657.
29. Welz, B.; Sperling, M.; Atomic Absorption Spectrometry, 3rd ed.;
Wiley-VCH: Weinheim, Germany, 1999.
30. Miller, J. N.; Miller, J. C.; Statistics and Chemometrics for Analytical Chemistry, 6th ed.; Pearson: Harlow, UK, 2010,
p. 297.
31. Türkmen, A.; Türkmen, M.; Tepe, Y.; Mazlum, Y.; Oymael, S.; Bull. Environ. Contam. Toxicol. 2006, 77, 186.
32. Mutlu, C.; Türkmen, M.; Türkmen, A.; Tepe, Y.; Bull. Environ. Contam. Toxicol. 2011, 87, 282.
33. Bordon, I. C. A. C.; Sarkis, J. E. S.; Tomás, A. R. G.; Scalco, A.; Lima, M.; Hortellani, M. A.; Andrade, N. P.; Bull. Environ. Contam. Toxicol. 2012, 89, 484.
34. Bordon, I. C. A. C.; Sarkis, J. E. S.; Tomás, A. R. G.; Souza, M. R.; Scalco, A.; Lima, M.; Hortellani, M. A.; Bull. Environ. Contam. Toxicol. 2012, 88, 577.
35. Andrade, S. F.; Matos, T. B.; de Carvalho, C. E. V.; Rev. Virtual Quim. 2011, 3, 129.
36. Genç, T. O.; Yilmaz, F.; Indian J. Anim. Sci. 2015, 85, 94.
Submitted: August 30, 2017
Published online: March 27, 2018