A Relational Learning Approach to Structure-Activity
Relationships in Drug Design Toxicity Studies
Rui Camacho1*, Max Pereira1, V´ıtor Santos Costa2,3, Nuno A. Fonseca2, Carlos
Adriano1, Carlos J. V. Sim ˜oes4,5, Rui M. M. Brito4,5
1LIAAD-INESC Porto LA & DEI, FEUP, Universidade do Porto, Portugal,
http://www.liaad.up.pt/
2CRACS-INESC Porto, Portugal, http://cracs.fc.up.pt/
3DCC/FCUP Universidade do Porto, Portugal, http://www.dcc.fc.up.pt/
4Center for Neuroscience and Cell Biology (CNC), University of Coimbra, Portugal,
http://www.cnbc.pt/
5Chemistry Department, University of Coimbra, Portugal,
http://www.uc.pt/fctuc/dquimica/
Summary
It has been recognized that the development of new therapeutic drugs is a complex and expensive process. A large number of factors affect the activity in vivo of putative candidate molecules and the propensity for causing adverse and toxic effects is recognized as one of the major hurdles behind the current ”target-rich, lead-poor” scenario.
Structure-Activity Relationship (SAR) studies, using relational Machine Learning (ML) algorithms, have already been shown to be very useful in the complex process of rational drug design. Despite the ML successes, human expertise is still of the utmost importance in the drug development process. An iterative process and tight integration between the models developed by ML algorithms and the know-how of medicinal chemistry experts would be a very useful symbiotic approach. In this paper we describe a software tool that achieves that goal – iLogCHEM. The tool allows the use of Relational Learners in the task of identifying molecules or molecular fragments with potential to produce toxic effects, and thus help in stream-lining drug design in silico. It also allows the expert to guide the search for useful molecules without the need to know the details of the algorithms used. The models produced by the algorithms may be visualized using a graphical interface, that is of common use amongst researchers in structural biology and medicinal chemistry. The graphical interface enables the expert to provide feedback to the learning system. The developed tool has also facilities to handle the similarity bias typical of large chemical databases. For that purpose the user can filter out similar compounds when assembling a data set. Additionally, we propose ways of providing background knowledge for Relational Learners using the results of Graph Mining algorithms.
*To whom correspondence should be addressed. Email: [email protected]
Copyright 2011 The Author(s). Published by Journal of Integrative Bioinformatics. This article is licensed under a Creative Commons Attribution-NonCommercial-NoDerivs 3.0 Unported License (http://creativecommons.org/licenses/by-nc-nd/3.0/).
1
Introduction
The amount of information concerning chemical compounds available in databases has been increasing at a considerable pace in the last years, changing the whole process of discovery and development of new drugs. Drug databases have been used as a starting point for screening candidate molecules, enabling the pharmaceutical industry to produce over 100,000 new com-pounds per year [1]. Promising comcom-pounds are further analyzed in the development process, where, among other studies, their potential toxicity is assessed. This is a complex and costly process that often requires years before the compounds can be tested in human subjects [2]. Additionally, about 90% of the initial drug candidates fail to reach the market due to their tox-icological properties [3]. This fact highlights the importance of determining potentially toxic features as early as possible in the development process.
Toxicity tests determine whether or not a candidate molecule is likely to produce toxic ef-fects in humans, and usually involve the use of animal models at a pre-clinical stage. As the number of biological targets increases, and hence the demand for drug screening campaigns, there is a growing need for efficient in silico methods to predict the toxicity of chemical com-pounds. This problem of estimating the toxicity of drugs has been addressed through three major approaches: i) regression from physico-chemical properties; ii) hand-built expert sys-tems and; iii) machine learning [4, 5]. Toxicity prediction programs commercially available in-clude TOPKAT (toxicity-prediction by computer-assisted technology), DEREK [6] (deductive estimation of risk from existing knowledge), CSGenoTox, MetaDrug and HazardExpert [7]. These programs have a common characteristic: they are classified as ”global” models [8] since they were developed using a non-congeneric set of chemicals. In fact, it is not mandatory that the chemicals in these data sets are congeneric, but they should share structural features. Be-sides these commercially available programs, other studies have been published using machine learning [9, 10, 4, 11, 5].
There is a large body of work on using Machine Learning and more precisely multi-relational learning in the form of Inductive Logic Programming (ILP) to discover models of drug activity. These studies assume that the set of compounds is divided into two subsets: active and inactive. The task is to obtain rules that differentiate the active versus the inactive compounds. The following information is most often available for these compounds:
• two-dimensional (2D) structural information (i.e., atoms and bonds in the compound); • physico-chemical properties such as molecular weight, lipophilicity and several other
chemical properties of interest.
ILP learners can cope well with the complex nature of chemical compounds. Moreover, they guarantee interpretability: the models are concise and can be presented in a way that are easily understandable by chemists.
In this study we investigate the impact of compound similarity (herein referred as drug homol-ogy) in the construction of predictive models to assess the toxicity of small molecules. More precisely, we aim at addressing the following hypothesis:
H0: Drug homology within the data sets has a significant impact on the performance of learn-ing systems. Copyright 2011 The Author(s). Published by Journal of Integrative Bioinformatics. This article is licensed under a Creative Commons Attribution-NonCommercial-NoDerivs 3.0 Unported License (http://creativecommons.org/licenses/by-nc-nd/3.0/).
Our study is motivated by the observation that most previous works assume that entries in a database are independent and identically distributed (i.i.d.). In practice, most compounds are notobtained independently. Often, one compound in the data base is obtained by incremental chemical modification of a similar compound, known to the chemist. Arguably, this raises the question of whether reported results are reliable and will hold up for novel drugs. On the other hand, it is critical to notice that two similar compounds may in fact have quite different chemical properties. This suggests that it may be worthwhile to consider different compounds even if they are mostly similar.
In order to prove/disprove H0, first we must be able to measure drug similarity. To this end we apply a measure commonly used in the Computational Chemistry community, the Tanimoto index/coefficient between two molecules. As a second step, we identify separate clusters of similar molecules and find representatives, a process that we call filtering. Finally, we perform the learning of the models using relational learners to construct comprehensible models, that may be valuable to bring insights into the workings of toxicity We have used the combination of two Relational Learners techniques: Graph Mining (GM); and Inductive Logic Programming (ILP).
The learning with ILP was made using a software tool, iLogCHEM 1, that is described hereby and allows the expert to guide the search for useful molecules without the need to know the detail of the algorithms used. The models produced by the algorithms may be visualized by the experts and an easy graphical interface enables the expert to provide feedback to the learn-ing system. The evaluation was performed on three data sets available from the Distributed Structure-Searchable Toxicity (DSSTox) Public DataBase Network [12].
2
A tool for interactive drug design
We based our work in iLogCHEM, an interactive tool for chemo-informatics. This system is designed to allow search and manipulation of drug patterns. The input is given as a standard formatted description of the molecules. The output is provided visually, or as text files in standard chemical file formats.
iLogCHEM is very well suited to our problem because it provides a natural vehicle for com-bining structural and property information within a single framework. This is possible because iLogCHEMrepresents molecules as a set of Prolog facts. In the original implementation [13], Prolog facts describe atoms in the molecule, or bonds between atoms. In more recent imple-mentations, facts may also describe global properties of a compound, or may even describe properties of a number of atoms in the molecule. The iLogCHEM representation is therefore very powerful, and fits our stated goal of combining propositional and relational information. Notice, on the other hand, that it is less compact than the SMILES [14] based representation applied in other tools, such as MOLFEA [15] and SMIREP [16].
At its core, iLogCHEM relies on Inductive Logic Programming (ILP) to find the most inter-esting patterns. More precisely, iLogCHEM ’s input will include a set of active and inactive molecules. In its standard mode of use, the system tries to generate the set of smallest patterns that are characteristic of active molecules. Patterns are generated incrementally. iLogCHEM
1Available at http://code.google.com/p/logchem/ Copyright 2011 The Author(s). Published by Journal of Integrative Bioinformatics. This article is licensed under a Creative Commons Attribution-NonCommercial-NoDerivs 3.0 Unported License (http://creativecommons.org/licenses/by-nc-nd/3.0/).
starts from the empty pattern and grows this pattern by adding either bonds or molecular prop-erties until the best pattern is found.
Interaction with the system proceeds through a graphical user interface. The system currently asks users for files in SDF format, that naturally includes atom and bond data on a set of molecules, but also allows inclusion of drug attributes. This file may label the compounds as active or inactive, or a second file may provide the labels. SDF is a very popular format, and particularly useful to us as it is a vehicle for propositional information known to be relevant to drug activity, and it can also convey 3D structure to be visualized by the system’s visualizer. Formats such as SML can be easily translated into SDF through tools such as OpenBabel [17]. The advantages of SDF make it a natural data set distribution format for a variety of purposes. One example is the DSSTox collection of toxicity data sets with approximately 2000 molecules, including 2D and 3D information. A second example is the DTP AIDS data base [18], also available from the NIH.
Given a SDF file, the first step is to pre-compute an user-defined set of attributes. One can select from a predefined set of 22 1D descriptors, 300 molecular fingerprints, and 242 2D descriptors. The selected descriptors can be analyzed either with propositional tools, or may be integrated into the ILP search.
iLogCHEMis an interactive system. It is up to the user to choose a search strategy and to exploit the different options offered by the system. At the core we have the pattern discovery algorithm. This algorithm is invoked after molecules are input and parameters of interest pre-computed. It relies on the standard ILP system Aleph [19], significantly rewritten to optimize this specific problem. Namely, we maintain fragments in a standard form, based on Morgan’s algorithm, and we use tabling [20] to store fragments so that repeated fragments are never revisited in the search.
To be more precise, the iLogCHEM algorithm is an extension of the greedy cover algorithm with ILP’s Mode Directed Inverse Entailment algorithm (MDIE) [21]. The first implementa-tion of this algorithm was the Progol system. Later, it has been implemented in several other ILP systems, such as April [22], and Aleph [19]. We chose MDIE because it is a seed-based algorithm, that is, it directs the search from a seed molecule, usually an active molecule. In other words, in MDIE, at each step we choose a seed, and then we search only for patterns that are guaranteed to match this seed molecule. This ensures that every rule will cover at least one example. Moreover, by careful selecting the seeds we can improve the algorithm’s perfor-mance [23]. Greedy cover removal is a standard Artificial Intelligence algorithm, based on the idea of removing the examples covered in a search step for the next search step. Greedy cover removal thus directs the search to examples that have not been explained by previous patterns. The output of this process is a set of patterns (technically, in ILP they are called a theory). From the user’s point of view, what is relevant is the patterns, and iLogCHEM supports the idea that individual patterns and how they cover molecules should be easy to understand and manipulate. In practice, this is implemented by computing the coverage of patterns, i.e., the molecules that match a certain pattern, and by allowing the user to visualize how each pattern instantiates to each covered molecule. Molecule visualization is a challenging field in itself. The system relies on VMD [24] to display the molecules and the matching substructures.
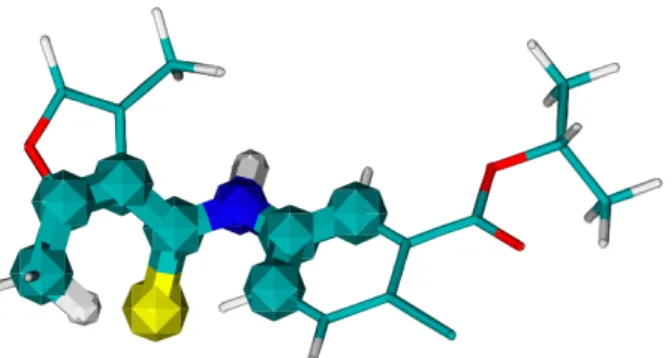
Figure 1 shows an actual example of iLogCHEM displaying a pattern, in this case a pattern discovered for the DTP AIDS data set. The molecule is displayed using the standard sticks
Copyright 2011 The Author(s). Published by Journal of Integrative Bioinformatics. This article is licensed under a Creative Commons Attribution-NonCommercial-NoDerivs 3.0 Unported License (http://creativecommons.org/licenses/by-nc-nd/3.0/).
Figure 1: Pattern (wider atoms and bonds) discovered in the DTP AIDS data set using ILP.
Figure 2: An Example Pattern from a Small Organic Molecule: A-alpha-C.
representation for chemical bonds. The pattern is emphasized by displaying atoms and bonds as wider balls and sticks. In this case, standard coloring shows that the pattern includes a sulphur atom (in yellow) in the vicinity of part of an aromatic ring.
2.1 Pattern Matching
As we have discussed so far, a key problem in the system is how to compute the number of molecules to support the pattern. ILP systems rely on logical refutation for this purpose. A first problem is clear if we consider the following Prolog representation of the N = C = N pattern:
active(C) ←
atom(C, Id1, c)∧
atom bond(C, Id1, Id2, c, n, 2)∧ atom bond(C, Id1, Id3, c, n, 2)
The pattern has a head that labels it and receives the molecule ID in a match as variable C. It is formed out of atom/3 and atom bond/6 properties, or goals. The clause can be seen as describing the pattern as rooted in an arbitrary node. The atom property marks an atom Id1as root of the tree. The atom bond property describes an edge in the tree, by giving the current molecule C, the parent node reference Id1, the child’s reference Id2 and Id3, the parent’s atom (strictly unnecessary)2, the child’s atom, and last, the type of bond.
2The type of atom Id
1, a carbon (c), is determined already by the first literal of the clause.
Copyright 2011 The Author(s). Published by Journal of Integrative Bioinformatics. This article is licensed under a Creative Commons Attribution-NonCommercial-NoDerivs 3.0 Unported License (http://creativecommons.org/licenses/by-nc-nd/3.0/).
Imagine we match a molecule A − α − C (Figure 2) against this pattern. Clearly, there is no match. Unfortunately, logical inference will match the same nitrogen against Id2 and Id3. Logically, it is valid to match two variables against the same atom, and the system would erroneously report a match. This problem is known as Object Identity [25], and the system addresses it by constraining the logical rules so that different variables must match different atoms: active(C) ← atom(C, Id1, c)∧ atom bond(C, Id1, Id2, c, n, 1)∧ Id1 6= Id2∧ atom bond(C, Id1, Id3, c, n, 1)∧ Id1 6= Id3∧ Id2 6= Id3
2.2 Integrating Structural Information in the search
The iLogCHEM system has the ability to integrate complementary information into the pattern search process. To do so, it is sufficient to declare that one wants different types of goals, or properties, in the logical rule.
Properties of interest are obtained through the graphical interface, and then passed on to the miner. In iLogCHEM the user may choose from a wide set of 1D molecular descriptors. As an example, consider the following extended pattern for the CPDBAS data set [12]: active(C) ←
logp(C, L) ∧ B ≤ −0.73333657∧ atom(C, Id1, c)∧
atom bond(C, Id1, Id2, c, c, 4)∧ atom bond(C, Id2, Id3, c, o, 4)
The constant −0.73333657 is obtained from the seed example. More precisely, MDIE enumer-ates all facts in the data base that are connected to the seed example (in this case, it enumerenumer-ates all facts for the seed molecule). Numerical constants occurring in these facts, such as the con-stant −0.73333657, are stored and then reused for pattern generation.
2.3 Interactive Search and Refinement
After choosing the data set of molecules and then filtering them out using the Tanimoto distance, the user may launch the ILP component, obtaining a set of patterns. The user will then often choose to visualize interesting rules in the model.
Two possible interactions are possible. First, the user may decide to do a “local and manual” search. Alternatively, she or he can specify constraints on the visualized pattern and ask the ILP system to produce a new model.
Copyright 2011 The Author(s). Published by Journal of Integrative Bioinformatics. This article is licensed under a Creative Commons Attribution-NonCommercial-NoDerivs 3.0 Unported License (http://creativecommons.org/licenses/by-nc-nd/3.0/).
In the first case the user may incrementally produce changes in the pattern (adding or deleting atoms and/or bonds) and then ask iLogCHEM to immediately evaluate the modified pattern. Whenever an evaluation is done the user will see a list of the “positive and negative” molecules covered.
If “local and manual” search does not produce the desired results the user may interactively (again adding/removing atoms and bonds) define a new pattern. This new pattern can be con-verted into a clause and used as the starting clause of the search space. That is, the user com-mands the system to find useful extensions of the provided pattern.
3
Graph Mining as feature construction for ILP
Another flavor of Relational Learning is Graph Mining (GM). Similarly to ILP, GM can also be very helpful in the Drug Design process and particularly in the toxicity problem we are ad-dressing with our tool. There are several tasks that GM can solve (see [26] for a detailed survey on GM systems) but we are particularly interested in the discovery of frequent sub-graphs. As the structures of molecules can be adequately represented by a graph, a GM algorithm can be used to identify sub-graphs that occur frequently in certain groups of molecules (toxic ones, for example) and do not occur in some other group (non-toxic ones). We have used this feature of frequent sub-graph discovery to identify fragments of toxic molecules that may be useful to explain toxicity.
Although the ILP algorithms can perform this task of discovering fragments in molecules, they are generally less efficient than the GM algorithms. However ILP can accept, in an easy way, additional and non-structural information that could be useful for explaining toxicity. With these premises in mind, we have combined the two Relational Learning approaches taking advantage of the best features of each one. We have used the efficiency of GM algorithms (Moss system ([27])) for pre-processing of the data to discover frequent fragments that are then provided to the ILP system as background knowledge. This background knowledge is then “complemented” with information such as molecular descriptors and a library of well known functional groups.
4
Similarity bias in drug design collections
The chemical space of small organic molecules is quite unevenly populated [28], with highly populated clusters around the so-called lead compounds and void spaces often encompassing unexplored molecular structures.
In this work we assess the bias introduced by structural similarity amongst compound collec-tions used in drug design studies. To do so, we rely on the Tanimoto Coefficient to compute the similarity between two molecules based on a set of molecular descriptors.
Given molecules A and B described by a vector of coefficients, the Tanimoto coefficient, also known as the extended Jacquard coefficient, is obtained as:
T (A, B) = kA · Bk kAk2+ kBk2− kA · Bk Copyright 2011 The Author(s). Published by Journal of Integrative Bioinformatics. This article is licensed under a Creative Commons Attribution-NonCommercial-NoDerivs 3.0 Unported License (http://creativecommons.org/licenses/by-nc-nd/3.0/).
A Tanimoto coefficient value of 1.0 indicates total similarity between the two molecules, whereas a value of zero indicates total dissimilarity. Notice that the Tanimoto coefficient highly depends on the attributes used to describe a compound. In this study, we use both 1D and 2D descriptors, as discussed in Section 5.2.
f ilter(SM D, T h):
Given: a set of molecule descriptions (SM D), a threshold for the Tanimoto Coefficient (T h). Return: a set of molecule descriptions representing a set of molecules for which there is
no pair of molecules that have a similarity above T h. 1. foreach m1∈ SM D do 2. foreach m2∈ SM D AN D m2 < m1do 3. sim[m1][m2] = T C(m1, m2) 4. endforeach 5. endforeach 6. C = cluster(sim, T h) 7. return medoids(C)
Figure 3: Filtering procedure using the Tanimoto coefficient. sim is a lower triangular similarity matrix. TC() is a function that computes the Tanimoto coefficient between two molecules. cluster() is a procedure that clusters molecules that are “more similar” than the Th value. medoids() returns for each cluster the medoid molecule.
4.1 Reducing the Similarity bias
In order to reduce the similarity bias we have constructed a filter that implements the procedure described in Figure 3. A similarity matrix (lines 1 to 5 of the procedure) is initially computed. Using the similarity matrix, we identify (line 6) clusters of molecules with similarity above a specified threshold. Finally (line 7), for each cluster the procedure returns the cluster’s medoid as the representative molecule.
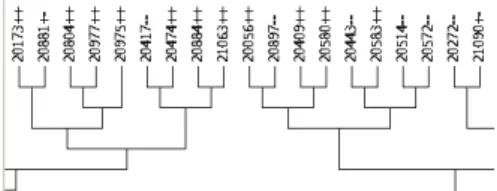
The filtering procedure discards sets of similar molecules and retains the “most representative” molecule of each set of similar molecules. As an example, using the similarity matrix con-structed with the molecules of the Carcinogenic Potency Database (CPDBAS), we have built the dendogram of Figure 4. There are cases where toxic molecules (represented by ’++’ in the dendogram) and non-toxic ones (represented by ’–’) are placed in the same cluster indicating that they are structurally similar. This finding confirms that positive and negative examples may correspond to very similar molecules and indeed may be difficult to discriminate (which makes the learning process hard). Thus the use of the filtering procedure described above does not ensure separation of similar positive and negative examples, if only one of the groups is kept. To overcome this potential problem we have implemented a different filtering procedure where we apply the clustering to the toxic and non-toxic molecules separately.
Figure 4: Part of the dendogram (using MEGA software [29]) for CPDBAS molecules. In the picture ’++’ indicates a drug with positive toxicity tests, ’–’ a drug with negative toxicity tests and ’+-’ a drug with some positive and some negative toxicity tests.
Copyright 2011 The Author(s). Published by Journal of Integrative Bioinformatics. This article is licensed under a Creative Commons Attribution-NonCommercial-NoDerivs 3.0 Unported License (http://creativecommons.org/licenses/by-nc-nd/3.0/).
5
Tool Testing
5.1 Data Sets
We have used three data sets available from the Distributed Structure-Searchable Toxicity (DSSTox) Public DataBase Network from the U.S. Environmental Protection Agency3. The DSSTox database project is targeted to toxicology studies and uses a standard chemical struc-ture annotation. The data sets used are briefly described below and characterized in terms of number of molecules in Table 1.
Table 1: Data set characterization in terms of the number of toxic and non-toxic molecules, with and without filtering. N1/N2 in each cell represents N1 toxic molecules and N2 non-toxic molecules. T.c. stands for the Tanimoto coefficient
data set without mixed filtering separated filtering filtering T.c.= 0.8 T.c.= 0.6 T.c.= 0.8 T.c.= 0.6
(%) (%) (%) (%)
CPDBAS 843/966 51.7/79.9 35.7/55.1 56.2/60.6 43.3/48.3 DBPCAN 80/98 71.3/43.9 60.0/31.6 71.3/45.9 62.5/33.7 NCTRER 131/93 44.3/67.7 25.2/45.2 48.1/74.2 25.2/54.8
CPDBAS: The Carcinogenic Potency DataBase (CPDB) contains detailed results and analyzes of 6540 chronic, long term carcinogenesis bio assays.
NCTRER: Researchers within FDA’s National Center for Toxicological Research (NCTR) generated a database of experimental estrogen receptor (ER) binding results with the purpose of developing improved QSAR models to predict ER binding affinities. The NCTRER database provides activity classifications for a total of 224 chemical compounds, with a diverse set of natural, synthetic and environmental estrogens.
DBPCAN: The water disinfection by-products database contains predicted estimates of car-cinogenic potential for 178 chemicals.The goal is to provide informed estimates of carcino-genic potential to be used as one factor in ranking and prioritizing future monitoring, testing, and research needs in the drinking water area.
5.2 Background knowledge
In addition to the original database information tags/entries, 50 molecular descriptors were calculated with Chemaxon’s GenerateMD program4. These molecular descriptors belong to a set of pre-defined categories [30]. In our data sets we used the constitutional-based descriptors, also known as 1D descriptors, and the topological-based descriptors, also called 2D descriptors. Furthermore, we generated molecular fingerprints using the Open Babel program [31]. These fingerprints were then converted into binary attributes that represent the presence or absence of a particular chemical substructure in the compound, such as fused rings, alkene, lactone, and enolether, in a total of 300 substructures.
3http://www.epa.gov/ncct/dsstox/index.html, accessed Dec 2008 4http://www.chemaxon.com, accessed Oct 2008
Copyright 2011 The Author(s). Published by Journal of Integrative Bioinformatics. This article is licensed under a Creative Commons Attribution-NonCommercial-NoDerivs 3.0 Unported License (http://creativecommons.org/licenses/by-nc-nd/3.0/).
All the descriptors and fingerprint information were encoded in Prolog so that they could be used by the ILP system Aleph [19] as background knowledge. For the fingerprints we have encoded the subset relation that enables to consider sets of fingerprint values. We take further advantage of ILP facilities to accept domain specific knowledge useful to construct the mod-els by encoding, in the background knowledge, a set of functional group definitions (methyl, nh2amino, aldehyde, ketone, carboxylic acid, hydroxyl, cyano, and benzene).
5.3 Experimental Design
In the current study we have assessed two important topics in SAR problems for Drug Design: the so called similarity bias; and the advantages of using relational learners. In this section we first describe the experimental design concerning the similarity bias problem and then we describe the experimental settings for the use of different relational learners and their combina-tion.
5.3.1 Similarity Bias study
Toxicity results using the CPDBAS, NCTRER and DBPCAN data sets were published by Pereira et al in [32]. In that study only propositional algorithms from Weka [33] were eval-uated. We will take Pereira et al. results as a base line for the comparison of the ILP outcome. In a first set of experiments we compare the performance of the ILP system with the Weka results using the same set of molecules (no filtering was applied).
We then applied the filtering procedure as described in Section 4 to the set of all molecules (toxic and non-toxic) with two threshold values for the Tanimoto Coefficient (0.6 and 0.8). These two values produce a significant reduction in the number of similar molecules in the data set(see Table 1) and therefore are able to attenuate the similarity bias.
In the last set of experiments, we have applied the filtering procedure separately to toxic and non-toxic molecules and we have used the same two threshold values for the Tanimoto Coeffi-cient.
Apart from the models’ accuracy, we have also assessed their complexity by computing the average number of rules in the models and the average rule length.
5.3.2 Relational Learners study
In this study we have used the ILP system Aleph and the Graph Mining system Moss. To assess the usefulness of these two relational learners we have used Aleph alone comparing the accuracy results with the propositional learners of [32] and the comprehensibility of the constructed models. We have used Moss to discover interesting graph fragments. We have also used the fragments as new features (background knowledge) for Aleph.
All the experiments were carried out on a cluster of 8 nodes having two quad-core Xeon 2.4 GHz and 32 GB of RAM per node and running Linux Ubuntu 8.10. To estimate the predictive quality of the classification models we performed 10 fold cross-validation experiments. The ILP system used was Aleph 5.0 and the Graph Mining system was Moss.
Copyright 2011 The Author(s). Published by Journal of Integrative Bioinformatics. This article is licensed under a Creative Commons Attribution-NonCommercial-NoDerivs 3.0 Unported License (http://creativecommons.org/licenses/by-nc-nd/3.0/).
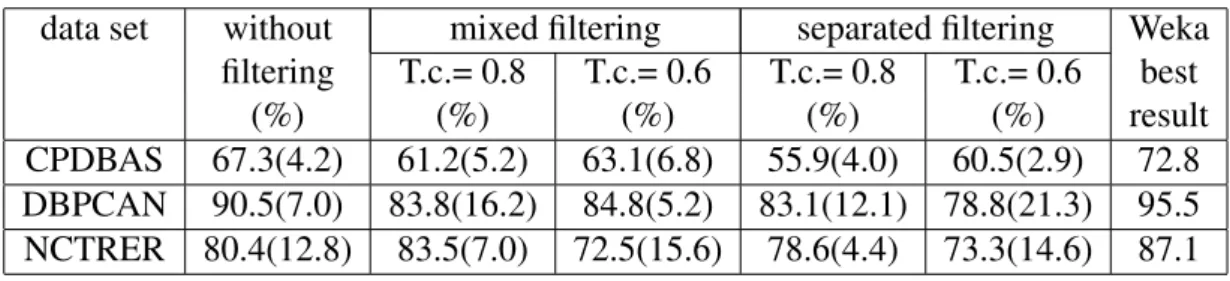
Table 2: Accuracy and standard deviation (in parenthesis). T.c. is the Tanimoto coefficient.
data set without mixed filtering separated filtering Weka filtering T.c.= 0.8 T.c.= 0.6 T.c.= 0.8 T.c.= 0.6 best
(%) (%) (%) (%) (%) result
CPDBAS 67.3(4.2) 61.2(5.2) 63.1(6.8) 55.9(4.0) 60.5(2.9) 72.8 DBPCAN 90.5(7.0) 83.8(16.2) 84.8(5.2) 83.1(12.1) 78.8(21.3) 95.5 NCTRER 80.4(12.8) 83.5(7.0) 72.5(15.6) 78.6(4.4) 73.3(14.6) 87.1
6
Results and Discussion
Accuracy results for all the data sets used in the experiments are shown in Table 2. The results by Pereira et al. ([32]), obtained using Weka, are included in the last column of the table for an easy comparison.
As shown in Table 2, ILP has achieved slightly lower accuracy results than the best ones ob-tained using Weka algorithms. The largest discrepancy is in the NCTRER data set where Weka showed nearly 9% better accuracy. CPDBAS and NCTRER Weka best results were obtained with Random Forest, an ensemble method that constructs models that although accurate are not comprehensible. We should also note that we have no information concerning Weka’s individ-ual Cross Validation (CV) runs and therefore we can not perform significance tests. Looking at the individual CV runs Aleph performed better in one run with CPDBAS, in two runs with DBPCAN and in four runs with NCTRER. We have also performed a set of trial experiments where the limit of the search space was increased. This sequence of experiments show that as the limit of the search space increases so increases the estimated accuracy of the models. The results reported in Table 2 where obtained with the search limit imposed by the memory of our machines, meaning that the reported results may be improved with more powerful computa-tional resources.
A close inspection of Table 2 confirms the H0 hypothesis formulated in Section 1. Filtering out the similar molecules from the original data sets significantly reduces the accuracy of the constructed models. That means that using the original data sets without filtering may result in over-optimistic results.
Table 3: Complexity of the constructed models. In each cell the left-hand-side numbers repre-sent average number of rules (clauses) and its standard deviation (in parenthesis) and on the right hand-side the average number of conditions (clause length) and its standard deviation (in paren-thesis). T.c. is the Tanimoto coefficient.
data set without mixed filtering separated filtering filtering T.c.= 0.8 T.c.= 0.6 T.c.= 0.8 T.c.= 0.6 CPDBAS 43.8(3.4)/3.2(0.2) 36.2(1.4)/3.4(0.2) 27.4(1.5)/3.3(0.3) 31.0(1.9)/3.3(0.2) 26.8(1.8)/3.0(0.1) DBPCAN 1.7(0.7)/3.4(0.5) 2.0(0.0)/3.1(0.2) 2.0(0.5)/3.2(0.5) 2.2(0.4)/3.0(0.0) 1.9(0.3)/3.3(0.3) NCTRER 5.4(0.7)/4.7(0.3) 2.3(0.5)/4.1(0.2) 1.8(0.8)/3.7(1.4) 2.9(0.3)/4.9(0.4) 2.0(0.7)/4.4(0.7)
Despite the slightly lower accuracy of the results, ILP was able to construct simple and com-prehensible models. Table 3 shows the average number of rules of the models in each set of experiments as well as the average model’s rule complexity (number of conditions). For ex-ample, the DBPCAN models have a small number of rules with an average of 5 conditions per rule. Copyright 2011 The Author(s). Published by Journal of Integrative Bioinformatics. This article is licensed under a Creative Commons Attribution-NonCommercial-NoDerivs 3.0 Unported License (http://creativecommons.org/licenses/by-nc-nd/3.0/).
Figures 5 and 6 present some simple and informative rules. The upper rule of Figure 5 identifies a toxic molecule if the molecule satisfies six conditions: the molecule must have a NH2 func-tional group; its tautomer count must be larger or equal to 2; it must have two or less hydrogen bond donors; it must have one of the three links between fingerprints: aa or da or dd5; the molecule must have two fingerprint links with a path length shorter or equal to 4.
toxic(A) :-nh2(A,B,C,D),
tautomer count(A,E), lteq(E,3), doncount(A,F), lteq(F,2), pharmacophore fingerprint(A,G,H,I), pharmacophore group(G,[aa,da,dd]), ltPharmacophoreArg2(H,4), ltPharmacophoreArg3(I,10). toxic(A) :-bcut(A,B), lteq(B,5.667885), ringcount(A,C), gteq(C,3),
mol polarizability(A,D), lteq(D,46.03), fusedaromatic ringcount(A,E), gteq(E,2).
Figure 5: Two rules induced by Aleph for the CPDBAS data set. See text for an English translation of the model.
toxic(A)
:-chemical fingerprint(A,B), fp group(B,[acetal,alkylbromide,alkylchloride]), pharmacophore fingerprint(A,C,D,E), pharmacophore group(C,[aa,an,hh]), ltPharmacophoreArg2(D,1), ltPharmacophoreArg3(E,10).
Figure 6: Single rule model constructed in one of the CV runs of the DBPCAN data set. This single rule model has 100% accuracy on the test set of that CV run. See text for an English translation of the model.
While the interpretation and translation of the generated rules into clear examples of high tox-icity chemicals may be contentious at this stage, it is also tempting to mention a few examples that seem to fit the models. One is the case of acrylamide, an important toxic compound that has been associated with carcinogenesis and neurotoxicity. Acrylamide contains one NH2 amino group, existing in three possible tautomeric forms; it holds no more than two hydrogen bond donors (at one hydrogen bond donor site) and a da link that actually constitutes two links be-tween the acceptor oxygen and the two donor hydrogens at the amino site (and whose path is shorter than 4).
A preliminary dissection of the rules into its individual conditions can help shedding light on their validity and, hence, predictive power. For example, while tautomerism alone cannot be regarded as a potentially harmful or toxic feature, it can be expected that organic molecules existing in a set of multiple inter-converting tautomeric forms are generally more prone to cross-reactivity than molecules existing in a single form. Equally, while several biological endogenous molecules contain a primary amine group, amines are also present in some families of highly toxic agents such as the Anisidines and the Anilines, where some of their various derivatives may comply with most or even all of the conditions in this rule. Thus, it is plausible that the combination of the features described in the presented rules on a single molecule can render it toxic and inappropriate for further drug design endeavors.
6.1 Graph Mining Results
The application of the frequent sub-graph discovery feature of Graph Mining (GM) resulted in the identification of a small set of molecular scaffolds and/or fragments for each data set. The most relevant fragments discovered by Moss, are listed in Table 4.
5aa means a link between two hydrogen bond acceptors; da means a link between an hydrogen bond acceptor
and an hydrogen bond donor; and dd represents a link between two hydrogen bond donors
Copyright 2011 The Author(s). Published by Journal of Integrative Bioinformatics. This article is licensed under a Creative Commons Attribution-NonCommercial-NoDerivs 3.0 Unported License (http://creativecommons.org/licenses/by-nc-nd/3.0/).
Figure 7: Chemical formula for nine entries detected on the CPDBAS data set through Graph Mining.
Strikingly, the first entry found on the CPDBAS data set was the biphenyl scaffold (see Table 4). Composed by two aromatic rings and 12 carbon atoms, this structure corresponds to a sizeable sub-graph, which is present in some drugs, such as valsartan and telmisartan for the treatment of hypertension. However, the biphenyl molecule itself is associated with decreased activity of the hepatic cytochrome CYP1A2 enzyme, causing liver neoplasms and methemoglobinemia [34]. Moreover, due to their symmetry, hydrophobicity, and ease of conjugation with halogen atoms as in the pollutant polychlorinated biphenyls (PCBs) , several biphenyl derivatives have been associated with bioaccumulation [35], neurotoxicity [36, 37], and endocrine disruption [38]. A curious finding in this set is a fragment that is equivalent to propylhydrazine. This sub-graph is present in a nitric oxide donor compound known as PAPA-NONOate, which has been linked to testicular diseases, male infertility and chronic panchreatitis [39]. But the GM algorithm also found a methylhydrazine fragment as a risk alert amongst the CPDBAS data set. Methyhydrazines are associated with a number of diseases, particularly cancer [40, 41, 42]. The same applies to nitroso(propyl)amines and nitrosamines in general, which strongly interact with the CYP2A6 cytochrome causing hepatitis B and C, liver cancer and cirrhosis, and several other types of cancer [43, 44, 45]. Overall, five entries representing the nitrosamines have been revealed through GM on the CPDBAS data set (Table 4 and Figure 7).
The GM results obtained for the DBPCAN data set clearly bring focus to the halogens and the haloalkanes. We could certainly analyze these results one-by-one. Indeed, most of the entries in Table 4 correlate with some form of toxic effect. For example, bromomethane was used as a pesticide before being correlated with diseases of agricultural workers and heart diseases [46]. However, considering the small size of the found sub-graphs it seems even more obvious to us that the results should be assessed globally and by trying to integrate them as fragments or functions (chemophores) of organic molecules. With this in mind, we carried out substructure searches for each found sub-graph on two small databases of drugs withdrawn from the market and illicit molecules [47, 48, 49]. The sub-graph corresponding to bromomethane was found in three withdrawn drugs and in five illicit molecules. Remoxipride, for example, was a drug used in the treatment of schizophrenia that was withdrawn from the market due to toxicity concerns (incidence of aplastic anemia) [50]. Even though the detection of the bromomethane sub-graph may translate into a solitary bromine substituent in a molecule, and despite the fact that a few drug molecules in the market include bromine as a substituent, the presence of this particular halogen is highly discouraged by reputable medicinal chemists [51].
Copyright 2011 The Author(s). Published by Journal of Integrative Bioinformatics. This article is licensed under a Creative Commons Attribution-NonCommercial-NoDerivs 3.0 Unported License (http://creativecommons.org/licenses/by-nc-nd/3.0/).
Table 4: Some molecular fragments discovered by Moss in SMILES [14] format.
CPDBAS DBPCAN NCTRER
c1(:c:c:c:c:c:1):c1:c:c:c:c:c:1 Cl-C(-Cl)-C-C Br O-c1:c:c:c(-C(-C)-C):c:c:1
N(-N)-C-C-C Br-C Br-C-C O-c:c:c:c-C(-C)-C
N(-N)(-C)-C-C Cl-C(-Cl)-C Cl O-c(:c):c:c:c-C(-C)-C N(-N)(-C)-C-C-C Cl-C-C-C Cl-C O-c:c:c:c(-C(-C)-C):c N(-N=O)-C-C Cl-C=C-C Cl-C=C O-c(:c:c):c:c:c-C(-C)-C N(-N=O)(-C)-C Cl-C-Cl O=C-C-Cl O-c(:c):c:c:c(-C(-C)-C):c N(-N=O)-C-C-C Cl-C-C Cl-C-C-Cl O-c:c:c:c(-C(-C)-C):c:c N(-N=O)(-C)-C-C O=C(-C)-C-Cl
N(-N=O)(-C)-C-C-C
The GM results obtained for the NCTRER data set seem to highlight a group of acyclic al-cohols, with the exception of 4-(propan-2-yl)phenol. Substructure searches conducted on the same databases did not retrieve any results for these fragments. However, the matched sub-graphs are found in molecules of the NCTRER set that hold well-known hormonal effects, particularly due to their affinity for the estrogen receptor. 17beta estradiol is a emblematic ex-ample, herein matched by the 4-(propan-2-yl)phenol sub-graph. Other examples include several bisphenols and diethylstilbestrol analogues. Indeed, it would be interesting to analyse putative correlations between these particular sub-graphs and the hormonal and carcinogenic potential of the molecules onto which they match.
7
Conclusions
In the present paper we presented iLogCHEM, an interactive tool that helps experts easily inter-act with relational learners in the drug design process. In an iterative process a researcher may get help in the search for new drugs by visually inspecting the models constructed by the ma-chine learning algorithms and providing constraints to improve the model for the next iteration. No details of the algorithm’s workings are presented to the expert. The researcher only sees graphical representations of the molecules and patterns and SMILES notation descriptions. We have also reported in this paper a study to assess the effect of having a high degree of similarity amongst molecules in drug collections on the outcome of predictive models for drug toxicity. This “similarity bias” observed in most drug data bases makes the predictive results too optimistic. Our results show that filtering out similar molecules with a Tanimoto coefficient of 0.8 substantially reduces the data sets (demonstrating the high degree of compound similarity in the data bases) and drastically reduces the predictive power of the classifiers. This reduction in predictive accuracy is statistically significant in almost all of our experiments.
The accuracy of the models produced with ILP is not significantly worse than the accuracy values of the propositional learners. However, the constructed ILP models are simple, under-standable, and incorporate the functional group definitions supplied by an expert.
One last study reported in this paper concerns the use of a Graph Mining algorithm to find molecular fragments implicated in toxic effects, which might help stream-lining the drug de-sign process. We have integrated these molecular fragments descriptions into the background
Copyright 2011 The Author(s). Published by Journal of Integrative Bioinformatics. This article is licensed under a Creative Commons Attribution-NonCommercial-NoDerivs 3.0 Unported License (http://creativecommons.org/licenses/by-nc-nd/3.0/).
knowledge of an ILP system that was able to use them to induce very simple and informative rules on the toxicity of different chemical compounds.
Acknowledgements
This work has been supported by Fundac¸˜ao para a Ciˆencia e Tecnologia (FCT) project HORUS (PTDC/EIA-EIA/100897/2008). CJVS acknowledges the support of FCT through the PhD grant SFRH/BD/29357/2006.
References
[1] D. Plewczynski. Tvscreen: Trend vector virtual screening of large commercial com-pounds collections. BIOTECHNO ’08, June 29 – July 5 2008, Bucharest, pages 59–63, 2008.
[2] J. Graham, C. D. Page, and A. Kamal. Accelerating the drug design process through parallel inductive logic programming data mining. CSB’03, page 400, 2003.
[3] H. van de Waterbeemd and E. Gifford. Admet in silico modelling: towards prediction paradise? Nat Rev Drug Discov, 2(3):192–204, March 2003.
[4] A. Amini, S. H. Muggleton, H. Lodhi, and M. J. E. Sternberg. A novel logic-based approach for quantitative toxicology prediction. J. Chem. Inf. Model., 47(3):998–1006, May 2007.
[5] J. C. Dearden. In silico prediction of drug toxicity. Journal of Computer-Aided Molecular Design, 17(2-4):119–127, 2003.
[6] D. M. Sanderson and C. G. Earnshaw. Computer prediction of possible toxic action from chemical structure; the derek system. Hum. Exp. Toxicol., 10(4):261–273, Jul, 1991. [7] V. K. Gombar, H. H. Borgstedt, K. Einslein, J. B. Hart, B. W. Blake. A qsar model of
teratogenesis. Quantitative Structure Activity Relationships, 10(4):306–322, 1991. [8] A. C. White, R. A. Mueller, R. H. Gallavan, S. Aaron, and A. G. E. Wilson. A multiple
in silico program approach for the prediction of mutagenicity from chemical structure. Mutation Research/Genetic Toxicology and Env. Mutagenesis, 539:77–89(13), 2003. [9] A. Tiwari, J. Knowles, E. Avineri, K. Dahal, and R. Roy, editors. Advances in the
Ap-plication of Machine Learning Techniques in Drug Discovery, Design and Development, Advances in Soft Compt. Springer, 2006.
[10] J. Kazius, R. Mcguire, and R. Bursi. Derivation and validation of toxicophores for muta-genicity prediction. J. Med. Chem., 48(1):312–320, January 2005.
[11] D. Neagu, M. V. Craciun, S. A. Stroia, and S. Bumbaru. Hybrid intelligent systems for predictive toxicology - a distributed approach. International Conference on Intelligent Systems Design and Applications, pages 26–31, 2005.
Copyright 2011 The Author(s). Published by Journal of Integrative Bioinformatics. This article is licensed under a Creative Commons Attribution-NonCommercial-NoDerivs 3.0 Unported License (http://creativecommons.org/licenses/by-nc-nd/3.0/).
[12] A. M. Richard and C. R. Williams. Distributed structure-searchable toxicity (dsstox) public database network: a proposal. Mutation Research/Fundamental and Molecular Mechanisms of Mutagenesis, 499(1):27–52, 2002.
[13] V. S. Costa, N. A. Fonseca, and R. Camacho. Logchem: Interactive discriminative mining of chemical structure. In Proceedings of 2008 IEEE International Conference on Bioin-formatics and Biomedicine (BIBM 2008), pages 421–426, Philadelphia, USA, November 2008. IEEE Computer Society.
[14] D. Weininger. Smiles: A chemical language and information system: 1. introduction to methodology and encoding rules. Journal of Chemical Information and Computer Science (JCICS), 29(2):97–101, 1989.
[15] S. Kramer, L. De Raedt, and C. Helma. Molecular feature mining in HIV data. In KDD 2001, pages 136–143, 2001.
[16] A. Karwath and L. De Raedt. Predictive graph mining. In Discovery Science, 7th Inter-national Conference, (DS 2004), LNCS, volume 3245, pages 427–504. Springer-Verlag, 2004.
[17] R. Guha, M. T. Howard, G. R. Hutchison, P. Murray-Rust, H. Rzepa, C. Steinbeck, J. K. Wegner, and E. L. Willighagen. The blue obelisk–interoperability in chemical informatics. Journal of Chemical Information and Modeling, 46(3):991–998, 2006.
[18] J. M Collins. The dtp aids antiviral screen program. Technical report, 1999.
[19] A. Srinivasan. The Aleph Manual, 2003. Available from http://web.comlab.ox. ac.uk/oucl/research/areas/machlearn/Aleph.
[20] N. A. Fonseca, V. S. Costa, R. Rocha, R. Camacho, and F. Silva. Improving the efficiency of inductive logic programming systems. Software Practice and Experience, 39(2):189– 219, 2009.
[21] S. Muggleton. Inverse entailment and progol. 13(3-4):245–286, 1995.
[22] N. A. Fonseca, F. Silva, and R. Camacho. April - an inductive logic programming sys-tem. In Proceedings of the 10th European Conference on Logics in Artificial Intelligence (JELIA06), LNAI, volume 4160, pages 481–484. Springer, 2006.
[23] N. A. Fonseca, V. S. Costa, R. Camacho, C. Vieira, and J. Vieira. Partitional clustering of protein sequences - an inductive logic programming approach. In 10th International Work-Conference on Artificial Neural Networks, IWANN 2009, Lecture Notes in Com-puter Science, volume 5518, pages 1001–1004. Springer, 2009.
[24] W. Humphrey, A. Dalke, and K. Schulten. Vmd – visual molecular dynamics. Journal of Molecular Graphics, 14:33–38, 1996.
[25] F. A. Lisi, S. Ferilli, and N. Fanizzi. Object identity as search bias for pattern spaces. In Proceedings of the 15th European Conference on Artificial Intelligence, ECAI’2002, Lyon, France, pages 375–379. IOS Press, 2002.
Copyright 2011 The Author(s). Published by Journal of Integrative Bioinformatics. This article is licensed under a Creative Commons Attribution-NonCommercial-NoDerivs 3.0 Unported License (http://creativecommons.org/licenses/by-nc-nd/3.0/).
[26] V. Krishna, N. N. R. R. Suri, and G. Athithan. A comparative survey of algorithms for frequent subgraph discovery. Current Science, 100(2):190–198, 2011.
[27] C. Borgelt and M. R. Berthold. Mining molecular fragments: Finding relevant substruc-tures of molecules. In IEEE International Conference on Data Mining (ICDM 2002), pages 51–58, 2002.
[28] T. Fink, H. Bruggesser, and J. L. Reymond. Virtual exploration of the small-molecule chemical universe below 160 daltons. Angew Chem Int Ed Engl., 44(10):1504–1508, 2005.
[29] S. Kumar, J. Dudley, M. Nei, and K. Tamura. Mega: A biologist-centric software for evolutionary analysis of dna and protein sequences. Briefings in Bioinf., 9(4):299–306, 2008.
[30] S. Ekins. Computational Toxicology: Risk Assessment for Pharmaceutical and Envi-ronmental Chemicals (Wiley Series on Technologies for the Pharmaceutical Industry). Wiley-Interscience, 2007.
[31] R. Guha, M. T. Howard, G. R. Hutchison, P. Murray-Rust, H. Rzepa, C. Steinbeck, J. Weg-ner, and E. L. Willighagen. The blue obelisk – interoperability in chemical informatics. J. Chem. Inf. Model., 3(46):991–998, 2006.
[32] M. Pereira, V. S. Costa, R. Camacho, N. A. Fonseca, C. Simoes, and R. Brito. Com-parative study of classification algorithms using molecular descriptors in toxicological databases. In Brasilian Symposium on Bioinformatics, Lecture Notes in Bioinformatics, volume 5676, pages 121–132, 2009.
[33] I. H. Witten and E. Frank. Data Mining: Practical machine learning tools and techniques. Morgan Kaufmann, 2nd edition edition, 2005.
[34] L. E. Korhonen, M. Rahnasto, N. J. M¨ah¨onen, C. Wittekindt, A. Poso, R. O. Juvonen, and H. Raunio. Predictive three-dimensional quantitative structure-activity relationship of cytochrome p450 1a2 inhibitors. J. Med. Chem., 48(11):3808–3815, 2005.
[35] M. Van den Berg, L. Birnbaum, A. T. Bosveld, B. Brunstr¨om, P. Cook, M. Feeley, J. P. Giesy, A. Hanberg, R. Hasegawa, S. W. Kennedy, T. Kubiak, J. C. Larsen, F. X. van Leeuwen, A. K. Liem, C. Nolt, R. E. Peterson, L. Poellinger, S. Safe, D. Schrenk, D. Tillitt, M. Tysklind, M. Younes, F. Waern, and T. Zacharewski. Toxic equivalency factors (tefs) for pcbs, pcdds, pcdfs for humans and wildlife. Environ. Health Perspect., 106(12):775–792, 1998.
[36] T. Simon, J. K. Britt, and R. C. James. Development of a neurotoxic equivalence scheme of relative potency for assessing the risk of pcb mixtures. Regul. Toxicol. Pharmacol., 48(2):148–170, 2007.
[37] G. Winneke, A. Bucholski, B. Heinzow, U. Kr¨amer, E. Schmidt, J. Walkowiak, J. A. Wiener, and H. J. Steingr¨uber. Developmental neurotoxicity of polychlorinated biphenyls (pcbs): cognitive and psychomotor functions in 7-month old children. Toxicol. Lett., 102-103:423–428, 1998. Copyright 2011 The Author(s). Published by Journal of Integrative Bioinformatics. This article is licensed under a Creative Commons Attribution-NonCommercial-NoDerivs 3.0 Unported License (http://creativecommons.org/licenses/by-nc-nd/3.0/).
[38] K. R. Chauhan, P. R. Kodavanti, and J. D. McKinney. Assessing the role of ortho-substitution on polychlorinated biphenyl binding to transthyretin, a thyroxine transport protein. Toxicol. Appl. Pharmacol., 162(1):10–21, 2000.
[39] A. C. Skinn and W. K. MacNaughton. Nitric oxide inhibits camp-dependent cftr traffick-ing in intestinal epithelial cells. Am. J. Physiol. Gastrointest. Liver Physiol., 289(4):G739– G744, 2005.
[40] Y. I. Kim, I. P. Pogribny, R. N. Salomon, S. W. Choi, D. E. Smith, S. J. James, and J. B. Mason. Exon-specific dna hypomethylation of the p53 gene of rat colon induced by dimethylhydrazine. modulation by dietary folate. Am. J. Pathol., 149(4):1129–1137, 1996.
[41] A. L. T. Spinardi-Barbisan, R. Kaneno, L. F. Barbisan, J. L. Viana de Camargo, and M. A. M. Rodrigues. Chemically induced immunotoxicity in a medium-term multiorgan bioassay for carcinogenesis with wistar rats. Toxicol. Appl. Pharmacol., 194(2):132–140, 2004.
[42] S. Raval-Fernande, V. A. Kickhoefer, C. Kitchen, and L. H. Rome. Increased susceptibil-ity of vault poly(adp-ribose) polymerase-deficient mice to carcinogen-induced tumorige-nesis. Cancer Res., 65:8846–8852, 2005.
[43] R. Grobholz, H. J. Hacker, B. Thorens, and P. Bannasch. Reduction in the expression of glucose transporter protein glut 2 in preneoplastic and neoplastic hepatic lesions and reexpression of glut 1 in late stages of hepatocarcinogenesis. Cancer Res., 53:4204–4211, 1993.
[44] L. Shu and P. F. Hollenberg. Identification of the cytochrome p450 isozymes in-volved in the metabolism of n-nitrosodipropyl-,n-nitrosodibutyl- and n-nitroso-n-butyl-n-propylamine. Carcinogenesis, 17(4):839–848, 1996.
[45] J. F. Waring, R. Ciurlionis, R. A. Jolly, M. Heindel, and R. G. Ulrich. Microarray anal-ysis of hepatotoxins in vitro reveals a correlation between gene expression profiles and mechanisms of toxicity. Toxicol. Lett., 120(1–3):359–368, 2001.
[46] P. K. Mills and R. Yang. Prostate cancer risk in california farm workers. J. Occup. Environ. Med., 45(3):249–258, 2003.
[47] D. S. Wishart, C. Knox, A. C. Guo, S. Shrivastava, M. Hassanali, P. Stothard, Z. Chang, and J. Woolsey. Drugbank: a comprehensive resource for in silico drug discovery and exploration. Nucleic Acids Res., 34(suppl 1):D668–D672, 2006.
[48] D. S. Wishart, C. Knox, A. C. Guo, D. Cheng, S. Shrivastava, D. Tzur, B. Gautam, and M. Hassanali. Drugbank: a knowledgebase for drugs, drug actions and drug targets. Nucleic Acids Res., 36(suppl 1):D901–D906, 2008.
[49] C. Knox, V. Law, T. Jewison, P. Liu, S. Ly, A. Frolkis, A. Pon, K. Banco, C. Mak, V. Neveu, Y. Djoumbou, R. Eisner, A. C. Guo, and D. S. Wishart. Drugbank 3.0: a comprehensive resource for ‘Omics’ research on drugs. Nucleic Acids Res., 39(suppl 1), D1035–D1041, 2011. Copyright 2011 The Author(s). Published by Journal of Integrative Bioinformatics. This article is licensed under a Creative Commons Attribution-NonCommercial-NoDerivs 3.0 Unported License (http://creativecommons.org/licenses/by-nc-nd/3.0/).
[50] C. K¨ohler, H. Hall, O. Magnusson, T. Lewander, and K. Gustafsson. Biochemical pharma-cology of the atypical neuroleptic remoxipride. Acta Psychiatr. Scand., 82(S358):27–36, 1990.
[51] H. Kubinyi. Computational and Structural Approaches to Drug Discovery. Cambridge: Royal Society of Chemistry, 2007.
Copyright 2011 The Author(s). Published by Journal of Integrative Bioinformatics. This article is licensed under a Creative Commons Attribution-NonCommercial-NoDerivs 3.0 Unported License (http://creativecommons.org/licenses/by-nc-nd/3.0/).


![Table 4: Some molecular fragments discovered by Moss in SMILES [14] format.](https://thumb-eu.123doks.com/thumbv2/123dok_br/18791457.925159/14.893.116.776.161.393/table-molecular-fragments-discovered-moss-smiles-format.webp)