Wild and commercial mushrooms as source of nutrients and nutraceuticals
Lillian Barros, Telma Cruz, Paula Baptista, Letícia M. Estevinho, Isabel C.F.R. Ferreira
* CIMO/Escola Superior Agrária, Instituto Politécnico de Bragancßa, Campus de Santa Apolónia, Apartado 1172, 5301-855 Bragancßa, Portugala r t i c l e
i n f o
Article history:
Received 29 February 2008 Accepted 24 April 2008
Keywords: Mushrooms
Wild and commercial sp. Nutrients
Nutraceuticals Antimicrobials
a b s t r a c t
In order to promote the use of mushrooms as source of nutrients and nutraceuticals, several experiments were performed in wild and commercial species. The analysis of nutrients included determination of pro-teins, fats, ash, and carbohydrates, particularly sugars by HPLC-RI. The analysis of nutraceuticals included determination of fatty acids by GC-FID, and other phytochemicals such as tocopherols, by HPLC-fluores-cence, and phenolics, flavonoids, carotenoids and ascorbic acid, by spectrophotometer techniques. The antimicrobial properties of the mushrooms were also screened against fungi, Gram positive and Gram negative bacteria. The wild mushroom species proved to be less energetic than the commercial sp., con-taining higher contents of protein and lower fat concentrations. In general, commercial species seem to have higher concentrations of sugars, while wild sp. contained lower values of MUFA but also higher con-tents of PUFA.a-Tocopherol was detected in higher amounts in the wild species, whilec-tocopherol was not found in these species. Wild mushrooms revealed a higher content of phenols but a lower content of ascorbic acid, than commercial mushrooms. There were no differences between the antimicrobial prop-erties of wild and commercial species. The ongoing research will lead to a new generation of foods, and will certainly promote their nutritional and medicinal use.
Ó2008 Elsevier Ltd. All rights reserved.
1. Introduction
A nutraceutical can be defined as a substance that may be
consid-ered a food or part of a food and provides medical or health benefits
like the prevention and treatment of disease. Nutraceuticals may
range from isolated nutrients and dietary supplements to
geneti-cally engineered ‘‘designer” foods, herbal products and processed
products such as cereals, soups and beverages. Some examples of
nutritive nutraceuticals or ‘‘functional food ingredients” are dietary
fiber, polyunsaturated fatty acids (PUFA, fish oil), proteins, peptides,
amino acids, keto acids, minerals, antioxidative vitamins and other
antioxidants (glutathione, selenium, etc) (
Andlauer and Fürst, 2002;
Kruger and Mann, 2003
). PUFAs, especially the n-3 fatty acid family,
are claimed to exert a protective effect against the development of
cardiovascular and inflammatory diseases (
Fürst and Kuhn, 2000;
Fang et al., 2002
). Epidemiological studies have consistently shown
an inverse association between consumption of vegetables and
fruits and the risk of cardiovascular diseases (
Bazzano et al., 2001
)
and certain forms of cancer (
Liu, 2003
). Although the protective
ef-fects have been primarily attributed to well-known antioxidants,
such as ascorbic acid, tocopherols and
b-carotene, plant phenolics
may also play a significant role (
Soobrattee et al., 2005
).
Different mushrooms were studied by the scientific community,
in searching for new therapeutic alternatives, and the results
proved their bioactive properties (
Lindequist et al., 2005
).
Mush-rooms are rich sources of nutraceuticals (
Çag˘larirmak, 2007;
Elmastas et al., 2007; Ribeiro et al., 2007
) responsible for their
anti-oxidant (
Mau et al., 2002; Lo and Cheung, 2005; Barros et al.,
2007a
), antitumor (
Wasser and Weis, 1999
), and antimicrobial
properties (
Smânia et al., 1995; Hirasawa et al., 1999; Hatvani,
2001; Barros et al., 2007b; Turkoglu et al., 2007
). Besides their
pharmacological features (
Lindequist et al., 2005
), wild
mush-rooms are becoming more important in our diet due to their
nutri-tional value, related to the high protein and low fat/energy
contents (
Diéz and Alvarez, 2001; Agahar-Murugkar and
Sub-bulakshmi, 2005; Barros et al., 2007c
).
Our research group has been interested in nutritional and
bioac-tive properties of wild mushrooms such as antioxidant activity
(
Barros et al. 2007a
), antimicrobial activity (
Barros et al., 2007b
),
and the influence of conservation treatment/cooking (
Barros et
al., 2007d
) and fruiting body maturity stage (
Barros et al., 2007e
)
on these properties.
In the present study we intend to evaluate the composition of
wild and commercial mushrooms in nutrients and nutraceuticals.
The evaluation of nutrient composition included the determination
of proteins, fats, ash, carbohydrates, and individual profile of
sug-ars. The evaluation of nutraceutical composition included the
determination of fatty acids, phenolics, flavonoids, carotenoids,
ascorbic acid and tocopherols. Antimicrobial activity was screened
against fungi, Gram positive and Gram negative bacteria, and
cor-related to the bioactive compounds present in the extracts.
0278-6915/$ - see front matterÓ2008 Elsevier Ltd. All rights reserved. doi:10.1016/j.fct.2008.04.030
*Corresponding author. Tel.: +351 273 303219; fax: +351 273 325405. E-mail address:[email protected](I.C.F.R. Ferreira).
Contents lists available at
ScienceDirect
Food and Chemical Toxicology
2. Materials and methods
2.1. Samples
Eight mushrooms species:Boletus edulisFr.,Calocybe gambosa(Fr.) Donk, Can-tharellus cibariusL. ex Fr.,Craterellus cornucopioidesPers.,Marasmius oreades(Bolt. ex Fr.) Fr. were commercial dried samples obtained in several supermarkets. All the others (Agaricus bisporus(Lange) Imbach,Agaricus silvaticusSchaeff.,Agaricus sil-vicola(Vittad.) Peck were wild species and were collected under grassland in Brag-ancßa (Northeast of Portugal), in autumn 2006. The morphological identification of the wild macrofungi was made till species according to macro and microscopic characteristics, and following several authors (Moser, 1983; Courtecuisse and Du-hem, 1995) and representative voucher specimens were deposited at the herbarium ofEscola Superior AgráriaofInstituto Politécnico de Bragancßa. After collection and taxonomic identification, those mushrooms were lyophilized (Ly-8-FM-ULE, Snij-ders, HOLLAND) before analysis.
2.2. Standards and reagents
Acetonitrile 99.9%,n-hexane 95% and ethyl acetate 99.8% were of HPLC grade from Lab-Scan (Lisbon, Portugal). All the other reagents were of analytical grade purity: methanol and diethyl ether were supplied by Lab-Scan (Lisbon, Portugal); toluene from Riedel-de-Haën; sulphuric acid from Fluka (St. Gallen, Switzerland). The fatty acids methyl ester (FAME) reference standard mixture 37 (fatty acids C4–C24; (standard 47885-U) was from Supelco (Bellefonte, PA, USA) and purchased from Sigma (St. Louis, MO, USA), as also other individual fatty acid isomers, tocoph-erol standards (a,b,candd), and the standards gallic acid and (+)-catechin. The standards used in the antimicrobial activity assays, ampicillin and cycloheximide, as also butylated hydroxytoluene (BHT) were purchased from Merck (Darmstadt, Germany). All other chemicals were obtained from Sigma Chemical Co. (St. Louis, MO, USA). Water was treated in a Mili-Q water purification system (TGI Pure Water Systems, USA).
2.3. Nutrient composition
2.3.1. Nutritional value
Samples of mushrooms were analysed for chemical composition (protein, fat, carbohydrates and ash) using theAOAC procedures (1995). The crude protein con-tent (N4.38) of the samples was estimated by the macroKjeldahl method; the crude fat was determined by extracting a known weight of powdered mushroom sample with petroleum ether, using a Soxhlet apparatus; the ash content was deter-mined by incineration at 600 ± 15°C; reducing sugars were determined by DNS (dinitrosalicylic acid) method. Total carbohydrates were calculated by difference: Total carbohydrates = 100 – (g moisture + g protein + g fat + g ash). Total energy was calculated according to the following equations: Energy (kJ) = 17(g pro-tein + g carbohydrate) + 37(g lipid).
2.3.2. Sugar composition
Free sugars were determined by high performance liquid chromatography cou-pled to a refraction index detector (HPLC-RI) based on the method used byHarada et al. (2004)with minor modifications. Dried powder (1.0 g) was extracted with 40 ml of 80% aqueous ethanol at 80°C for 30 min. The resulting suspension was centrifuged at 15,000gfor 10 min. The supernatant was concentrated at 60°C under reduced pressure and defatted three times with 10 ml of ethyl ether, successively. After concentration at 40°C, the solid residues were dissolved in water to a final volume of 5 ml. Soluble sugars were determined by using HPLC (Knauer, Smartline system) at 35°C. The HPLC system was equipped with a Knauer Smartline 2300 RI detector and with a Eurospher 100-5 NH2column (4.6250 mm, 5 mm, Knauer). The mobile phase was acetonitrile/deionized water, 7:3 (v/v) at a flow rate of 1.25 ml/min. The results are expressed in g/100 g of dry weight, calculated by inter-nal normalization of the chromatographic peak area. Sugar identification was made by comparing the relative retention times of sample peaks with standards. The su-gar standards used for identification were purchased from Sigma Chemical Co. (St. Louis, USA): L(+)-arabinose, D( )-fructose, D(+)-galactose, D(+)-glucose anhydrous, lactose 1-hydrate, maltose 1-hydrate, D(+)-mannitol, D(+)-mannose, D(+)-melezi-tose, D(+)-melibiose monohydrate, L(+)-rhamnose monohydrate, D(+)-sucrose, D(+)-trehalose and D(+)-xylose.
2.4. Nutraceutical composition
2.4.1. Fatty acid composition
Fatty acids were determined by gas-liquid chromatography with flame ioniza-tion detecioniza-tion (GLC-FID)/capillary column based on the following trans-esterifica-tion procedure: fatty acids were methylated with 5 mL of methanol:sulphuric acid:toluene 2:1:1 (v:v), during at least 12 h in a bath at 50°C and 160 rpm; then 5 mL of deionised water were added, to obtain phase separation; the FAME were
recovered with 5 mL of diethyl ether by shaking in vortex, and the upper phase was passed through a micro-column of sodium sulphate anhydrous, in order to eliminate the water; the sample was recovered in a vial with Teflon, and before injection the sample was filtered with 0.2lm nylon filter from Milipore. The fatty acid profile was analyzed with a DANI model GC 1000 instrument equipped with a split/splitless injector, a flame ionization detector (FID) and a Macherey-Nagel col-umn (30 m0.32 mm ID0.25lmdf). The oven temperature program was as
fol-lows: the initial temperature of the column was 50°C, held for 2 min, then a 10°C/ min ramp to 240°C and held for 11 min. The carrier gas (hydrogen) flow-rate was 4.0 mL/min (0.61 bar), measured at 50°C. Split injection (1:40) was carried out at 250°C. For each analysis 1lL of the sample was injected in GC. Fatty acid identifi-cation was made by comparing the relative retention times from samples with FAME peaks (standards). The results were recorded and processed using CSW 1.7 software (DataApex 1.7) and expressed in relative percentage of each fatty acid.
2.4.2. Tocopherol composition
BHT solution in hexane (10 mg/mL; 100lL) and IS solution in hexane (d -tocopherol; 1.6lg/mL; 250lL) were added to the sample prior to the extraction procedure. The samples (500 mg) were homogenized with methanol (4 mL) by vortex mixing (1 min). Subsequently, hexane (4 mL) was added and again vortex mixed for 1 min. After that, saturated NaCl aqueous solution (2 mL) was added, the mixture was homogenized (1 min), centrifuged (5 min, 4000g) and the clear upper layer was carefully transferred to a vial. The sample was re-extracted twice with hexane. The combined extracts were taken to dryness under a nitrogen stream, redissolved in 1 mL ofn-hexane, dehydrated with anhydrous sodium sul-phate, filtered through a 0.22lm disposable LC filter disk, transferred into a dark injection vial and analysed by HPLC. The HPLC equipment consisted of an inte-grated system with a Smartline pump 1000 (Knauer, Germany), a degasser system Smartline manager 5000, an AS-2057 auto-sampler and a 2500 UV detector at 295 nm (Knauer, Germany) connected in series with a FP-2020 fluorescence detec-tor (Jasco, Japan) programmed for excitation at 290 nm and emission at 330 nm. Data were analysed using Clarity 2.4 Software (DataApex). The chromatographic separation was achieved with a Polyamide II (2504.6 mm) normal-phase column from YMC Waters (Japan) operating at 30°C (7971 R Grace oven). The mobile phase used was a mixture ofn-hexane and ethyl acetate (70:30, v/v) at a flow rate of 1 mL/min, and the injection volume was 20lL. The compounds were identified by chromatographic comparisons with authentic standards. Quantification was based on the fluorescence signal response, using the internal standard method. Tocopherol contents in mushroom samples are expressed in lg per g of dry mushroom.
2.4.3. Total bioactive compounds
Bioactive compounds were determined after methanolic extraction of the sam-ples. Phenols, flavonoids, ascorbic acid and carotenoids were determined according to procedures previously described by us (Barros et al., 2007e). For phenolic com-pound determination in the mushroom extracts, 1 mL of sample was mixed with 1 mL of Folin and Ciocalteu’s phenol reagent. After 3 min, 1 mL of saturated sodium carbonate solution was added to the mixture and adjusted to 10 mL with distilled water. The reaction was kept in the dark for 90 min, after which the absorbance was read at 725 nm (Analytikijena 200-2004 spectrophotometer). Gallic acid was used to calculate the standard curve (0.01–0.4 mM; Y= 2.8557X-0.0021; R2= 0.9999) and the results were expressed as mg of gallic acid equivalents (GAEs) per g of extract.
For flavonoid contents determination the mushroom extract (250lL) was mixed with 1.25 mL of distilled water and 75lL of a 5% NaNO2solution. After 5 min, 150lL of a 10% AlCl3H2O solution was added. After 6 min, 500lL of 1 M NaOH and 275lL of distilled water were added to the mixture. The solution was mixed well and the intensity of pink colour was measured at 510 nm. (+)-catechin was used to calculate the standard curve (0.022–0.34 mM; Y= 0.9629X-0.0002; R2= 0.9999) and the results were expressed as mg of (+)-chatequin equivalents (CEs) per g of extract.
For ascorbic acid determination the dried methanolic extract (100 mg) was ex-tracted with 10 mL of 1% metaphosphoric acid for 45 min at room temperature and filtered through Whatman No. 4 filter paper. The filtrate (1 mL) was mixed with 9 mL of 2,6-dichlorophenolindophenol and the absorbance was measured within 30 min at 515 nm against a blank. Content of ascorbic acid was calculated on the basis of the calibration curve of authentic L-ascorbic acid (0.020–0.12 mg/mL; Y= 3.4127X-0.0072;R2= 0.9905) and the results were expressed as mg of ascorbic acid/g of extract.
For b-carotene and lycopene determination the dried methanolic extract (100 mg) was vigorously shaken with 10 mL of acetone–hexane mixture (4:6) for 1 min and filtered through Whatman No. 4 filter paper. The absorbance of the filtrate was measured at 453, 505 and 663 nm. Contents of -carotene and lyco-pene were calculated according to the following equations: lycolyco-pene (mg/ 100 mL) = 0.0458A663 + 0.372A505 0.0806A453; b-carotene (mg/ 100 mL) = 0.216A663 0.304A505 + 0.452A453. The results were expressed aslg of carotenoid/g of extract.
2.5. Antimicrobial activity
The assays were performed in the methanolic extracts after redissolution in DMSO at a concentration of 50 mg/mL.
2.5.1. Microorganisms and culture conditions
Microorganisms labeled CECT were obtained from the Spanish type culture col-lection (CECT) of Valencia University, while microorganisms labeled ESA were clin-ically isolated strains from different biological fluids, identified by Microbiology Laboratory of Escola Superior Agrária de Bragancßa. Gram + (Bacillus cereusCECT 148,B. subtilisCECT 498,Staphylococus aureusESA 7 isolated from pus) and Gram – (Escherichia coliCECT 101,Pseudomonas aeruginosaCECT 108,Klebsiella pneumo-niaeESA 8 isolated from urine) bacteria, and fungi (Candida albicansCECT 1394, Cryptococcus neoformansESA 3 isolated from vaginal fluid) were used to screen samples antimicrobial activity. Microorganisms were cultured aerobically at 37°C (Scientific 222 oven model, 2003) in nutrient agar medium for bacteria, and at 30°C (Scientific 222 oven model, 2003) in sabouraud dextrose agar medium for fungi.
2.5.2. Test assays for antimicrobial activity
A screening of antibacterial activities against the Gram and Gram + bacteria and fungi was performed, and the minimal inhibitory concentration (MIC) was determined by an adaptation of the agar streak dilution method based on radial dif-fusion (Barros et al., 2007b). Suspensions of the microorganisms were prepared to contain approximately 108cfu/mL, and the plates containing agar medium were inoculated (100lL). A 50lL volume of each sample was placed in a hole (depth 3 mm, diameter 4 mm) made in the centre of the agar. Under the same conditions, different DMSO solutions of ampicillin (antibacterial) and cycloheximide (anti-fungal) were used as standards. DMSO was chosen as the best solvent after compar-ative toxicity assays which proved its non toxicity. The MIC was considered to be the lowest concentration of the tested sample able to inhibit the growth of bacteria or fungi, after 24 h. The inhibition halos corresponding to the MICs were measured using a ruler, with an accuracy of 0.5 mm. Each inhibition halo was measured three times (three different plates) and the average was considered. A control using only inoculation was also carried out.
2.6. Statistical analysis
For each one of the mushroom species three samples were analysed and also all the assays were carried out in triplicate. The results are expressed as mean values and standard deviation (SD). The results were analyzed using one-way analysis of variance (ANOVA) followed by Tukey’s HSD Test witha= 0.05, using SAS v. 9.1.3 program.
3. Results
3.1. Nutrient composition
The results of the chemical composition and estimated
ener-getic value (expressed on dry weight basis) of the wild and
com-mercial edible mushrooms are shown in
Table 1
. Protein was
found in high levels and varied between 17.18 g/100 g in
B. edulis
and 80.93 g/100 g in
A. bisporus
. Fat ranged from 0.92 g/100 g in
A. bisporus
and 4.88 g/100 g in
C. cornucopioides
. In general, wild
mushrooms were richer sources of protein and had a lower amount
of fat than commercial mushrooms. Carbohydrates, calculated by
difference, were also an abundant macronutrient and ranged from
8.25 g/100 g in
A. bisporus
and 71.15 g/100 g in
B. edulis
. Reducing
sugars are only a small part of carbohydrates content, being
poly-saccharides such as chitin and starch the most abundant
carbohy-drates in mushrooms. Ash content varied between 7.07 g/100 g in
B. edulis
and 16.48 g/100 g in
A. silvaticus
. Wild mushroom species
proved to be less energetic providing, on average, 1502 kJ per 100 g
of a dry portion, when compared to the 1597 kJ assured by the
commercial sp. The highest energetic value was obtained for the
commercial
B. edulis
, while the wild
A. silvaticus
gave the lowest
energetic contribution (
Table 1
).
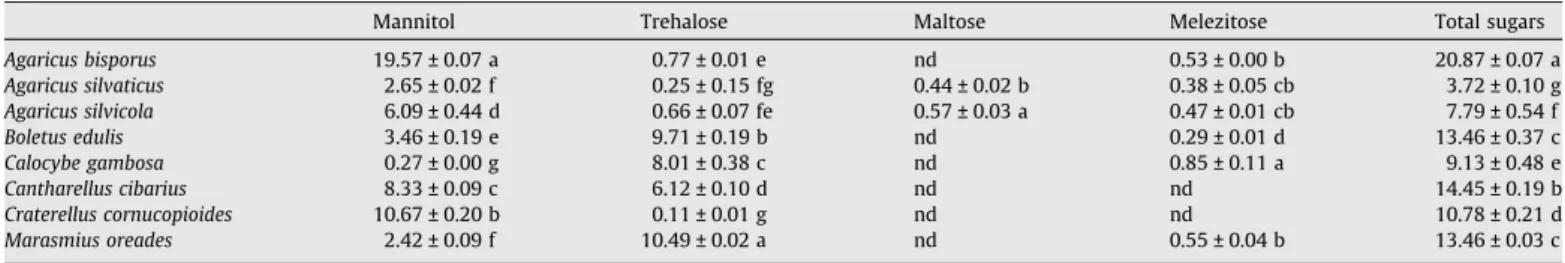
The edible mushrooms contained mannitol and trehalose as the
principal carbohydrates (
Table 2
). The accumulation of these
sug-ars in the fruit-bodies of other species was already reported (
Hara-da et al., 2004; Barros et al., 2007c
). Nevertheless, the present study
also describes the presence of maltose (disaccharide) and
melezi-tose (non-reducing trisaccharide) in some of the studied species.
A. bisporus
revealed the highest sugar contents (20.87 g/100 g),
while
A. silvaticus
revealed the lowest levels (3.72 g/100 g).With
the exception of
A. bisporus
, the commercial species seem to have
higher concentration of sugars. Otherwise, maltose was not found
in none of the commercial mushrooms. This sugar can be broken
down into two glucose molecules by hydrolysis, and the drying
process to which commercial sp. were submitted could be
respon-sible for the degradation of maltose. Melezitose is obtained
especially from exudations of various trees or from honey made
from such exudations, and therefore incorporated by some
mushrooms.
3.2. Nutraceutical composition
The results of fatty acid composition, total saturated fatty
acids (SFA), monounsaturated fatty acids (MUFA), and
polyunsatu-rated fatty acids (PUFA) of the studied mushrooms are shown in
Table 3
. In general, the major fatty acid found in the studied species
was linoleic acid (C18:2), followed by oleic acid (C18:1) and
palmitic acid (C16:0). Besides the three main fatty acids already
described, eighteen more were identified and quantified. PUFA
were the main group of fatty acids in all species with the exception
of
C. cornucopiodes
, where MUFA were the main group. Wild
Agar-icus
sp. contained a lower value of MUFA but also a higher content
of PUFA than the commercial species, due to the higher
contribu-tion of linoleic acid. The commercial
C. gambosa
revealed the
highest SFA values, due to the contribution of palmitic acid.
Never-theless, UFA predominated over SFA in all the studied mushrooms,
ranging from 77% to 85%. The commercial
B. edulis
contained the
highest UFA (85%) and the lowest SFA levels (15%).
Tocopherol contents in the eight studied mushroom, including
three wild (
Barros et al., 2008
) and five commercial species is
pre-sented in
Table 4
.
a
and
b-Tocopherol were found in all species. The
first isomer was found in higher amounts in the wild species, while
significant differences were not observed in
b-tocopherol content
of wild and commercial sp.
c-Tocopherol was only found in the
commercial species.
Table 1
Proximate chemical composition (g/100 g) and energetic value (kJ/100 g) of wild and commercial mushrooms (mean ± SD;n= 3)
Specie Total fat Crude protein Ash Carbohydrates Reducing sugars Energy
Agaricus bisporus 0.92 ± 0.06 d 80.93 ± 3.53 a 9.90 ± 0.05 d 8.25 ± 1.42 d 1.44 ± 0.02 cb 1550.05 ± 21.65 c Agaricus silvaticus 2.05 ± 0.01 c 71.99 ± 4.59 b 16.48 ± 0.23 a 9.49 ± 2.84 d 2.36 ± 0.15 cb 1460.87 ± 23.88 e Agaricus silvicola 2.43 ± 0.22 cb 70.47 ± 2.01 b 14.93 ± 0.66 b 12.18 ± 2.02 d 2.00 ± 0.08 ed 1494.82 ± 13.89 d Boletus edulis 4.60 ± 0.13 a 17.18 ± 0.92 e 7.07 ± 0.59 e 71.15 ± 1.55 a 3.39 ± 0.30 a 1671.83 ± 18.72 a Calocybe gambosa 1.05 ± 0.10 d 47.22 ± 1.32 d 8.72 ± 0.81d 43.01 ± 1.31 b 1.26 ± 0.06 ed 1566.23 ± 11.07 b Cantharellus cibarius 4.49 ± 0.06 a 69.14 ± 3.26 b 12.12 ± 0.26 c 14.25 ± 3.96 d 2.54 ± 0.16 cb 1572.87 ± 22.63 cb Craterellus cornucopioides 4.88 ± 020 a 69.45 ± 1.24 b 12.22 ± 0.81 c 13.44 ± 1.85 d 2.70 ± 0.29 b 1583.78 ± 14.28 b Marasmius oreades 2.99 ± 0.82 b 52.22 ± 2.57 c 11.39 ± 0.09 c 29.41 ± 3.32 c 2.21 ± 0.33 cb 1589.91 ± 12.07 cb
Table 5
presents phenols, flavonoids, ascorbic acid and
carote-noids concentrations obtained in the extracts from the wild (
Barros
et al., accepted for publication
) and commercial mushrooms.
Phe-nols were the major antioxidant component detected in the
ex-tracts (0.88–8.94 mg/g), followed by flavonoids (0.67–3.40 mg/g).
Ascorbic acid was found in small amounts (0.03–0.87 mg/g), and
-carotene and lycopene were only found in vestigial levels
(< 0.01 mg/g). Wild species revealed a higher content in phenols,
but a lower content in ascorbic acid than commercial mushrooms.
3.3. Antimicrobial activity
Table 6
shows the antimicrobial screening of mushroom
extracts against
B. cereus
,
B. subtilis
,
S. aureus
(Gram +),
E. coli
,
P. aeruginosa
,
K. peumoniae
(Gram –) bacteria, and
C. albicans
and
C. neoformans
(fungi).
A. silvaticus
,
C. cornucopioides
,
M. oreades
and
C. gambosa
did not revealed antimicrobial properties, at the
tested concentrations; the other species showed antimicrobial
activity selectively against Gram + bacteria, with very low MICs.
Table 2Sugar composition (g/100 g) of wild and commercial mushrooms (mean ± SD;n= 3)
Mannitol Trehalose Maltose Melezitose Total sugars
Agaricus bisporus 19.57 ± 0.07 a 0.77 ± 0.01 e nd 0.53 ± 0.00 b 20.87 ± 0.07 a
Agaricus silvaticus 2.65 ± 0.02 f 0.25 ± 0.15 fg 0.44 ± 0.02 b 0.38 ± 0.05 cb 3.72 ± 0.10 g
Agaricus silvicola 6.09 ± 0.44 d 0.66 ± 0.07 fe 0.57 ± 0.03 a 0.47 ± 0.01 cb 7.79 ± 0.54 f
Boletus edulis 3.46 ± 0.19 e 9.71 ± 0.19 b nd 0.29 ± 0.01 d 13.46 ± 0.37 c
Calocybe gambosa 0.27 ± 0.00 g 8.01 ± 0.38 c nd 0.85 ± 0.11 a 9.13 ± 0.48 e
Cantharellus cibarius 8.33 ± 0.09 c 6.12 ± 0.10 d nd nd 14.45 ± 0.19 b
Craterellus cornucopioides 10.67 ± 0.20 b 0.11 ± 0.01 g nd nd 10.78 ± 0.21 d
Marasmius oreades 2.42 ± 0.09 f 10.49 ± 0.02 a nd 0.55 ± 0.04 b 13.46 ± 0.03 c
Results are expressed in a dry weight basis. In each column different letters mean significant differences (p <0.05). nd – not detected.
Table 3
Fatty acid composition (percent) of wild and commercial mushrooms (mean ± SD;n= 3)
A. bisporus A. silvaticus A. silvicola B. edulis C. gambosa C. cibarius C. cornucopioides M. oreades
C6:0 0.03 ± 0.00 0.03 ± 0.00 0.06 ± 0.01 0.02 ± 0.00 0.40 ± 0.07 0.67 ± 0.05 0.04 ± 0.00 0.19 ± 0.02
C8:0 0.03 ± 0.00 0.06 ± 0.00 0.06 ± 0.00 0.08 ± 0.00 0.12 ± 0.03 0.04 ± 0.00 0.13 ± 0.01 0.05 ± 0.01
C10:0 0.05 ± 0.00 0.07 ± 0.00 0.06 ± 0.00 0.01 ± 0.00 0.44 ± 0.04 0.01 ± 0.00 0.07 ± 0.00 0.02 ± 0.00
C12:0 0.05 ± 0.01 0.03 ± 0.00 0.03 ± 0.00 0.03 ± 0.00 0.19 ± 0.01 0.03 ± 0.00 0.07 ± 0.01 0.07 ± 0.00
C14:0 0.49 ± 0.02 0.32 ± 0.01 0.30 ± 0.02 0.15 ± 0.00 0.40 ± 0.03 0.13 ± 0.00 0.07 ± 0.01 0.15 ± 0.04
C15:0 1.03 ± 0.02 0.65 ± 0.01 0.85 ± 0.07 0.21 ± 0.00 0.65 ± 0.06 0.31 ± 0.02 0.22 ± 0.00 0.60 ± 0.03
C16:0 9.97 ± 0.03 11.74 ± 0.08 9.96 ± 0.20 10.03 ± 0.28 15.16 ± 1.34 13.08 ± 0.14 6.66 ± 0.29 13.82 ± 0.26
C16:1 0.14 ± 0.02 0.76 ± 0.01 0.58 ± 0.04 0.53 ± 0.00 0.88 ± 0.08 0.49 ± 0.03 0.18 ± 0.01 1.00 ± 0.09
C17:0 0.68 ± 0.01 0.39 ± 0.00 0.92 ± 0.01 0.15 ± 0.00 0.20 ± 0.02 0.19 ± 0.01 0.13 ± 0.00 0.07 ± 0.02
C18:0 4.08 ± 0.10 1.41 ± 0.00 2.64 ± 0.20 2.75 ± 0.06 2.14 ± 0.27 6.49 ± 0.11 7.83 ± 0.40 1.65 ± 0.22
C18:1n9c 1.30 ± 0.05 6.67 ± 0.01 3.49 ± 0.20 39.72 ± 1.64 18.10 ± 0.68 10.78 ± 0.34 51.85 ± 0.45 28.52 ± 1.72 C18:2n6c 75.72 ± 0.15 74.78 ± 0.01 76.50 ± 0.21 44.32 ± 2.02 57.75 ± 0.98 53.59 ± 0.12 23.67 ± 1.37 50.66 ± 0.63
C18:3n3 0.06 ± 0.00 0.10 ± 0.00 0.05 ± 0.00 0.07 ± 0.01 0.45 ± 0.07 0.08 ± 0.01 0.07 ± 0.01 0.07 ± 0.01
C20:0 2.13 ± 0.01 0.85 ± 0.01 1.77 ± 0.00 0.44 ± 0.02 0.33 ± 0.02 0.31 ± 0.02 0.32 ± 0.02 0.30 ± 0.03
C20:1c 0.07 ± 0.01 0.13 ± 0.00 0.12 ± 0.00 0.49 ± 0.03 nd 11.48 ± 0.02 7.57 ± 0.05 nd
C20:2c 0.21 ± 0.01 0.15 ± 0.00 nd 0.14 ± 0.00 0.12 ± 0.01 0.17 ± 0.00 0.05 ± 0.01 0.20 ± 0.01
C20:3n3+C21:0 0.42 ± 0.03 0.21 ± 0.03 0.36 ± 0.00 0.03 ± 0.00 0.12 ± 0.03 0.23 ± 0.02 nd 0.03 ± 0.00
C22:0 1.62 ± 0.00 0.81 ± 0.03 1.30 ± 0.18 0.30 ± 0.01 0.59 ± 0.05 0.38 ± 0.03 0.35 ± 0.05 0.59 ± 0.05
C23:0 0.37 ± 0.01 0.21 ± 0.03 0.15 ± 0.01 0.04 ± 0.00 0.87 ± 0.06 0.11 ± 0.01 0.05 ± 0.00 0.22 ± 0.02
C24:0 1.56 ± 0.02 0.55 ± 0.03 0.69 ± 0.01 0.31 ± 0.00 0.99 ± 0.03 0.88 ± 0.06 0.43 ± 0.02 1.16 ± 0.08
C24:1 nd 0.11 ± 0.01 0.05 ± 0.00 0.17 ± 0.00 0.07 ± 0.01 0.55 ± 0.04 0.24 ± 0.00 0.65 ± 0.05
SFA 22.08 ± 0.19 a 17.10 ± 0.01 c 18.80 ± 0.46 b 14.52 ± 0.33 d 22.51 ± 0.54 a 22.63 ± 0.24 a 16.36 ± 0.86 c 18.88 ± 0.86 b MUFA 1.52 ± 0.06 h 7.67 ± 0.02 f 4.25 ± 0.24 g 40.91 ± 1.67 b 19.05 ± 0.58 e 23.29 ± 0.25 d 59.85 ± 0.51 a 30.16 ± 1.39 c PUFA 76.41 ± 0.13 a 75.23 ± 0.02 a 76.95 ± 0.22 a 44.56 ± 2.01 e 58.42 ± 1.12 b 54.08 ± 0.01 c 23.79 ± 1.37 f 50.96 ± 0.53 d
In each row different letters mean significant differences (p <0.05).
nd – not detected; C – carbon atoms; SFA – saturated fatty acids; MUFA – monounsaturated fatty acids; PUFA – polyunsaturated fatty acids.
Table 4
Tocopherol composition (lg/g) of the wild and commercial mushrooms (mean ± SD;n= 3)
a-tocopherol b-tocopherol c-tocopherol Total
Agaricus bisporusa 0.75 ± 0.04 b 1.66 ± 0.01 b nd 2.41 ± 0.05 cb
Agaricus silvaticusa 0.49 ± 0.03 c 0.68 ± 0.05 c nd 1.16 ± 0.08 ed
Agaricus silvicolaa 1.30 ± 0.01 a 1.93 ± 0.01 b nd 3.23 ± 0.00 b
Boletus edulis 0.32 ± 0.04 d 8.90 ± 0.77 a 1.42 ± 0.07 a 10.65 ± 0.84 a
Calocybe gambosa 0.06 ± 0.00 f 0.20 ± 0.02 c 0.14 ± 0.02 c 0.41 ± 0.01 ef
Cantharellus cibarius 0.12 ± 0.00 f 0.03 ± 0.01 c 0.03 ± 0.00 d 0.18 ± 0.01 f
Craterellus cornucopioides 0.24 ± 0.02 e 1.55 ± 0.05 b 0.08 ± 0.01 dc 1.87 ± 0.02 cd
Marasmius oreades 0.06 ± 0.00 f 0.19 ± 0.09 c 1.30 ± 0.09 b 1.55 ± 0.05 d
In each column different letters mean significant differences (p <0.05). nd – not detected.
a Barros et al., 2008.
C. cibarius
and
A. bisporus
revealed MIC values against
B. subtilis
even lower than the standard ampicillin. Likewise,
B. edulis
and
A.
silvicola
revealed MIC values against
S. aureus
lower than the
stan-dard. The antimicrobial activity was not dependent of being
com-mercial or wild mushroom, since
A. bisporus
and
A. silvicola
of the
wild sp., and
B. edulis
and
C. cibarius
of the commercial sp. showed
antimicrobial efficiency; it certainly depends on antimicrobials
present in each mushroom species.
4. Discussion
Among all the studied species, only the chemical composition of
A. bisporus
(
Manzi et al., 2001; Krbavcˇic´ and Baric´, 2004
),
B. edulis
(
Manzi et al., 2004
) and
C. cibarius
(
Agahar-Murugkar and
Sub-bulakshmi, 2005
) was described previously but from different
countries. Similar to our samples, the Indian
C. cibarius
contained
protein as the principal macronutrient, while in the Italian
B. edulis
,
carbohydrates dominated. The Italian
A. bisporus
sample contained
higher levels of carbohydrate than proteins, while the opposite was
observed in the Portuguese sample. Generally, high protein and
carbohydrate contents, and low fat levels were also described by
previous authors (
Diéz and Alvarez, 2001
). Nevertheless, the
differ-ences between the nutrient concentrations of Portuguese and
In-dian
C. cibarius
samples and between the Portuguese and Italian
B. edulis
and
A. bisporus
may be attributed to a number of factors,
such as mushroom strain/type, composition of growth media, time
of harvest, management techniques, handling conditions, and the
preparation of the substrates (
Manzi et al., 2001
). The wild
mush-room species proved to be less energetic than the commercial
sam-ples with a higher content of protein and a lower fat concentration.
UFA predominated over SFA in all the studied mushrooms,
which is consistent with other studies (
Diéz and Alvarez, 2001
).
The commercial
B. edulis
contained the highest UFA contents and
the lowest SFA levels, leading to an increase in HDL cholesterol
and decrease in LDL cholesterol, triacylglycerol, lipid oxidation,
and LDL susceptibility to oxidation (
Kanu et al., 2007
). The same
species revealed the highest contents of tocopherols. Some authors
published tocopherol determination in
A. bisporus
from Turkey
(
Elmastas et al., 2007
) and
B. edulis
from Taiwan (
Tsai et al.,
2007
), but using a different methodology and presenting the
sults per mg of extracts. In general, the commercial mushrooms
re-vealed higher concentrations of sugars, and the wild species
contained lower values of MUFA but also higher contents of PUFA.
a-Tocopherol was detected in higher amounts in the wild species,
and
c-tocopherol was not found in these mushrooms. Wild
sam-ples revealed a higher content in phenols, but a lower content in
ascorbic acid than commercial mushrooms.
There were no differences between the antimicrobial properties
of wild and commercial mushrooms. The entire extracts were used
to measure potential health benefits taking advantage of the
addi-tive and synergistic effects of all the bioacaddi-tive compounds present
in the extracts. Therefore, mushrooms might be used not only for
their nutritional properties but also as a source for the
develop-ment of drugs and nutraceuticals. Future studies should be done
in order to conclude the mechanism of action involved in
antimi-crobial growth inhibition; there might be other compounds,
besides those quantified in this study, which contribute to
antimi-crobial properties of the wild and commercial species. The
bioac-tive compounds present in the extracts could be structurally
related to e.g. vancomycin or bacitracin which are only effective
against Gram + bacteria.
Recently, the widely consumed
Tricholoma flavovirens
caused
delayed rhabdomyolysis in twelve humans from France and
Po-land, and also in mice after administration of consecutive meals
Table 5Total bioactive compounds of wild and commercial mushrooms (mean ± SD;n= 3)
Phenols (mg/g) Flavonoids (mg/g) Ascorbic acid (mg/g) b-carotene (lg/g) Lycopene (lg/g)
Agaricus bisporusa 4.49 ± 0.16 d 1.73 ± 0.11 d 0.03 ± 0.00 c 1.95 ± 0.10 g 0.91 ± 0.06 eb
Agaricus silvaticusa 8.94 ± 0.44 a 3.40 ± 0.01 a 0.04 ± 0.00 c 5.42 ± 0.10 d 2.63 ± 0.06 c
Agaricus silvicolaa 6.18 ± 0.44 b 2.87 ± 0.12 b 0.04 ± 0.00 c 3.02 ± 0.12 e 2.63 ± 0.06 d
Boletus edulis 5.03 ± 0.11 c 1.75 ± 0.13 d nd 2.73 ± 0.32 fe 1.14 ± 0.08 b
Calocybe gambosa 1.70 ± 0.10 g 1.18 ± 0.16 e 0.40 ± 0.01 b 6.41 ± 1.27 c 3.30 ± 0.88 b
Cantharellus cibarius 0.88 ± 0.09 h 0.67 ± 0.11 f 0.86 ± 0.01 a 13.56 ± 0.51 a 5.06 ± 0.33 a
Craterellus cornucopioides 2.13 ± 0.38 f 1.71 ± 0.29 d 0.87 ± 0.02 a 12.77 ± 0.19 b 5.13 ± 0.14 a
Marasmius oreades 3.20 ± 0.30 e 2.26 ± 0.18 c nd 1.99 ± 0.14 fg 0.54 ± 0.08 e
In each column different letters mean significant differences (p <0.05). nd – not detected.
aBarros et al., accepted for publication.
Table 6
Antimicrobial activity of wild and commercial mushrooms (mean ± SD;n= 3)
Samples MIC (lg/mL)
B. cereus B. subtilis S. aureus P. aeruginosa E. coli K. peumoniae C. albicans C. neoformans
Agaricus bisporus 500 ( ) 5 (++++) 500 ( ) 500 ( ) 500 ( ) 500 ( ) 500 ( ) 500 ( )
Agaricus silvaticus 500 ( ) 500 ( ) 500 ( ) 500 ( ) 500 ( ) 500 ( ) 500 ( ) 500 ( )
Agaricus silvicola 5 (++++) 50 (++++) 5 (++++) 500 ( ) 500 ( ) 500 ( ) 500 ( ) 500 ( )
Boletus edulis 500 ( ) 500 ( ) 5 (++++) 500 ( ) 500 ( ) 500 ( ) 500 ( ) 500 ( )
Calocybe gambosa 500 ( ) 500 ( ) 500 ( ) 500 ( ) 500 ( ) 500 ( ) 500 ( ) 500 ( )
Cantharellus cibarius 500 ( ) 5 (++++) 50 (++++) 500 ( ) 500 ( ) 500 ( ) 500 ( ) 500 ( )
Craterellus cornucopioides 500 ( ) 500 ( ) 500 ( ) 500 ( ) 500 ( ) 500 ( ) 500 ( ) 500 ( )
Marasmius oreades 500 ( ) 500 ( ) 500 ( ) 500 ( ) 500 ( ) 500 ( ) 500 ( ) 500 ( )
Ampicillin 3.13 (++++) 12.5 (++++) 6.25 (++++) 6.25 (++++) 6.25 (++++) 6.25 (++++) NT NT
Cycloheximide NT NT NT NT NT NT 12.5 (++) 6.25 (++++)
of extracts of this mushroom (
Bedry et al., 2001
). The investigation
was extended, first to
B. edulis
(
Nieminen et al., 2005
) and then to
other species such as
C. cibarius
,
Russula
spp.,
Leccinum versipelle
,
Albatrellus ovinus
, (
Nieminen et al., 2006
). The results indicated
ele-vations in the plasma creatine kinase activities and additional
ef-fects on the liver transaminases and plasma creatinine in
experimental mice. There has also been a concern about the safety
of
A. bisporus
, an extensively consumed mushroom worldwide.
Some authors demonstrated that lifetime administration of
un-cooked
A. bisporus
to mice induced tumours at a number of sites.
However, when air-dried mushroom were fed to rats for 500 days,
no carcinogenic effect was evident (
Walton et al., 1998
). Other
authors suggested that diets high in
A. bisporus
may modulate
the aromatase activity and function in chemoprevention in
post-menopausal women by reducing the
in situ
production of estrogen
(
Grube et al., 2001
). However, these findings should be interpreted
carefully since these wild mushrooms have been considered safe
for millennia. The harmful effects require prolonged daily exposure
and high amounts of ingested mushroom (
Nieminen et al., 2005
).
The analyzed mushrooms contain very useful nutraceuticals
such as UFA, phenolics, tocopherols, ascorbic acid, and carotenoids
which could be extracted for the purpose of being used as
func-tional ingredients namely against microbial infections. Public
health authorities consider prevention and treatment with
nutra-ceuticals a powerful instrument in maintaining and promoting
health, longevity and life quality. The beneficial effects of
nutraceu-ticals will undoubtedly have an impact on nutritional therapy;
they also represent a growing segment of today’s food industry.
Be-sides, these mushrooms might be used directly in diet and promote
health, taking advantage of the additive and synergistic effects of
all the bioactive compounds present.
Conflict of interest statement
The authors declare that there are no conflicts of interest.
Acknowledgement
The authors are grateful to Foundation for Science and
Technol-ogy (PPCDT/AGR/56661/2004) for financial support of this work.
References
Agahar-Murugkar, D., Subbulakshmi, G., 2005. Nutritional value of edible wild mushrooms collected from the Khasi hills of Meghalaya. Food Chem. 89, 599– 603.
Andlauer, W., Fürst, P., 2002. Nutraceuticals: a piece of history, present status and outlook. Food Res. Int. 35, 171–176.
AOAC, 1995. Official methods of analysis. 16th ed., Arlington VA, USA: Association of Official Analytical Chemists.
Barros, L., Ferreira, M.-J., Queirós, B., Ferreira, I.C.F.R., Baptista, P., 2007a. Total phenols, ascorbic acid, (-carotene and lycopene in Portuguese wild edible mushrooms and their antioxidant activities. Food Chem. 103, 413–419. Barros, L., Calhelha, R.C., Vaz, J.A., Ferreira, I.C.F.R., Baptista, P., Estevinho, L.M.,
2007b. Antimicrobial activity and bioactive compounds of Portuguese wild edible mushrooms. Eur. Food Res. Technol. 225, 151–156.
Barros, L., Baptista, P., Correia, D.M., Casal, S., Oliveira, B., Ferreira, I.C.F.R., 2007c. Fatty acid and sugar compositions, and nutritional value of five wild edible mushrooms from Northeast Portugal. Food Chem. 105, 140–145.
Barros, L., Baptista, P., Correia, D.M., Morais, J.S., Ferreira, I.C.F.R., 2007d. Effects of conservation treatment and cooking on the chemical composition and antioxidant activity of Portuguese wild edible mushrooms. J. Agri. Food Chem. 55, 4781–4788.
Barros, L., Baptista, P., Ferreira, I.C.F.R., 2007e. Effect ofLactarius piperatusfruiting body maturity stage on antioxidant activity measured by several biochemical assays. Food Chem. Toxicol. 45, 1731–1737.
Barros, L., Correia, D.M., Ferreira, I.C.F.R., Baptista, P., Buelga, C.S., 2008. Optimization of the determination of tocopherols in Agaricus sp. edible mushrooms by a normal phase liquid chromatographic method. Food Chem. 110, 1046–1050.
Barros, L., Falcão, S., Baptista, P., Freire, C., Vilas-Boas, M., Ferreira, I.C.F.R., accepted for publication. Antioxidant activity of Agaricus sp. mushrooms by chemical, biochemical and electrochemical assays. Food Chem.
Bazzano, L.A., He, J., Ogden, L.G., 2001. Legume consumption and risk of coronary heart disease in US men and women: NHANES I epidemiologic follow-up study. Arch. Int. Med. 161, 2573–2578.
Bedry, R., Baudrimont, I., Deffieux, G., Creppy, E.E., Pomies, J.P., Ragnaud, J.M., Dupon, M., Neau, D., Gabinski, C., De Witte, S., Chapalain, J.C., Godeau, P., 2001. Wild-mushroom intoxication as a cause of rhabdomyolysis. New Engl. J. Med. 345, 798–802.
Çag˘larirmak, N., 2007. The nutrients of exotic mushrooms (Lentinulaedodes and Pleurotusspecies) and an estimated approach to the volatile compounds. Food Chem. 105, 1188–1194.
Courtecuisse, R., Duhem, B., 1995. In Mushrooms and Toadstools of Britain and Europe. HarperCollins Publishers, London.
Diéz, V.A., Alvarez, A., 2001. Compositional and nutritional studies on two wild edible mushrooms from northwest Spain. Food Chem. 75, 417–422. Elmastas, M., Isildak, O., Turkekul, I., Temur, N., 2007. Determination of antioxidant
activity and antioxidant compounds in wild edible mushrooms. J. Food Comp. Anal. 20, 337–345.
Fang, Y.Z., Yang, S., Wu, G., 2002. Free radicals, antioxidants, and nutrition. Nutrition 18, 872–879.
Fürst, P., Kuhn, K.S., 2000. Fish oil emulsions: what benefits can they bring? Clin. Nutrition 19, 7–14.
Grube, B.J., Eng, E.T., Kao, Y.-C., Kwon, A., Chen, S., 2001. White button mushroom phytochemicals inhibit aromatase activity and breast cancer cell proliferation. J. Nutr. 131, 3288–3293.
Harada, A., Gisusi, S., Yoneyama, S., Aoyama, M., 2004. Effects of strain and cultivation medium on the chemical composition of the taste components in fruit-body ofHypsizygus marmoreus. Food Chem. 84, 265–270.
Hatvani, N., 2001. Antibacterial effect of the culture fluid of Lentinus edodes mycelium grown in submerged liquid culture. Int. J. Antimicrob. Agents 17, 71– 74.
Hirasawa, M., Shouji, N., Neta, T., Fukushima, K., Takada, K., 1999. Three kinds of antibacterial substances fromLentinus edodes(Berk.) Sing. (Shiitake, an edible mushroom). Int. J. Antimicrob. Agents 11, 151–157.
Kanu, P.J., Zhu, K., Kanu, J.B., Zhou, H., Qian, H., Zhu, K., 2007. Biologically active components and nutraceuticals in sesame and related products: a review and prospect. Trends Food Sci. Technol. 18, 599–608.
Krbavcˇic´, I.P., Baric´, I.C., 2004. Influence of deep fat frying on some nutritional parameters of novel food based on mushrooms and fresh soft cheese. Food Chem. 84, 417–419.
Kruger, C.L., Mann, S.W., 2003. Safety evaluation of functional ingredients. Food Chem. Toxicol. 41, 793–805.
Lindequist, U., Niedermeyer, T.H.J., Julich, W.-D., 2005. The pharmacological potential of mushrooms. eCAM 2, 285–299.
Liu, R.H., 2003. Health benefits of fruits and vegetables are from additive and synergistic combination of phytochemicals. Am. J. Clin. Nutr. 78, 517S–520S. Lo, K.M., Cheung, P.C.K., 2005. Antioxidant activity of extracts from the fruiting
bodies ofAgrocybe aegeritavar. alba.. Food Chem. 89, 533–539.
Manzi, P., Aguzzi, A., Pizzoferrato, L., 2001. Nutritional value of mushrooms widely consumed in Italy. Food Chem. 73, 321–325.
Manzi, P., Marconi, S., Aguzzi, A., Pizzoferrato, L., 2004. Commercial mushrooms: nutritional quality and effect of cooking. Food Chem. 84, 201–206.
Mau, J.-L., Lin, H.-C., Chen, C.-C., 2002. Antioxidant properties of several medicinal mushrooms. J. Agri. Food Chem. 50, 6072–6077.
Moser, M., 1983. In Keys to Agarics and Boleti (Polyporales, Boletales, Agaricales, Russulales). Roger Phillips, London.
Nieminen, P., Mustonen, A.-M., Kirsi, M., 2005. Increased plasma creatine kinase activities triggered by edible wild mushrooms. Food Chem. Toxicol. 43, 133– 138.
Nieminen, P., Kirsi, M., Mustonen, A.-M., 2006. Suspected myotoxicity of edible wild mushrooms. Exp. Biol. Med. 231, 221–228.
Ribeiro, B., Valentão, P., Baptista, P., Seabra, R.M., Andrade, P.B., 2007. Phenolic compounds, organic acids profiles and antioxidative properties of beefsteak fungus (Fistulina hepatica). Food Chem. Toxicol. 45, 1805–1813.
Smânia Jr., A., Monache, F.D., Smânia, E.F., Gil, M.L., Benchetrit, L.C., Cruz, F.S., 1995. Antibacterial activity of a substance produced by the fungus Pycnoporus sanguineus(Fr.) Murrill. J. Ethnopharmacol. 45, 177–181.
Soobrattee, M.A., Neergheen, V.S., Luximon-Ramma, A., Aruoma, O.I., Bahorun, T., 2005. Phenolics as potential antioxidant therapeutic agents: mechanism and actions. Mutation Res. 579, 200–213.
Tsai, S.-Y., Tsai, H.-L., Mau, J.-L., 2007. Antioxidant properties ofAgaricus blazei, Agrocybe cylindracea, and Boletus edulis. LWT 40, 1392–1402.
Turkoglu, A., Duru, M.E., Mercan, N., Kivrak, I., Gezer, K., 2007. Antioxidant and antimicrobial activities ofLaetiporus sulphureus(Bull) Murrill. Food Chem. 101, 267–273.
Walton, K., Walker, R., Ioannides, C., 1998. Effect of baking and freeze-drying on the direct and indirect mutagenicity of extracts from the edible mushroomAgaricus bisporus. Food Chem. Toxicol. 36, 315–320.
Wasser, S.P., Weis, A.L., 1999. Medicinal properties of substances occurring in higher basidiomycetes mushrooms: current perspectives (review). Int. J. Med. Mushrooms 1, 31–62.