Nutritional and antioxidant contributions of
Laurus nobilis
L. leaves:
would be more suitable a wild or a cultivated sample?
Maria Inês Diasa,b, Lillian Barrosa, Montserrat Dueñasc, Rita C. Alvesb, M. Beatriz P.P. Oliveirab, Celestino Santos-Buelgac, Isabel C.F.R. Ferreiraa,*
a
Mountain Research Center (CIMO), ESA, Polytechnic Institute of Bragança, Campus
de Santa Apolónia, 1172, 5301-855 Bragança, Portugal.
b
REQUIMTE, Science Chemical Department, Faculty of Pharmacy of University of
Porto, Rua Jorge Viterbo Ferreira, 228, 4050-313 Porto, Portugal.
c
GIP-USAL, Facultad de Farmacia, Universidad de Salamanca, Campus Miguel de
Unamuno, 37007 Salamanca, Spain.
*Corresponding author. Tel.+351 273 303219; fax +351 273 325405.
Abstract
Medicinal and aromatic plants are used since ancient times in folk medicine and traditional food, but also in novel pharmaceutical preparations. The controversy lies in the use of cultivated and/or wild plants presenting both advantages and disadvantages in biological, ecological but also economic terms. Herein, cultivated and wild samples of
Laurus nobilis L. were chemically characterized regarding nutritional value, free sugars, organic acids, fatty acids and tocopherols. Furthermore, the antioxidant activity (scavenging activity, reducing power and lipid peroxidation inhibition) and individual phenolic profile of L. nobilis extracts and infusions were evaluated. Data showed that the wild sample gave higher nutritional contribution related to a higher content of proteins, free sugars, organic acids, PUFA and tocopherols. It also gave better PUFA/SFA and n-6/n-3 ratios. Regarding antioxidant activity and phenolic compounds, it was the cultivated sample (mostly the infusion) that showed the highest values. The present study supports the arguments defending the use of wild and cultivated medicinal and aromatic plants as both present very interesting features, whether nutritional or antioxidant, that can be an assessed by their consumption. In vitro culture could be applied to L. nobilis as a production methodology that allows combination of the benefits of wild and cultivated samples.
1. Introduction
Currently, there is a major controversy concerning the use of wild or cultivated plants, presenting both advantages and disadvantages in biological and ecological, but also economic terms (Schippmann, Leaman, & Cunningham, 2002). Due to the growing demand of global market, FAO (Food and Agricultural Organization) recommended the cultivation of medicinal and aromatic plants, not only from the point of view of sustainability but also because it allows better control of biotic and abiotic production conditions, representing a reliable resource of raw material that has gained great economic importance (Schippmann et al, 2002). Being used since ancient times for their organoleptic characteristics, therapeutic and medicinal properties, it is crucial to preserve the genetic-pool resources that these plants represent (Guarrera & Savo, 2013). On the other hand, the use of wild medicinal and aromatic plants by many local populations provides herbal medicines for health care needs encouraging their protection and maintenance, not requiring the use of pesticides neither investments in infrastructures to produce them (Schippmann et al, 2002).
Laurus nobilis L., commonly known as bay leaves, belongs to Laureacea family, being a native plant from the warm Mediterranean region, including countries like Italy, France, Spain and Portugal. It is widely used as a spicy fragrance and flavor in traditional meat dishes, stews and rice (Camejo-Rodrigues, Ascenção, Bonet, & Valles, 2003; Gómez-Coronado & Barbas, 2003; Ouchikh et al, 2011). Its leaves and extracts are used to suppress high blood sugar, fungal and bacterial infections, to treat eructation, flatulence and gastrointestinal problems. It also exhibits anti-inflammatory, anticonvulsive, antiepileptic and antioxidant properties (Ferreira, Proença, Serralheiro, & Araújo, 2006; Conforti, Statti, Uzunov, & Menichini, 2006; Ozcan, Esen, Sangun,
2011; Ramos et al, 2012). Infusions of dry bay leaves are used in folk medicine for their stomachic and carminative remedies and also to treat gastric diseases (Afifi, Khalil, Tamimi, & Disi, 1997; Dall’Acqua et al, 2009).
Tocopherols content of L. nobilis was reported on aerial parts (Demo, Petrakis, Kefalas, & Boskou, 1998; Gómez-Coronado & Barbas, 2003; Gómez-Coronado, Ibañez,
Ruperéz, & Barbas, 2004) and vegetative organs (Ouchikh et al, 2011); fatty acids composition was studied on seeds (Ozcan et al., 2010).
Antioxidant activity of wild L. nobilis leaves was previously reported on ethanol and aqueous extracts (Elmastaş et al., 2006; Emam, Mohamed, Diab, & Megally, 2010;
Kaurinovic, Popovic, & Vlaisavljevic, 2010; Ramos et al., 2012), methanol/water
extracts (Conforti et al., 2006) and infusions (Dall’Acqua et al., 2009). Flavonoids such as quercetin, luteolin, apigenin, kaempferol and myrcetin derivatives as well as flavan-3-ols have been reported as the most abundant phenolic compounds found in bay leaves (Škerget et al, 2005; Dall’Acqua et al., 2009; Lu, Yuan, Zeng, & Chen, 2011). The hydroxyl groups attached to the ring structure of flavonoids conferred them antioxidant properties, acting as reducing agents, hydrogen donators, metal chelators and radical scavengers, preventing oxidative stress, the main cause of cell death (Carocho & Ferreira, 2013).
In the present work, L. nobilis wild and cultivated samples were chemically characterized regarding nutritional value, free sugars, organic acids, fatty acids and tocopherols. Furthermore, as far as we know, this is the first study comparing antioxidant activity and phenolic compounds of extracts and infusions of L. nobilis
2. Materials and methods
2.1. Samples
The cultivated Laurus nobilis L. sample (air-dried leaves) was purchased from a local company, Ervital from Castro Daire, Portugal, which produces Mediterranean herbs using organic principles and methods. According to the label information, the leaves were collected in 2012. The wild sample (fresh leaves) was collected in 2012 autumn in Bragança, Portugal, and further air-dried. Both samples were lyophilized (FreeZone 4.5, Labconco, Kansas, USA) in order to preserve as most as possible their chemical composition until analysis. Afterwards, each sample was reduced to a fine dried powder (20 mesh) and mixed to obtain homogenate sample.
2.2. Standards and Reagents
Acetonitrile 99.9%, n-hexane 95% and ethyl acetate 99.8% were of HPLC grade from Fisher Scientific (Lisbon, Portugal). Trolox (6-hydroxy-2,5,7,8-tetramethylchroman-2-carboxylic acid) and the fatty acids methyl ester (FAME) reference standard mixture 37 (standard 47885-U) was purchased from Sigma (St. Louis, MO, USA), as also were other individual fatty acid isomers, L-ascorbic acid, tocopherol, sugar and organic acid standards. Phenolic compound standards were from Extrasynthese (Genay, France). Racemic tocol, 50 mg/mL, was purchased from Matreya (Pleasant Gap, PA USA). 2,2-Diphenyl-1- picrylhydrazyl (DPPH) was obtained from Alfa Aesar (Ward Hill, MA, USA). Water was treated in a Milli-Q water purification system (TGI Pure Water Systems, USA).
2.3.1 Proximate composition and energetic value. The samples were analysed for proteins, fat, carbohydrates and ash using the AOAC procedures (AOAC, 1995). The crude protein content (N×6.25) of the samples was estimated by the macro-Kjeldahl method; the crude fat was determined by extracting a known weight of powdered sample with petroleum ether, using a Soxhlet apparatus; the ash content was determined by incineration at 600±15 oC. Total carbohydrates were calculated by difference. Energy was calculated according to the following equation: Energy (kcal) = 4 × (g protein) + 3.75 × (g carbohydrate) + 9 × (g fat).
2.3.2 Sugars. Free sugars were determined by high performance liquid chromatography
coupled to a refraction index detector (HPLC-RI), after an extraction procedure previously described by the authors(Guimarães et al, 2013) using melezitose as internal standard (IS). The equipment consisted of an integrated system with a pump (Knauer, Smartline system 1000), degasser system (Smartline manager 5000), auto-sampler (AS-2057 Jasco) and an RI detector (Knauer Smartline 2300). Data were analysed using Clarity 2.4 Software (DataApex). The chromatographic separation was achieved with a Eurospher 100-5 NH2 column (4.6×250 mm, 5 mm, Knauer) operating at 30 ºC (7971 R Grace oven). The mobile phase was acetonitrile/deionized water, 70:30 (v/v) at a flow rate of 1 mL/min. The compounds were identified by chromatographic comparisons with authentic standards analysed in the same conditions. Quantification was performed using the internal standard method and sugar contents were further expressed in g per 100 g of dry weight.
performed using a Shimadzu 20A series UFLC (Shimadzu Corporation). Separation was achieved on a SphereClone (Phenomenex) reverse phase C18 column (5 µm, 250 mm × 4.6 mm i.d.) thermostatted at 35 ºC. The elution was performed with sulphuric acid 3.6 mM using a flow rate of 0.8 mL/min. Detection was carried out in a PDA, using 215 nm and 245 nm (for ascorbic acid) as preferred wavelengths. The organic acids found were quantified by comparison of the area of their peaks recorded at 215 nm with calibration curves obtained from commercial standards of each compound. The results were expressed in g per 100 g of dry weight.
2.3.4. Fatty acids. Fatty acids were determined by gas-liquid chromatography with flame ionization detection (GC-FID)/capillary column as described previously by the authors (Guimarães et al, 2013). The analysis was carried out with a DANI model GC 1000 instrument equipped with a split/splitless injector, a flame ionization detector (FID at 260 ºC) and a Macherey–Nagel column (30 m × 0.32 mm × 0.25 μm). The oven temperature program was as follows: the initial temperature of the column was 50 ºC, held for 2 min, then a 30 ºC/min ramp to 125 ºC, 5 ºC/min ramp to 160 ºC, 20 ºC/ min ramp to 180 ºC, 3 ºC/min ramp to 200 ºC, 20 ºC/min ramp to 220 ºC and held for 15 min. The carrier gas (hydrogen) flow-rate was 4.0 mL/min (0.61 bar), measured at 50 ºC. Split injection (1:40) was carried out at 250 ºC. Fatty acid identification was made by comparing the relative retention times of FAME peaks from samples with those of standards. The results were recorded and processed using the CSW 1.7 Software (DataApex 1.7) and expressed in relative percentage of each fatty acid.
(equipment described above), and a fluorescence detector (FP-2020; Jasco) programmed for excitation at 290 nm and emission at 330 nm. The chromatographic separation was achieved with a Polyamide II (250 mm × 4.6 mm i.d.) normal-phase column from YMC Waters operating at 30 ºC. The mobile phase used was a mixture of n-hexane and ethyl acetate (70:30, v/v) at a flow rate of 1 mL/min, and the injection volume was 20 µL. The compounds were identified by chromatographic comparisons with authentic standards. Quantification was based on the fluorescence signal response of each standard, using the IS (tocol) method and by using calibration curves obtained from commercial standards of each compound. The results were expressed in mg per 100 g of dry weight.
2.4. Antioxidants contribution of wild and cultivated samples
2.4.1 Methanolic extract and infusion preparations. The methanolic extract was obtained from the wild and cultivated plant material. Each sample (1 g) was extracted twice by stirring with 30 mL of methanol (25 ºC at 150 rpm) for 1 h and subsequently filtered through Whatman No. 4 paper (Guimarães et al, 2013). The combined methanolic extracts were evaporated at 40 ºC (rotary evaporator Büchi R-210) to dryness.
For infusion preparation the plant material (1 g) was added to 200 mL of boiling distilled water and left to stand at room temperature for 5 min, and then filtered under reduced pressure (Guimarães et al, 2013). The obtained infusion was frozen and lyophilized.
for antioxidant activity evaluation. The final solutions were further diluted to different concentrations to be submitted to the following assays. DPPH radical-scavenging activity was evaluated by using an ELX800 microplate reader (Bio-Tek Instruments, Inc; Winooski, USA), and calculated as a percentage of DPPH discolouration using the formula: [(ADPPH-AS)/ADPPH] × 100, where AS is the absorbance of the solution containing the sample at 515 nm, and ADPPH is the absorbance of the DPPH solution. Reducing power was evaluated by the capacity to convert Fe3+ into Fe2+, measuring the absorbance at 690 nm in the microplate reader mentioned above. Inhibition of β-carotene bleaching was evaluated though the β-carotene/linoleate assay; the neutralization of linoleate free radicals avoids β-carotene bleaching, which is measured by the formula: β-carotene absorbance after 2h of assay/initial absorbance) × 100. Lipid peroxidation inhibition in porcine (Sus scrofa) brain homogenates was evaluated by the decreasing in thiobarbituric acid reactive substances (TBARS); the colour intensity of the malondialdehyde-thiobarbituric acid (MDA-TBA) was measured by its absorbance at 532 nm; the inhibition ratio (%) was calculated using the following formula: [(A - B)/A] × 100%, where A and B were the absorbance of the control and the sample solution, respectively (Guimarães et al, 2013). The final results were expressed in EC50 values (mg/mL), sample concentration providing 50% of antioxidant activity or 0.5 of absorbance in the reducing power assay). Trolox was used as positive control.
the HPLC system via the DAD cell outlet. The phenolic compounds were characterized according to their UV and mass spectra and retention times, and comparison with authentic standards when available. For quantitative analysis, calibration curves were prepared from different standard compounds: catechin (y=158.42x+11.38; R2=0.999); epicatechin (y=129.11x+11.663, R²=0.9999); rutin (y=281.98x-0.3458; R2=1); kaempferol-3-O-glucoside (y=288.55x-4.05; R2=1); kaempferol-3-O-rutinoside (y=239.16x-10.587; R2=1); apigenin-6-C-glucoside (y=223.22x+60.915, R²=1); luteolin-6-C-glucoside (y=508.54x-152.82; R2=0.997); luteolin-7-O-glucoside (y=80.829x-21.291; R2=0.999); quercetin-3-O-glucoside (y=253.52x-11.615; R2=0.999) and isorahmetin-3-O-rutinoside (y=327.42x+313.78; R2=0.999) The results were expressed in mg per g of methanolic extract and lyophilized infusion.
2.5. Statistical analysis
For wild and cultivated plant material, three samples were used and all the assays were carried out in triplicate. The results are expressed as mean values and standard deviation (SD). The results were analysed using one-way analysis of variance (ANOVA) followed by Tukey’s HSD Test with α = 0.05. This treatment was carried out using SPSS v. 18.0 program.
3. Results and Discussion
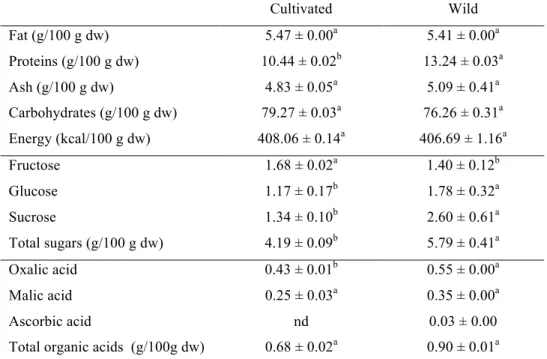
3.1. Nutritional contribution of wild and commercial samples
proteins, fat and ash. Both samples revealed similar contents of carbohydrates, fat, ash and energetic values whereas the wild sample showed higher protein contents.
Fructose, glucose and sucrose were the free sugars detected in the studied samples. The wild sample gave the highest contents in total free sugars and also in sucrose and glucose. Fructose was the major free sugar found in the cultivated sample. The wild sample also revealed the highest content of organic acids. Oxalic and malic acids were found in both samples, but ascorbic acid was only found in wild bay leaves (Table 1). The several processes applied to cultivated samples throughout the supply chain (pre-harvest conditions, post(pre-harvest handling, storage conditions, processing, and preparation) could contribute to degradation of ascorbic acid. Nonetheless, the maturity at harvest and the genetic variations between both samples could also influence ascorbic acid content (Howard, Wong, Peery, & Klein, 1999).
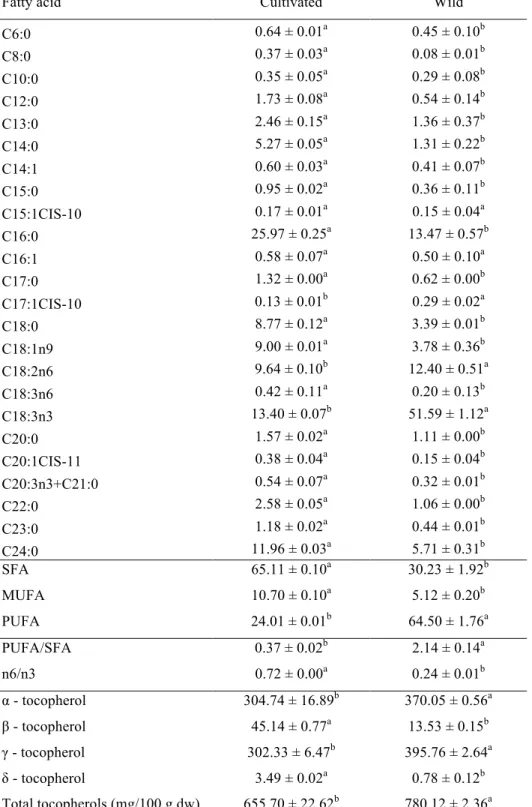
Up to twenty-five fatty acids were found in cultivated and wild samples of L. nobilis
sample showed the highest total tocopherols content, mainly γ-tocopherol followed by
α-tocopherol. Previous studies conducted using different extraction methodologies including a saponification step (Demo et al., 1998; Ouchikh et al., 2011) and supercritical fluids (Gómez-Coronado, 2004), or even different extraction solvents
(Gómez-Coronado & Barbas, 2003), reported much lower tocopherols content and not
detecting all the isoforms reported herein.
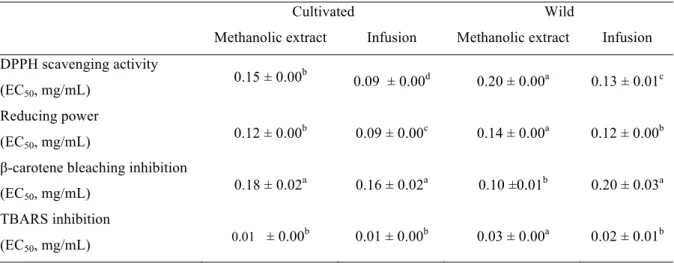
3.2. Antioxidants contribution of wild and commercial samples
The antioxidant activity of methanolic extract and infusion of cultivated and wild L. nobilis was studied and the results are presented in Table 3. Both preparations were chosen because infusions and extracts of the leaves are widely used in medicinal practices, as stated in the introduction section. In general, infusions of both samples revealed higher antioxidant activity (lower EC50 values) than methanolic extracts. Cultivated L. nobilis showed higher DPPH scavenging activity, reducing power and TBARS inhibition than the wild sample. The samples studied herein showed higher DPPH scavenging activity than the aqueous-methanol and aqueous extracts of L. nobilis
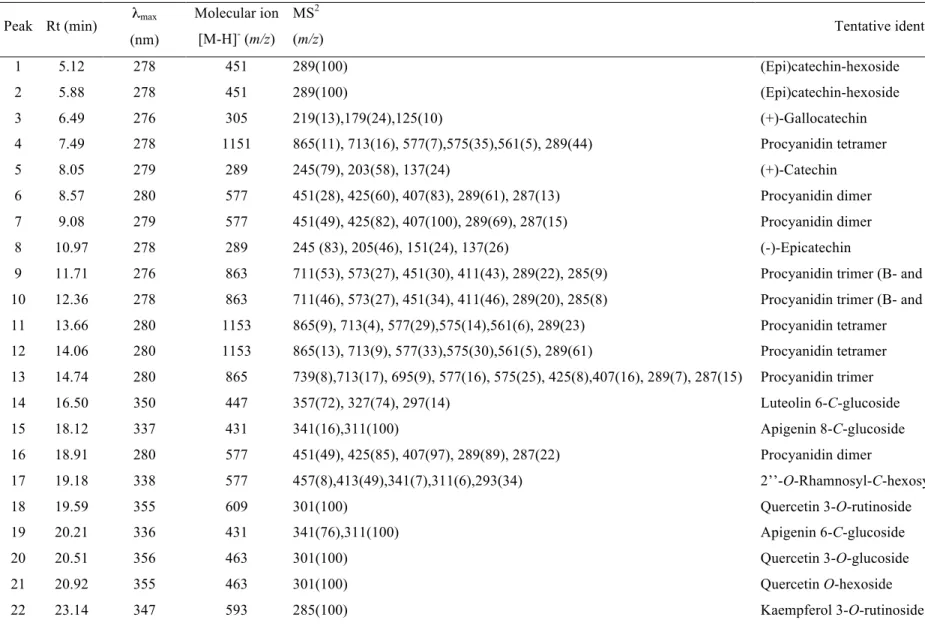
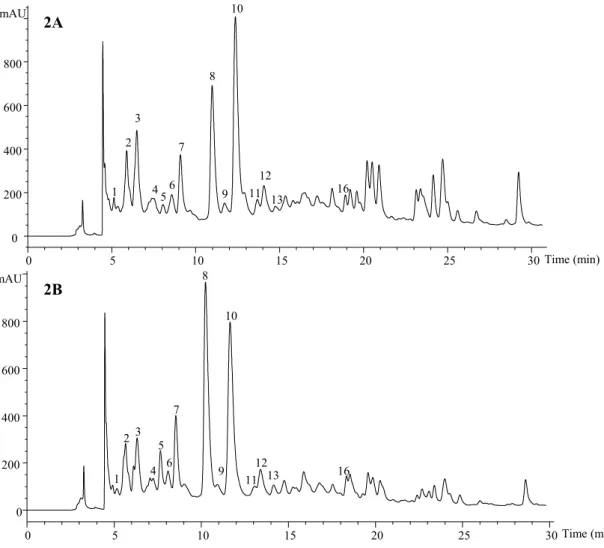
The HPLC phenolic profile of a wild sample of L. nobilis recorded at 280 and 370 nm is shown in Figures 1 and 2, respectively, and peak characteristics and tentative identities are presented in Table 4. Thirty-two compounds were detected, from which fourteen were flavan-3-ols (i.e., catechins and proanthocyanidins), fourteen flavonols and four flavones.
Flavan-3-ols, peaks 1-13 and 16, were identified according to their UV spectra and pseudomolecular ions. Peaks 3, 5 and 8 were identified as gallocatechin, (+)-catechin and (-)-epi(+)-catechin, respectively, by comparison of their UV spectra and retention time with authentic standards. Peaks 1 and 2 presented a pseudomolecular ion [M-H]- at m/z 451, releasing an MS2 fragment at m/z 289 ([M-H-162]-, loss of an hexosyl moiety), corresponding to a catechin monomer. These compounds were tentatively identified as (epi)catechin hexosides, identity that was coherent with their earlier elution (higher polarity) compared with the parent aglycones (Santos-Buelga, Garcia-Viguera, & Tomas-Barberan, 2003). Other signals at m/z 577, 865 and 1153 (peaks 4, 6, 7, 11-13 and 16), can be respectively associated to B-type procyanidin dimers, trimers and tetramers (i.e., (epi)catechin units with C4-C8 or C4-C6 interflavonoid linkages). Furthermore, peaks 9 and 10 showed a pseudomolecular ion [M-H]- at m/z 863 that could correspond to a procyanidin trimer containing one B-type and one A-type (i.e., C4-C8 or C4-C6 and C2-O-C7 or C2-O-C5) interflavonoid linkages (Dall’acqua et al., 2009; Rodrigues et al., 2012).
kaempferol 3-O-glucoside (peak 24) and isorhamnetin 3-O-rutinoside (peak 25) were positively identified according to their retention, mass and UV-vis characteristics by comparison with a commercial standard.
Peaks 21, 23 and 26 ([M-H]- at m/z 463, 433 and 447, respectively) were assigned to quercetin (m/z at 301) derivatives; peaks 29 and 31 ([M-H]- at m/z 417 and 431, respectively) were assigned to kaempferol (m/z at 285) derivatives and peaks 27, 28, 30 and 32 ([M-H]- at m/z 477, 447 and 461, respectively) were assigned to isorhamnetin (m/z at 315) derivatives, presenting distinct losses of hexosyl (-162 mu), pentosyl (-132 mu) and rhamnosyl (-146 mu) moieties (Dias et al., 2013). Their elution order was coherent with the type of substituent sugars, according to their expected polarity, although the position and nature of the sugar moieties could not be identified, because their retention times did not correspond to any of the standards available.
fragments ions. The loss of 120 mu (ion at m/z 457 ([M-H-120]-) is characteristic of C -hexosyl flavones (Ferreres et al., 2003), while the loss of 164 mu, releasing the fragment at m/z 413 ([M-H-146-18]-) can be associated to an O-glycosylation on the hydroxyl group at position 2 of the C-glycosylating sugar (Ferreres, Gil-Izquierdo,
Andrade, Valentão & Tomás-Barberán, 2007). The remaining ions at m/z 341
([aglycone + 71)]-, m/z 311 ([aglycone + 41)]- and m/z 293 ([aglycone + 41-18]-) are usual in mono-C-glycosyl derivatives O-glycosylated on 2’’ position (Ferreres et al., 2007). According to this fragmentation pattern the compound was tentatively identified as 2’’-O-rhamnosyl-C-hexosyl-apigenin.
Peak 14 was assigned to a luteolin derivative. It showed a pseudomolecular ion [M-H] -at m/z 447 giving place to three MS2 fragment ions, a major one at m/z 357 [M-H-90]-, and other two at m/z 327 [M-H-120]- and at m/z 297 [M-H-30]-. This fragmentation pattern and the relative abundance of fragments was characteristic of C-glycosylated flavones at C-6 (Ferreres et al., 2003, 2004). The peak was identified as luteolin-6-C -glucoside, which was further confirmed by comparison to a standard.
nobilis from Italy corresponding to kaempferol and quercetin glycosides derivatives and flavan-3-ols (mainly catechin and proanthocyanidins), although these latter in very low amounts. Lu et al. (2011) reported the presence of flavonoids and low concentrations of phenolic acids in ethanolic extracts of L. nobilis from China, but with a single identification of rutin; all the phenolic acids were indicated as unknown. No relevant amounts of phenolic acid derivatives were detected in the samples here analysed.
Overall, the wild sample showed the highest content of proteins, free sugars, organic acids, PUFA and tocopherols. It also gave better PUFA/SFA and n-6/n-3 ratios. Regarding antioxidant activity and phenolic compounds, it was the cultivated sample (mostly the infusion) that showed the highest values. The present study supports the arguments defending the use of wild and cultivated medicinal and aromatic plants as both present interesting nutraceutical features: the wild sample gave higher nutritional contribution, but it was the cultivated sample that showed higher bioactivity. In vitro
culture could be applied to L. nobilis as a production methodology that allows combination of the benefits of wild and cultivated samples.
Acknowledgements
The authors are grateful to Fundação para a Ciência e a Tecnologia (FCT, Portugal) for financial support to CIMO (strategic project PEst-OE/AGR/UI0690/2011) and REQIMTE (PEst-C/EQB/LA0006/2011). M.I. Dias, L. Barros and R.C. Alves also thank to FCT, POPH-QREN and FSE for their grants (SFRH/BD/84485/2012, SFRH/BPD/4609/2008 and SFRH/BPD/68883/2010, respectively).
Afifi, F.U., Khalil, E., Tamimi, S.O., Disi, A. (1997). Evaluation of the gastroprotective effect of Laurus nobilis seeds on ethanol induced gastric ulcer in rats. Journal of Ethnopharmacology, 58, 9–14.
AOAC. (1995). Official Methods of Analysis. Association of Official Analytical Chemists: Arlington VA, USA;Vol. 16.
Camejo-Rodrigues, J., Ascenção, L., Bonet, M.A., Valles, J., (2003). An ethnobotanicalstudy of medicinal and aromatic plants in Natural Park of “Serra de São Mamede” (Portugal). Journal of Ethnopharmarcology, 89, 199–209.
Carocho, M., & Ferreira, I.C.F.R. (2013). A review on antioxidants, prooxidants and related controversy: Natural and synthetic compounds, screening and analysis methodologies and future perspectives. Food and Chemical Toxicology, 51, 15–25. Conforti, F., Statti, G., Uzunov, D., & Menichinia, F. (2006). Comparative chemical
composition and antioxidant activities of wild and cultivated Laurus nobilis L. Leaves and Foeniculum vulgare subsp. piperitum (Ucria) Coutinho Seeds.
Biological & Pharmaceutical Bulletin. 29, 2056-2064.
Dall’Acqua, S., Cervellati, R., Speroni, E., Costa, S., Guerra, M.C., Stella, L., Greco, E., & Innocenti, G. (2009). Phytochemical composition and antioxidant activity of
Laurus nobilis L. leaf infusion. Journal of Medicinal Food, 12, 869–876.
Demo, A., Petrakis, C., Kefalasa, P., & Boskou, D. (1998). Nutrient antioxidants in some herbs and mediterranean plant leaves. Food Research International, 31, 351-354.
Elmastaş, M., Gülçin, İ., Işildak, Ö., Küfrevioğlu, Ö.İ., İbaoğlu, K., & Aboul-Enein, H.Y. (2006). Radical scavenging activity and antioxidant capacity of bay leaf extracts. Journal of the Iranian Chemical Society, 3, 258-266.
Emam, A.M., Mohamed, M.A., Diab, Y.M., & Megally, N.Y. (2010). Isolation and structure elucidation of antioxidant compounds from leaves of Laurus nobilis and
Emex spinosus. Drug Discoveries & Therapeutics, 4, 202-207.
Ferreira, A., Proença, C., Serralheiro, M.L.M., & Araújo, M.E.M. (2006). The in vitro
screening for acetylcholinesterase inhibition and antioxidant activity of medicinal plants from Portugal. Journal of Ethnopharmacology, 108, 31–37.
Ferreres, F., Gil-Izquierdo, A., Andrade, P.B., Valentao, P., & Tomás-Barberán, F.A. (2007). Characterization of C-glycosyl flavones O-glycosylated by liquid chromatography-tandem mass spectrometry. Journal of Chromatography A, 1161, 214-223.
Ferreres, F., Llorach, R., & Gil-Izquierdo, A. (2004). Characterization of the interglycosidic linkage in di-, tri-, tetra- and pentaglycosylated flavonoids and differentiation of positional isomers by liquid chromatography/electrospray ionization tandem mass spectrometry. Journal of Mass Spectrometry, 39, 312-321. Ferreres, F., Silva, B.M., Andrade, P. B., Seabra, R. M., & Ferreira, M.A. (2003).
Approach to the study of C-glycosyl flavones by ion trap HPLC-PAD-ESI/MS/MS: Application to seeds of quince (Cydonia oblonga). Phytochemical Analysis, 14, 352-390.
Gómez-Coronado, D.J.M, Ibañez, E., Rupérez, F.J., & Barbas, C. (2004). Tocopherol measurement in edible products of vegetable origin. Journal of Chromatography A, 1054, 227–233.
Guarrera, P.M. & Savo. V. (2013). Perceived health properties of wild and cultivated food plants in local and popular traditions of Italy: A review. Journal of Ethnopharmacology, 146, 659–680.
Guil, J.L., Torija, M.E., Giménez, J.J., Rodriguez, I. (1996). Identification of fatty acids in edible wild plants by gas chromatography. Journal of Chromatography A. 719, 229-235.
Guimarães, R., Barros, L., Dueñas, M., Calhelha, R.C., Carvalho, A.M., Santos-Buelga, S., Queiroz, M.J.R.P., & Ferreira, I.C.F.R. (2013). Nutrients, phytochemicals and bioactivity of wild Roman chamomile: A comparison between the herb and its preparations. Food Chemistry, 136, 718-725.
Howard, L.A., Wong, A.D., Perry, A.K., & Klein, B.P. (1999). β-Carotene and ascorbic acid retention in fresh and processed vegetables, Journal of Food Science, 64, 929-936.
Kaurinovic, B., Popovic, M., & Vlaisavljevic, S. (2010). In Vitro and in Vivo effects of
Laurus nobilis L. leaf extracts, Molecules, 15, 3378-3390.
Koşar, M., Dorman, H.J.D., & Hiltunen, R. (2005). Effect of an acid treatment on the phytochemical and antioxidant characteristics of extracts from selected Lamiaceae species. Food Chemistry, 91, 525–533.
Lu, M., Yuan, B., Zeng, M., & Chen, J. (2011). Antioxidant capacity and major phenolic compounds of spices commonly consumed in China. Food Research International,
44, 530–536.
tocopherol level and antioxidant activity of L. nobilis vegetative organs. Journal of Food Composition and Analysis, 24, 103–110.
Ozcan, B., Esen, M., Sangun, M.K., Coleri, A., & Caliskan, M. (2010). Effective antibacterial and antioxidant properties of methanolic extract of Laurus nobilis
seed oil. Journal of Environmental Biology, 31, 637-641.
Papageorgiou, V., Mallouchos, A., & Komaitis, M. (2008). Investigation of the antioxidant behavior of air- and freeze-dried aromatic plant materials in relation to their phenolic content and vegetative cycle. Journal of Agricultural and Food Chemistry, 56, 5743-5752.
Pereira, C., Barros, L., Carvalho, A.M. & Ferreira, I.C.F.R. (2013). Use of UFLC-PDA for the analysis of organic acids in thirty-five species of food and medicinal plants. Food Analytical Methods, DOI 10.1007/s12161-012-9548-6.
Polovka, M., & Suhaj, M. (2010). Detection of caraway and bay leaves irradiation based on their extracts antioxidant properties evaluation. Food Chemistry, 119, 391– 401.
Ramos, C., Teixeira, B., Batista, I., Matos, O., Serrano, C., Neng, N.R., Nogueira, J.M.F., Nunes, M.L., & Marques, M. (2012) Antioxidant and antibacterial activity of essential oil and extracts of bay leave Laurus nobilis Linnaeus (Lauraceae) from Portugal. Natural Product Research, 6, 518-529.
Santos-Buelga, G., Garcia-Viguera, C., & Tomas-Barberan, A. (2003). On-line identification of flavonoids by HPLC coupled to diode array detection. In Methods in Polyphenol Analysis (pp. 92–128). Cambridge: Royal Society of Canada.
Santoyo, S., Lloría, R., Jaime, L., Ibañez, E., Señoráns, F.J, & Reglero G. (2006). Supercritical fluid extraction of antioxidant and antimicrobial compounds from
Laurus nobilis L. chemical and functional characterization. European Food Research and Technology, 222, 565–571.
Schippmann, U., Leaman, D.J. & Cunningham, A. B. (2002). Impact of Cultivation and Gathering of Medicinal Plants on Biodiversity: Global Trends and Issues. FAO-
Biodiversity and the Ecosystem Approach in Agriculture, Forestry and Fisheries. Satellite event on the occasion of the Ninth Regular Session of the Commission on Genetic Resources for Food and Agriculture.
Škerget, M., Kotnik, P., Hadolin. M., Hraš, A.R., Simonič, A.M., & Knez, Ž. (2005). Phenols, proanthocyanidins, flavones and flavonols in some plant materials and their antioxidant activities. Food Chemistry, 89, 191–198.
Table 1. Macronutrients, free sugars and organic acids of cultivated and wild Laurus nobilis.
Cultivated Wild
Fat (g/100 g dw) 5.47 ± 0.00a 5.41 ± 0.00a Proteins (g/100 g dw) 10.44 ± 0.02b 13.24 ± 0.03a Ash (g/100 g dw) 4.83 ± 0.05a 5.09 ± 0.41a Carbohydrates (g/100 g dw) 79.27 ± 0.03a 76.26 ± 0.31a Energy (kcal/100 g dw) 408.06 ± 0.14a 406.69 ± 1.16a
Fructose 1.68 ± 0.02a 1.40 ± 0.12b
Glucose 1.17 ± 0.17b 1.78 ± 0.32a
Sucrose 1.34 ± 0.10b 2.60 ± 0.61a
Total sugars (g/100 g dw) 4.19 ± 0.09b 5.79 ± 0.41a
Oxalic acid 0.43 ± 0.01b 0.55 ± 0.00a
Malic acid 0.25 ± 0.03a 0.35 ± 0.00a
Ascorbic acid nd 0.03 ± 0.00
Total organic acids (g/100g dw) 0.68 ± 0.02a 0.90 ± 0.01a
Table 2. Fatty acids and tocopherols of cultivated and wild Laurus nobilis.
Fatty acid Cultivated Wild
C6:0 0.64 ± 0.01a 0.45 ± 0.10b
C8:0 0.37 ± 0.03a 0.08 ± 0.01b
C10:0 0.35 ± 0.05a 0.29 ± 0.08b
C12:0 1.73 ± 0.08a 0.54 ± 0.14b
C13:0 2.46 ± 0.15a 1.36 ± 0.37b
C14:0 5.27 ± 0.05a 1.31 ± 0.22b
C14:1 0.60 ± 0.03a 0.41 ± 0.07b
C15:0 0.95 ± 0.02a 0.36 ± 0.11b
C15:1CIS-10 0.17 ± 0.01a 0.15 ± 0.04a
C16:0 25.97 ± 0.25a 13.47 ± 0.57b
C16:1 0.58 ± 0.07a 0.50 ± 0.10a
C17:0 1.32 ± 0.00a 0.62 ± 0.00b
C17:1CIS-10 0.13 ± 0.01b 0.29 ± 0.02a
C18:0 8.77 ± 0.12a 3.39 ± 0.01b
C18:1n9 9.00 ± 0.01a 3.78 ± 0.36b
C18:2n6 9.64 ± 0.10b 12.40 ± 0.51a
C18:3n6 0.42 ± 0.11a 0.20 ± 0.13b
C18:3n3 13.40 ± 0.07b 51.59 ± 1.12a
C20:0 1.57 ± 0.02a 1.11 ± 0.00b
C20:1CIS-11 0.38 ± 0.04a 0.15 ± 0.04b
C20:3n3+C21:0 0.54 ± 0.07a 0.32 ± 0.01b
C22:0 2.58 ± 0.05a 1.06 ± 0.00b
C23:0 1.18 ± 0.02a 0.44 ± 0.01b
C24:0 11.96 ± 0.03a 5.71 ± 0.31b
SFA 65.11 ± 0.10a 30.23 ± 1.92b
MUFA 10.70 ± 0.10a 5.12 ± 0.20b
PUFA 24.01 ± 0.01b 64.50 ± 1.76a
PUFA/SFA 0.37 ± 0.02b 2.14 ± 0.14a
n6/n3 0.72 ± 0.00a 0.24 ± 0.01b
α - tocopherol 304.74 ± 16.89b 370.05 ± 0.56a
β - tocopherol 45.14 ± 0.77a 13.53 ± 0.15b
γ - tocopherol 302.33 ± 6.47b 395.76 ± 2.64a
δ - tocopherol 3.49 ± 0.02a 0.78 ± 0.12b
Total tocopherols (mg/100 g dw) 655.70 ± 22.62b 780.12 ± 2.36a
nd- not detected; dw- dry weight. Caproic acid (C6:0); Caprylic acid (C8:0); Capric acid (C10:0); Lauric acid (C12:0);
Tridecanoic acid (C13:0); Myristic acid (C14:0); Myristoleic acid (C14:1); Pentadecanoic acid (C15:0); cis
-10-Pentadecenoic acid (C15:1); Palmitic acid (C16:0); Palmitoleic acid (C16:1); Heptadecanoic acid (C17:0 ) cis-10-Heptadecenoic acid (C17:1); Stearic acid (C18:0); Oleic acid (C18:1n9); Linoleic acid (C18:2n6c); γ-Linolenic acid (C18:3n6); Linolenic acid (C18:3n3); Arachidic acid (C20:0); cis-11-Eicosenoic acid (C20:1); cis -11,14,17-Eicosatrienoic acid and Heneicosanoic acid (C20:3n3+C21:0); Behenic acid (C22:0); Tricosanoic acid (C23:0);
Table 3. Antioxidant activity of methanolic extracts and infusions of cultivated and wild Laurus nobilis.
Cultivated Wild
Methanolic extract Infusion Methanolic extract Infusion DPPH scavenging activity
(EC50, mg/mL)
0.15 ± 0.00b 0.09 ± 0.00d
0.20 ± 0.00a 0.13 ± 0.01c Reducing power
(EC50, mg/mL)
0.12 ± 0.00b 0.09 ± 0.00c 0.14 ± 0.00a 0.12 ± 0.00b β-carotene bleaching inhibition
(EC50, mg/mL)
0.18 ± 0.02a 0.16 ± 0.02a 0.10 ±0.01b 0.20 ± 0.03a TBARS inhibition
(EC50, mg/mL)
0.01 ± 0.00b 0.01 ± 0.00b 0.03 ± 0.00a 0.02 ± 0.01b
Table 4. Retention time (Rt), wavelengths of maximum absorption in the visible region (λmax), mass spectral data, tentative identification of
flavonoids in Laurus nobilis.
Peak Rt (min) λmax (nm)
Molecular ion
[M-H]- (m/z) MS2
(m/z) Tentative identification
1 5.12 278 451 289(100) (Epi)catechin-hexoside
2 5.88 278 451 289(100) (Epi)catechin-hexoside
3 6.49 276 305 219(13),179(24),125(10) (+)-Gallocatechin
4 7.49 278 1151 865(11), 713(16), 577(7),575(35),561(5), 289(44) Procyanidin tetramer
5 8.05 279 289 245(79), 203(58), 137(24) (+)-Catechin
6 8.57 280 577 451(28), 425(60), 407(83), 289(61), 287(13) Procyanidin dimer
7 9.08 279 577 451(49), 425(82), 407(100), 289(69), 287(15) Procyanidin dimer
8 10.97 278 289 245 (83), 205(46), 151(24), 137(26) (-)-Epicatechin
9 11.71 276 863 711(53), 573(27), 451(30), 411(43), 289(22), 285(9) Procyanidin trimer (B- and A-type linkages)
10 12.36 278 863 711(46), 573(27), 451(34), 411(46), 289(20), 285(8) Procyanidin trimer (B- and A-type linkages)
11 13.66 280 1153 865(9), 713(4), 577(29),575(14),561(6), 289(23) Procyanidin tetramer
12 14.06 280 1153 865(13), 713(9), 577(33),575(30),561(5), 289(61) Procyanidin tetramer
13 14.74 280 865 739(8),713(17), 695(9), 577(16), 575(25), 425(8),407(16), 289(7), 287(15) Procyanidin trimer
14 16.50 350 447 357(72), 327(74), 297(14) Luteolin 6-C-glucoside
15 18.12 337 431 341(16),311(100) Apigenin 8-C-glucoside
16 18.91 280 577 451(49), 425(85), 407(97), 289(89), 287(22) Procyanidin dimer
17 19.18 338 577 457(8),413(49),341(7),311(6),293(34) 2’’-O-Rhamnosyl-C-hexosyl-apigenin
18 19.59 355 609 301(100) Quercetin 3-O-rutinoside
19 20.21 336 431 341(76),311(100) Apigenin 6-C-glucoside
20 20.51 356 463 301(100) Quercetin 3-O-glucoside
21 20.92 355 463 301(100) Quercetin O-hexoside
23 23.36 344 433 301(100) Quercetin O-pentoside
24 23.56 350 447 285(100) Kaempferol 3-O-glucoside
25 24.15 354 623 315(100) Isorhamnetin O-rutinoside
26 24.71 348 447 301(100) Quercetin O-rhamnoside
27 25.01 356 477 315(100) Isorhamnetin O-hexoside
28 25.60 354 477 315(100) Isorhamnetin O-hexoside
29 26.72 347 417 285(100) Kaempferol O-pentoside
30 28.49 355 447 315(100) Isorhamnetin O-pentoside
31 29.23 343 431 285(100) Kaempferol O-hexoside
Time (min)
0 5 10 15 20 25 30
mAU 0 100 200 300 400 14 15 17 18 19 20 21 2223 24 25 26 27 28 29 30 31 32 Time (min)
0 5 10 15 20 25 30
mAU 0 20 40 60 80 100 120 140 160 14 15 17 18 19 20 21 22 23 24 25 26 27 28 30 29 31 32 1A 1B
Figure 1. HPLC phenolic profile (flavone/ols) of cultivated (A) and wild (B) Laurus
nobilis, obtained at 370 nm. Identification of peaks 14, 15 and 17-32 is presented in
Time (min)
0 5 10 15 20 25 30
mAU 0 200 400 600 800 1 2 3 4 56 7 8 9 10 11 12 13 16
0 5 10 15 20 25 30
mAU 0 200 400 600 800 Time (min) 1 2 3 4 5 6 7 8 10 9 11 12 13 16 2B 2A
Figure 2. HPLC phenolic profile (flavan-3-ols) of cultivated (A) and wild (B) Laurus