WCL2R: A Benchmark Collection for Learning to Rank
Research with Clickthrough Data
Otávio D. A. Alcântara1, Álvaro R. Pereira Jr.3, Humberto M. de Almeida1, Marcos A. Gonçalves1, Christian Middleton2, Ricardo Baeza-Yates2
1
Universidade Federal de Minas Gerais, Brazil {otaviod,hmossri,mgoncalv}@dcc.ufmg.br
2
Universitat Pompeu Fabra, Spain
[email protected], [email protected]
3
Universidade Federal de Ouro Preto, Brazil [email protected]
Abstract. In this paper we present WCL2R, a benchmark collection for supporting research in learning to rank (L2R) algorithms which exploit clickthrough features. Differently from other L2R benchmark collections, such as LETOR and the recently released Yahoo!’s collection for a L2R competition, in WCL2R we focus on defining a significant (and new) set of features over clickthrough data extracted from the logs of a real-world search engine. In this paper, we describe the WCL2R collection by providing details about how the corpora, queries and relevance judgments were obtained, how the learning features were constructed and how the process of splitting the collection in folds for representative learning was performed. We also analyze the discriminative power of the WCL2R collection using traditional feature selection algorithms and show that the most discriminative features are, in fact, those based on clickthrough data. We then compare several L2R algorithms on WCL2R, showing that all of them obtain significant gains by exploiting clickthrough information over using traditional ranking approaches.
Categories and Subject Descriptors: H.3.3 [Information Search and Retrieval]: Artificial Intelligence—Learning to Rank
Keywords: Benchmark, Clickthrough, Learning to Rank
1. INTRODUCTION
In the last few years,learning to rank (L2R) has become an important research topic in Information Retrieval (IR) with hundreds of papers published in the area such as [Herbrich et al. 2000; Joachims 2002; Freund et al. 2003; Joachims 2006; Almeida et al. 2007; Liu et al. 2007; Xu and Li 2007; Tsai et al. 2007; Cao et al. 2007; Veloso et al. 2008]. L2R refers to the task of learning a ranking function by means of a (usually) supervised method, which takes as input a set of previously known queries and relevance judgments and outputs a model which is able to estimate the relevance of documents and rank them for a given unknown query. L2R is typically applied by real search engines in a re-ranking phase after a traditional re-ranking method such as BM25 is applied to generate an initial set of candidates.
L2R takes advantage of the capability of current learning technologies to deal with hundreds of features available to the search engines to generate the ranking functions, and their capacity of dis-covering a close to optimal way of combining those features while optimizing some criteria usually related to the quality of the ranks produced. In terms of the learning task, L2R also brings some inter-esting research issues since the introduction of queries modifies the original definition of the learning
problem which becomes now contextual, since a document may be (very) relevant to a query and not relevant at all to another one.
As occurs in other IR tasks such as document classification, the advance of the field requires the existence of an experimental platform which includes an indexed document corpora, selected queries for training and test, feature vectors extracted from each document, implementation of baselines and standard evaluation tools. Without this it is very difficult, sometimes impossible, to compare results across different methods since researchers usually utilize their own proprietary datasets with different query sets, different evaluation tools, etc.
Accordingly, the first collection covering such characteristics was LETOR, produced by a group from Microsoft Research China [Liu et al. 2007]. LETOR was constructed based on multiple data corpora, mainly extracted from data available from several TREC competitions [Voorhees and Harman 1998; 1999]. Documents from those collections were sampled using several strategies and then features and metadata were extracted for each query-document pair. Standard five folds for cross-validation as well as evaluation tools were also provided by the framework. Furthermore, ranking performance of several algorithms was provided to serve as baselines.
Another collection recently released for comparing L2R algorithms is one by Yahoo! Labs for a L2R challenging within the context of a workshop to be held in conjunction with the International Conference on Machine Learning, 2010 edition. The collection has about 700 features and standard evaluation tools were also made available. However, the semantics of the features were not released which limits the usefulness of the collection for research purposes.
In this paper we describe a new collection, WCL2R, for supporting research on L2R, which has important distinctions with the previous ones. First of all it is based on data gathered from a real search engine, TodoCL, which has been running for more than eight years as a commercial search engine covering Chilean Web documents. More importantly, this collection is focused on exploiting clickthrough data obtained from the search logs of TodoCL. Clickthrough information has been shown to be useful in several previous studies to produce good ranking functions [Agichtein et al. 2006] but it was never previously largely available for L2R research.
In WCL2R we focused on defining a significant (and new) set of features over clickthrough data. In this paper, we describe the WCL2R collection by providing details about how the corpora, queries and relevance assessments were obtained, how the learning features were constructed and about the process of splitting the collection in folds for representative learning. We also analyze the discriminative power of the WCL2R collection using traditional feature selection algorithms and show that the most discriminative ones are in fact those based on clickthrough data. We then compare several L2R algorithms on WCL2R and show that all of them can obtain significant gains by exploiting clickthrough information over using traditional ranking approaches.
In sum, the main contributions of this paper are: (1) the description a new collection for L2R tasks focused on clickthrough information; (2) the definition of a new set of clickthrough features for the learning process and the study of the relative discriminative power of these features; and (3) a comparative study of several L2R algorithms using the collection in different situations, i.e., with and without clickthrough information.
2. RELATED WORK
There are two kinds of work related to our efforts: (i) those that present benchmark datasets for the L2R task and (ii) those that exploit clickthrough data for improving the retrieval task.
In the last years, large companies such as Microsoft, Yahoo!, and Yandex have made available benchmark collections for L2R task. The first and most important one was LETOR1, made available
by Microsoft in 2007 [Liu et al. 2007]. Currently, LETOR datasets are divided into two releases: LETOR 3.0 which contains 7 collections (OHSUMED, TD2003, TD2004, HP2003, P2004, NP2003, NP2004) including several features (45 features for the OHSUMED collection and 64 features for the others), relevance assessments, data partitioning, evaluation tools, and several baselines such as Ranking SVM [Herbrich et al. 2000; Joachims 2002], RankBoost [Freund et al. 2003], AdaRank [Xu and Li 2007], FRank [Tsai et al. 2007], and ListNet [Cao et al. 2007]. Last year, Microsoft made available LETOR 4.0 which is a new release and contains two datasets (MQ2007, MQ2008) for four ranking settings: supervised, semi-supervised, listwise ranking, and rank aggregation. There are about 1,700 queries in MQ2007 and 800 queries in MQ2008 with labeled query-documents pairs. The features provided by LETOR cover a wide range of common IR features, such as term frequency, inverse document frequency, BM25, language models for IR (LMIR), PageRank, and HITS. However, LETOR datasets do not have any features based on clickthrough data.
Another dataset for L2R was made available by Yandex, Russia’s largest internet company. Yandex has promoted the “Internet Mathematics” contest2 for stimulating the development of ranking
algo-rithms to obtain a document ranking formula using machine learning methods. Real data including 245 features for each query-document pair, more than 9,000 queries and 100,000 documents, along with relevance judgments, are provided for learning and testing.
This year Yahoo! also launched a contest — Yahoo! Learning To Rank Challenge3— for comparison of machine learning algorithms applied to the L2R task. Yahoo! datasets are a subset of what Yahoo! uses to train its ranking function. There are 700 features in total and more than 20,000 queries and 500,000 URL’s. The datasets made available by both Yandex and Yahoo! do not disclose the complete list of provided features and their semantics and do not have any reference to the use of clickthrough information, which limits their usefulness for reasearch, as interpretation of results is very difficult.
Since clickthrough data exists in abundance for real search engines [Joachims 2002], as it can be easily obtained from search engine logs, there are several studies investigating the use of clickthrough information for improving the ranking task. For example, the employment of clickthrough data instead of relevance judgments for optimizing the retrieval quality of search engines was firstly presented in [Joachims 2002]. We remind that although clickthrough data is available for real search engines, it is usually not accessible for researchers in the academia, so that one of the main contributions of this paper is the availability of such type of data from the TodoCL search engine.
In [Radlinski and Joachims 2005], the authors proposed a new way for discovering query chains from search engine query and clickthrough logs. Query chains are a sequence of reformulated queries relative to a same information need. The use of query chains, rather than considering each query individually, produces many more clicked documents referring to an entire search session. Thus, more reliable relevance judgments can be inferred from clickthrough data. Later, in [Dou et al. 2008], it was shown that the aggregation of a large number of user clicks provides relevance preferences more reliable than the use of individual query sessions. Moreover, it was shown that clickthrough data has weak correlation to human judgments, but in spite of this the clickthrough data was also effective in learning web search rankings. Our work differs from these because we exploit clickthrough information directly as features for generating L2R models.
1
Available at http://research.microsoft.com/en-us/um/beijing/projects/letor/. 2
Available at http://imat2009.yandex.ru/en/ 3
Other works have gone further in the exploitation of clickthrough data, but are just slightly corre-lated to our efforts. Radlinski et al. [Radlinski and Joachims 2007] presented an active exploitation strategy, similar to active learning, for collecting user interaction records from search engine click-through logs. The proposed techniques guide search engine users to provide more useful training data by introducing modifications in the way the rankings are shown to users. These changes produce much more informative training data.
Xu et al. [Xu et al. 2010] investigated the effect of training data quality on L2R algorithms. They were able to detect automatically judgment errors using clickthrough data to improve the performance of the L2R task. Gao et al. [Gao et al. 2009] investigated the limitations of the sparseness problem present in clickthrough data, due to a limited number of clicks: for one query, few documents are clicked, and for many queries, no click is made. They presented two smoothing strategies for dealing with the sparseness problem, improving the quality of the ranking task.
A few works have investigated the use of user behavior information as features. Agichtein et al. [Agichtein et al. 2006] showed that incorporating implicit feedback features directly into the training data can significantly improve the effectiveness of the L2R task. They used clickthrough features such as click frequency for a query, probability of a click for a query, and other features relative to click position (e.g. next, previous, above, below). This idea of using the usage information is similar to ours, but the set of clickthrough features is different. We propose a larger and more focused set of clickthrough features, trying to cover a more complete set of situations (as we will show), whereas Agichtein et al. used some other groups of usage features like browsing and query-text, generating a smaller and different set of clickthrough features.
Ji et al. [Ji et al. 2009] presented a global ranking framework by exploiting user click sequences. Global ranking differs from local ranking approaches by considering the relationship among documents in order to produce a final ranking score for each document. They used only a small number of clickthrough features for generating a L2R model. Our work also differs from that one by using a larger set of clickthrough features and by using other features such as textual and hyperlink-based ones. Dupret et al. [Dupret and Liao 2010] also investigated the use of clickthrough features, but in an indirect way. Clickthrough data was used as features to generate a relevance estimation model. Afterwards, the model was used to predict the relevance of documents that were used as a features for a L2R machine learning algorithm. Differently, our work proposes and uses several clickthrough features directly for generating a L2R model.
Our work also differs from all others by making available a benchmark collection for L2R containing several queries and documents represented by feature vectors including clickthrough features, relevance judgments and baselines methods for comparison.
3. THE WCL2R DATASET AND ASSESSMENT EXPERIMENT
In this section we present details about the WCL2R dataset, the assessment experiment we performed to create relevance data, the extraction process of learning features, and the steps to finalize and make available the WCL2R dataset. These topics are presented in Sections 3.1, 3.2, 3.3, and 3.4 respectively.
3.1 The Dataset
The Chilean dataset (referred to as WCL2R) was created as part of the TodoCL4search engine. This
search engine was important in Chile in the beginning of the 2000 decade, and was supported by the Brazilian company Akwan Information Technologies5, sold to Google in 2005, which also provided
technology to the Brazilian search engine TodoBR.
4
www.todocl.cl or www.todocl.com 5
The WCL2R dataset uses the same standard used in the WBR dataset [Calado 2003], which has been largely used for research during the past 10 years [Pôssas et al. 2005; Atalla et al. 2008; Moura et al. 2008; Almeida et al. 2007]. The WCL2R dataset we are disclosing contains two snapshots of the Chilean Web. The first one was crawled in August 2003 and the second one was crawled in January 2004. We refer to these two collections as WCL2R2003 and WCL2R2004, respectively. Both collections have the following data structures available: the URL, title and text of the documents; the inlinks and outlinks of each document; the vocabulary and the inverted index of the text of the documents. We notice that the full HTMLs of the documents do not exist in the collection. Table I presents details of the two subcollections WCL2R2003 and WCL2R2004.
WCL2R2003 WCL2R2004 Total size in Giga Bytes 29 27 Size of text only in Giga Bytes 9.4 11.8 Number of documents 3110605 3135089 Number of links 36425818 30799108 Average number of links per document 11.7 9.8
Table I. WCL2R2003 and WCL2R2004 information
Aiming to empower the WCL2R dataset and to support research in the field of L2R, we are also disclosing usage data of the TodoCL search engine, comprising a period of 10 months, from August 2003 to May 2004, both months inclusive. This is a great advance of the WCL2R dataset compared to the WBR dataset [Calado 2003] and to the other datasets presented in Section 2, which do not include any usage data. Due to privacy issues, queries requested only a few times were deleted from the usage dataset to be disclosed, because rare queries may reveal private data about a specific user who requested it. Table II presents the characteristics of the usage data available.
Number of users (identified by IP) 16,829 Number of distinct queries 277,095 Number of documents clicked 465,579 Total number of clicks 1,525,562 Average number of clicks per user 90.65 Average number of clicks per query 5.51 Average number of clicks per document 3.28 Average number of distinct documents clicked per user 27.67 Average number of distinct documents clicked per query 1.68
Table II. Usage data information
3.2 The Assessment Experiment
We performed a relevance assessment experiment for a sample of queries from the query log. In this section we present: (i) how we selected queries from the query log; (ii) how we ran those queries in order to get a set of returned documents to be assessed; (iii) how we identified a reasonable number of returned documents to be assessed, for each query; and (iv) details of the assessed relevance dataset.
Every query available for assessment was taken from the query log. We started by filtering out queries requested less than ten times, because we wanted to exploit queries with significant usage data. We selected the queries taking into account its frequency in the query log. Accordingly, the more requests a query had, the more probable was this query to be selected by our weighted pseudorandom sampler. Thus, queries were selected biased by the probability of them to be requested by a new user, thus, most of the assessed queries have high frequency.
query processor was used as a black box, we do not have any information about its actual ranking function.
Given the result of each method for each query, we needed to define the number of documents from each method we would select to compose the pool of documents to be assessed. This pool was composed by using a dynamic approach, as follows. We decided to select the top ten documents returned by each method, except for the TodoCL ranking method, from which we selected the 15 top documents. According to the assessment of these documents for a given query, if a given method returned many relevant documents (measured by a pre-defined threshold empirically defined), more ranked documents returned by that method were selected during the assessment, which caused an increase in the number of documents to be assessed by the editor 6. Iteratively, if part of the new
selected documents were also assessed as relevant, then new documents continued to be selected from the associated method ranking. This approach was the way we found to avoid assessing too many documents without losing recall.
The algorithm for dynamically determining the number of documents to be assessed for a given query can be further described as follows:
(1) We defined the concept of stage, which determines, for a given query and editor, the number of documents that needed to be analyzed. We set a maximum of 3 stages, and every stage implied an incremental number of documents to assess.
(2) Initially every editor was assigned to be at stage 1.
(3) Based on the current stage of the editor, the system asked him/her to analyze the next document on the pool of available documents.
(4) Every time the editor rated a document, the system determined the average rating (ρ) that the editor had given to the documents for the given query. Ifρwas greater than a predefined average (in our case we set it to 1, since the rating was in [0,3]), and the editor had analyzed more than 60% of the documents, then she/he was assigned to the next stage which made the pool of documents available to increase.
(5) The process was repeated until the editor finished analyzing the set of documents assigned.
This algorithm allowed that for a given query, an editor would analyze different number of documents depending on the average “quality” of the documents.
We developed a software for editors to perform their relevance assessment. We invited colleagues from several universities in Spain, Chile, Portugal, Italy, and Brazil to collaborate as editors in the experiment. No query was assessed by more than one editor, and each editor assessed five queries at most. For each document, there were four relevance levels, from 0 to 3. Level 0 means the document is not relevant at all, whereas level 3 means it is totally relevant. Table III characterizes the assessed dataset.
Number of documents assessed 3,119 Number of queries assessed 79 Number of queries with more than 10 requests 611 Number of editors 34 Average number of documents per query 39.48 Average number of terms per query 2.03 Maximum number of terms per query 5 Average number of terms per query (w/o stopwords) 1.81 Maximum number of terms per query (w/o stopwords) 4
Table III. Relevance assessment information
6
In this work we used the concept of user session to extract some clickthrough features. We considered a session as being any sequence of queries and clicks requested by the same user within a period of 30 minutes, as used in [Radlinski et al. 2008].
3.3 Extracting Learning Features
As it is usual in learning to rank, each query-document pair is represented as a multidimensional feature vector in which each feature/dimension represents an piece of evidence that may help the learning method to estimate the relevance of a document for that query or to place it in the “best” position of the rank. Examples of such features include the BM25 score of the document with regards to the query; the frequency of the query terms appearing in the document; and the PageRank score of the document. In the case of WCL2R, there is an additional set of features related to the clickthrough information. Finally, associated with each feature vector is the “real” relevance of the document to the query as determined by the editors, as discussed in section 3.1.
In this section we define the set of features used in WCL2R, which can be defined for presentation purposes into two groups: Standard Features and Clickthrough Features. The first group corresponds to well established IR features commonly explored in literature, like tf-idf, BM25 and PageRank, while the second set, proposed in this paper, corresponds to a (new) set of features that exploit the usage information described in section 3.1. The features will be identified by numbers so that we can refer to them in the rest of the paper.
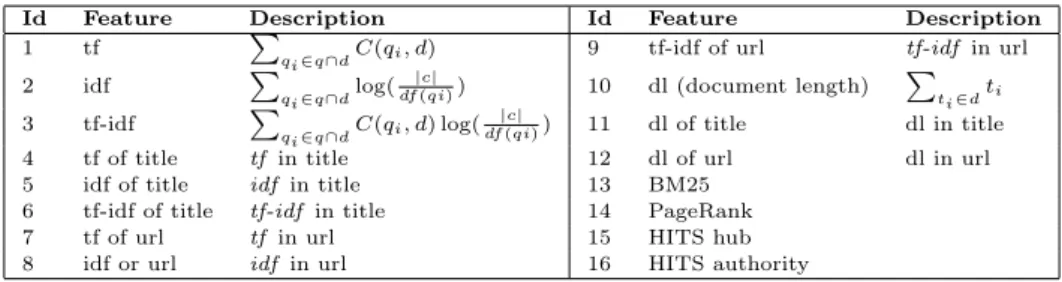
3.3.1 Standard Features. The standard set of features, as described before, contains features well established in literature, exploring text-based information of documents and queries, like tf-idf and BM25, as well as link information, PageRank and Hits, extracted from the Chilean Web graph by the time the collection was crawled. We implemented a set of 16 features listed in Table IV. Features 1 to 12 are described in [Baeza-Yates and Ribeiro-Neto 1999], feature 13 in [Qin et al. 2007], feature 14 in [Page et al. 1999] and features 15 and 16 in [Nie et al. 2006].
Id Feature Description Id Feature Description
1 tf P
qi∈q∩dC(qi, d) 9 tf-idf of url tf-idf in url
2 idf P
qi∈q∩dlog(
|c|
df(qi)) 10 dl (document length) P
ti∈dti
3 tf-idf P
qi∈q∩dC(qi, d) log(
|c|
df(qi)) 11 dl of title dl in title
4 tf of title tf in title 12 dl of url dl in url 5 idf of title idf in title 13 BM25
6 tf-idf of title tf-idf in title 14 PageRank 7 tf of url tf in url 15 HITS hub 8 idf or url idf in url 16 HITS authority
Table IV. Baseline features
3.3.2 Clickthrough Features. As explained before, the clickthrough set of features, which is an original contribution of this work, is based on usage information, originated from the interactions of the TodoCL users with the search engine. From the raw clickthrough data we built a new set of features which can be exploited by the learning methods to improve the generated ranking functions. Notice that here we are trying to model certain user interactions with a search engine which means that probably none of the assumptions discussed below will be always true, but we expect that these features when combined together, can provide some useful information to the learning to rank algorithms. In fact, as it will be shown later through some feature selection experiments, some of these clickthrough features are among the most discriminative ones of the collection. Below we describe the list of the clickthrough features proposed in this paper.
attracted the attention of the user, who chose it as the most promising to be further analyzed, thus providing evidence that it may be really relevant.
18 Last of Session: measures the number of times a document was the last one to be clicked in a session. If a document is clicked after others, this may indicate that the previous ones did not satisfy the user needs, so she kept looking. On the other hand, if the document is the last one a user has clicked, there is a chance that perhaps she may have really found what she was looking for and stopped the search. In the worst case scenario, this means that she simply gave up the search. 19 Number of clicks in a document for a query: measures the number of clicks in a document for a given query in all sessions by all users. The idea behind this feature is obvious: the more the document is clicked for a given query, more evidence we have indicating that it may be relevant for it.
20 Number of sessions a document was clicked for a query: measures the number of sessions in which a query-document pair was clicked, which might indicate that several users thought that the document was relevant for that query. This feature is similar to the previous one, but constrained to sessions.
The four features described above are query-oriented in the sense that they exploit information about query-document pairs. The next set of features can be regarded as context-independent since they will try to model the absolute value of a document in the whole collection, independently of the query submitted. Documents clicked several times, in different contexts, tend to be multidisciplinary, covering different areas. They may be trusted pages within very accessed sites, with a tendency to be a good choice, in general.
21 Number of clicks: measures the absolute number of clicks a document received independently of any query or session.
22 Number of sessions clicked: measures the absolute number of sessions in which a document was clicked.
23 Number of queries clicked: measures the absolute number of queries for which a document was clicked.
In the next group of features (24–27) we try to capture the notion that if a document was clicked only once (single click) in a given context (a query or a session, for example), that may be a good chance that the user has found exactly what she was looking for and then stopped. On the other hand, this may indicate that a user has started a search but has given up, thus introducing some negative information into the process. As we shall see when we analyze the individual discriminative power of the features, features 24–27 were ranked very low meaning that in our dataset the second interpretation is more recurrent. However, there may be cases in which this information is still useful, and we let for the learning algorithms to decide that.
24 Number of single clicks in distinct sessions: measures the number of distinct sessions a document, and only that document, was clicked.
25 Number of single clicks in distinct queries: measures the number of distinct queries a document, and only that document, was clicked. In this feature, if the same document is clicked for the same query in two different sessions, these clicks will count only once.
26 Absolute number of single clicks in queries: measures the absolute number of queries a docu-ment, and only that docudocu-ment, was clicked. Clicks for the same query in different sessions will be considered as different, and will be counted more than once.
27 Number of single clicks in queries grouped by session: measures the number of queries a document, and only that document, was clicked, being the query-document pair click counted only once in a session.
Number of queries: 79 Number of features: 29
Relevance levels:0 (irrelevant) to 3 (totally relevant) Number of query-documents pairs: 5,200
Average number of documents per query: 61.94 Average number of relevant documents per query (>0): 18.01
Data partitioning: 10 random partitions with 3 folds for cross-validation, including training, validation and test sets
Table V. Summary of the WCL2R collection
in which the document was clicked also had other clicks, and then, there is a smaller chance that this click happened by accident (i.e., it is noise) making this click more reliable. As we shall see, this kind of information can be very useful as indicated by their position in the feature rank.
28 Number of non-single click sessions: measures the number of sessions in which a document was clicked along with others.
29 Number of non-single click queries: measures the number of queries a document was clicked along with others.
3.4 Finalizing the Data Sets
To finalize the data sets, we first represented each query-document pair in a standardized way. The final set has 5,200 feature vectors, one for each query-document pair formatted as: (relevance score) qid:(query id) 1:(feature 1) 2:(feature 2) ... #docid = (document id). This format is compatible with the one used by the Letor dataset [Liu et al. 2007]. There are in fact two datasets: one with all the proposed features, i.e., with standard and clickthrough features (called fullset (FS)), and another one with clickthrough features removed (called no-clickthrough (NC)).
The next step was the normalization of the features of each document in the two datasets. Normal-ization was necessary because the absolute values of the document features in different queries might vary a lot, being not comparable. We normalized all the features, putting them in the range from 0 to 1, using the same process as described in [Liu et al. 2007].
For releasing to the community, besides providing the two previously described datasets FS and NC, with all feature vectors for all query-document pairs, we also provided a split of the collection as follows. We partitioned each dataset into three parts with about the same number of queries, for three-fold cross validation. In each partition we used one part for training, one part for validation, and one part for test. The training set was used to learn the ranking models, the validation set was used to tune the parameters of the learning algorithms, such as the number of iterations in RankBoost and the combination coefficient in the objective function ofSV Mrank. Finally, the test set was used to
evaluate the performance of the learned ranking models. This process was done ten times, so that each time a different portion of the collection was randomly chosen to compose the three folds (training, validation, and test), meaning that, in practice, in the end we had 30 randomly chosen folds. Note that since we conducted three-fold cross validation ten times in our experiments, the reported performance of a ranking method is actually the average performance in the test sets over the 30 trials.
The WCL2R collection, as summarized in Table V, is made available to the research community and can be downloaded fromhttp://www.latin.dcc.ufmg.br/collections/wcl2r.
4. EXPERIMENTS AND RESULTS
We start by describing the chosen L2R algorithms we evaluated and the evaluation metrics, followed then by the experimental setup, experimental results, and discussion on these results.
4.1 L2R Algorithms
Four well-known Learning to Rank algorithms were chosen: SV Mrank, LAC, GP and RankBoost.
L2R task. All of them have already had good performance when applied on several collections (e.g. LETOR datasets). Because of this, they were chosen for evaluating WCL2R and their results can be considered as baselines for future comparison with other approaches.
First, we picked SV Mrank [Joachims 2002; 2006], a Vapnik’s Support Vector Machine [Vapnik
1995] implementation for the ranking problem. Support Vector Machines (SVMs) is a supervised learning method forsolving classification problems. The main idea of SVM is to construct a separating hyperplane in ann-dimensional space (wherenis the number of attributes of the entity being classified, i.e., its dimensionality), that maximizes the margin between two classes. Intuitively, the margin can be interpreted as a measure of separation between those classes. The margin gives the degree of separation between them and can, intuitively, be interpreted as a measure of the quality of the classification. After [Joachims 2002], SVM was applied for learning ranking functions in the context of information retrieval. The basic idea of SVMrank is to formalize learning to rank as a problem of
binary classification on document pairs, where two classes are considered for applying SVM: correctly ranked and incorrectly ranked pairs of documents.
The second one was LAC [Veloso et al. 2008], a lazy associative classifier, that uses association rules. Association rules are patterns describing implications of the formX → Y, where we callX the antecedent of the rule, and Y the consequent. The rule denotes the tendency of observingY when X is observed. Association rules have been originally conceived for data mining tasks. For sake of ranking, we are primarily interested in using the training data to map features to relevance levels. In this case, rules have the form X →ri, where the antecedent of the rule is a set of features and
the consequent is a relevance level. Two measures are used to quantify the quality of a rule. The support (or frequency) ofX →ri is the fraction of examples in the training data containing features
X and relevanceri. The confidence ofX →ri is the conditional probability ofrigivenX. To ensure
that the rule represents a strong implication betweenX andri, a minimum confidence threshold is
employed during rule generation. Also, to avoid a combinatorial explosion while generating the rules, a minimum support threshold is employed, so that only sufficiently frequent rules are generated. In order to estimate the relevance of a document, it is necessary to combine the predictions performed by different rules. The strategy is to interpret each rule X →ri as a vote given by X for relevance
levelri. Votes have different weights, depending on the confidence of the corresponding rules. The
weighted votes for relevanceriare summed and then averaged by the total number of rules predicting
ri. Thus, the score associated with relevance ri is essentially the average confidence associated with
rules that predictri.
The third was GP, an implementation of the algorithm described at [Almeida et al. 2007], based on Genetic Programming. GP is an inductive learning method introduced by Koza [Koza 1992] as an extension to Genetic Algorithms (GAs). It is a problem-solving system designed following the principles of inheritance and evolution, inspired by the idea of Natural Selection. The space of all possible solutions to the problem is investigated using a set of optimization techniques that imitate the theory of evolution. The GP evolution process starts with an initial population of individuals, composed by terminals and functions. Usually, the initial population is generated randomly. Each individual denotes a solution to the examined problem and is represented by a tree. To each one of these individuals is associated a fitness value. This value is determined by fitness function that calculates how good the individual is. The individuals will evolve generation by generation through genetic operations such as reproduction, crossover, and mutation. Thus, for each generation, after the genetic operations are applied, a new population replaces the current one. The process is repeated over many generations until the termination criterion has been satisfied. This criterion can be, for example, a maximum number of generations, or some level of fitness to be reached.
and combines these weak rankers to get the final ranking function. After each round, the document pairs are re-weighted by decreasing the weights of correctly ranked pairs and increasing the weights of incorrectly ranked pairs.
4.2 Evaluation Metrics
The evaluation metrics used here are based on [Liu et al. 2007], where they were also used and explained. They are: NDCG@n,P@n, andMAP.
Normalized discount cumulative gain (NDCG) is a measure for handling multiple levels of relevance judgments. In addition, NDCG considers as more valuable highly relevant documents than marginally relevant document, and it penalizes lower ranking positions, because they have less likelihood to be examined. The NDCG score at positionn(N DCG@n) given a queryqis shown in Equation 1.
N DCG@n=Zn n
X
j=1
2r(j)−1
log(1 +j) (1)
wherer(j)is the relevance rating of a documentdj andZn is a normalization factor.
We also use mean precision at positionn(P@n) which measures the relevance of the topndocuments in a ranking list with respect to a query. P@nis calculated as seen in Equation 2.
P@n=
Pn
j=1r(j)
n (2)
wherer(j)is the relevance score assigned to a documentdj, being 1 (one), if the document is relevant
and 0 (zero) otherwise.
Finally, we use mean average precision (MAP) which is a widely used measure in IR. Average precision is computed as the sum of precisions for each retrieved relevant document, divided by the number of relevant documents for a queryq, as shown in Equation 3.
AV G(q) =
P|Dq|
j=1 r(j)×P@j
|Rq|
(3)
wherer(j)is the relevance score assigned to a documentdj, being 1 (one), if the document is relevant
and 0 (zero) otherwise,Dq is the set of retrieved documents andRq is the set of relevant documents
for the queryq. MAP calculates the mean of average precisions of each query available in the set as shown in Equation 4.
M AP =
P|Q|
q=1AV G(q)
|Q| (4)
whereQis a set of queries.
Basically, P@n (Precision at n) measures the relevance of the first n documents returned for a given query, and MAP (Mean Average Precision) is the average of the P@n values for all relevant documents. However, P@n and MAP can only handle cases of binary relevance judgments (relevant or not) while the problem discussed here deals with more levels (four as discussed before). So, it is convenient to add the NDCG@n (Normalized Discount Cumulative Gain atn) metric, which can handle these multiple levels of judgment. This metric gives a higher weight to documents with higher relevance, and proportionally lower weights to the others, also giving lower weights to documents that are returned in lower positions of the ranking.
4.3 Feature Ranking
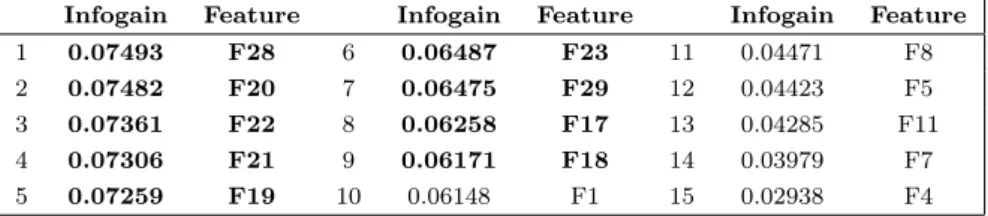
versus the clickthrough features, and within the second set, which ones were the best discriminators. To do it so, we used standard feature selection algorithms such as Infogain and Chi-Square [Rogati and Yang 2002], which are able to rank features based on their discriminative powers. Results of both methods were very similar and the Infogain results are shown in Table VI. The table presents the top fifteen features of the FS dataset, being each feature referenced by the number assigned to it, as explained in Section 3.3.
Infogain Feature Infogain Feature Infogain Feature
1 0.07493 F28 6 0.06487 F23 11 0.04471 F8
2 0.07482 F20 7 0.06475 F29 12 0.04423 F5
3 0.07361 F22 8 0.06258 F17 13 0.04285 F11
4 0.07306 F21 9 0.06171 F18 14 0.03979 F7
5 0.07259 F19 10 0.06148 F1 15 0.02938 F4
Table VI. Infogain (clickthrough features are highlighted in bold).
We can make interesting observations based on these results. The first one is that nine of the most discriminative features (top15) are from the clickthrough subset, what gives us important evidence that these features may bring important and helpful information to document ranking. The second is that features 28, 20, and 22 were the best ranked ones, and the three of them measure aspects related to the click distribution and density. This is important in the sense that these features were designed to help dealing with possible noisy information that clicks can bring. For example, high values for features 20 and 22 point that a document was clicked in several sessions, for the same query or for different ones, and so it is more unlikely that all of those clicks were accidental. On the other hand, a high value for feature 28, as explained in Section 3.3.2, points that sessions in which the document was clicked are unlikely to be unfinished ones since more than one document was clicked.
4.4 Benchmark Results
Results in terms of MAP obtained with the four selected learning to rank algorithms and the two datasets (FS and NC) are shown in Table VII. These results are the averages of the 10 runs of 3-fold cross-validation experiments, i.e., they correspond to the average of 30 trials. Table VII also presents the one-tailedt-testp-values obtained from the comparison of each algorithm in each dataset, indicating if the results obtained with the FS dataset are statistically superior or not to the results obtained with the NC dataset. For example, with ap-value of 0.1, we can tell, with a 90% confidence, that the results are superior. As we can see, in Table VII, the p-values results were very small indicating a statistical confidence approaching 100%. We also performed a Wilcoxon Signed-Rank test, whose results are not shown in Table VII, but are explained throughout the text. The Wilcoxon Signed-Rank test should be used when the population cannot be assumed to be normally distributed. Finally, in the last column of Table VII we show for each ranking method, the number of folds in which results with FS are superior to those with NC with 90% confidence. These last results were obtained with the LETOR’s Eval-Tool [Liu et al. 2007].
Algorithm FS NC p FS > NC
SV Mrank
0.432 0.381 4.646E-12 26/30
LAC 0.427 0.357 2.511E-15 28/30
GP 0.422 0.362 1.507E-11 22/30
RankBoost 0.412 0.355 6.638E-12 21/30
First, we should notice that for the majority of the folds and all algorithms the results with the FS dataset outperform the results without clickthrough (NC). The worst result was obtained by RankBoost in which, with a confidence of 90%, the results with clickthrough in 9 folds were not superior to those without this information. On the other hand, LAC obtained statistically superior results in 28 out of 30 folds with the same confidence. Another interesting fact to notice is that LAC was the algorithm that best benefited from the clickthrough information, obtaining gains of almost 20% over the data without this information. The smallest gains were obtained by SV Mrank, with
about 13% of improvement.
We start now to compare the relative performance of the algorithms in our two datasets. In these comparisons, we only affirm that an algorithm A outperforms another algorithm B, on average, based on both, Wilcoxon andt-tests, with a 90% confidence. In other words, we only consider that A is better than B, if the two statistical tests used accuse that simultaneously. Thus, considering MAP in the FS dataset (Table VII), on average,SV Mrank is statistically superior to the other three algorithms, the
largest gains being obtained against RankBoost (around 5%). Using the NC dataset,SV Mrank also
outperforms the three algorithms, now by largest margins (around 7% against LAC and RankBoost and 5% against GP) which reinforces the gains obtained by all algorithms with clickthrough data.
FS NC
Algorithm @1 @3 @10 @1 @3 @10
SV Mrank
0.400 0.455 0.397 0.381 0.379 0.395 LAC 0.383 0.449 0.385 0.359 0.365 0.334 GP 0.362 0.435 0.387 0.310 0.351 0.346 RankBoost 0.378 0.416 0.369 0.355 0.358 0.334
Table VIII. P@n for the FS and NC datasets
FS NC
Algorithm @1 @3 @10 @1 @3 @10
SV Mrank
0.314 0.353 0.395 0.265 0.301 0.339 LAC 0.296 0.360 0.403 0.244 0.266 0.315 GP 0.288 0.344 0.396 0.221 0.262 0.318 RankBoost 0.295 0.328 0.375 0.247 0.264 0.305
Table IX. NDCG@n for the FS and NC datasets
Tables VIII and IX show the results for the P@n and NDCG@n metrics considering the average results of the 30 trials. Considering the FS dataset, in the first position of rank,SV Mranksignificantly
outperforms GP in terms of precision, with a margin of 10% and is statistically tied with LAC and RankBoost. In terms of NDCG, in the first position of the rank, SV Mrank outperforms all three
algorithms with the largest gains against GP (9%). RankBoost had the worse results, being never better than any of the other algorithms in terms of precision and NDCG in any position of the rank. As we consider more ranking positions, results of SV Mrank, in comparison with the other three
algorithms, have opposite trends with both metrics. With NDCG, results start getting closer. For example, in terms of NDCG@10,SV Mrank is only better than RankBoost. In fact, NDCG@10 with
FS is the only case in which LAC is superior toSV Mrank by a small margin (2%). However, when
we consider P@10,SV Mrank ouperforms all three algorithms, by at most 8% against RankBoost.
Using the NC dataset, SV Mrank is superior to the other three algorithms in terms of MAP,
NDGC@3, and NDCG@10, with the largest gains over RankBoost in NDCG@10 (11%). Still in terms of NDCG,SV Mrank is not superior to RankBoost only in the first position of the rank,
out-performing the other two algorithms also in terms of NDCG@1. In terms of precision, SV Mrank
outperforms GP, RankBoost and LAC in almost all positions of the rank, being tied with LAC only in terms of P@1.
values in more than 15% and 17%, respectively, and their NDGC@n average values in more than 28% for both algorithms. The lowest gains were obtained by theSV Mrankalgorithm (around 8% in terms
of P@n and 17% in terms of NDCG@n) which had already a good performance in the NC dataset.
As we could see, all algorithms performed better with the FS dataset, but comparing the perfor-mances of the four of them we can observe that, for each dataset, different algorithms performed differently. Thus, to evaluate the overall performance of those algorithms, we used a metric named
winning number. This metric is based on a proposal described in [Li 2010] with some adaptions to take into account not only the number of algorithms outperformed, but also the differences among them, when the results are statistically significant. So, thewinning number formula can be defined as follows:
Si(M) =
2 X
j=1 4 X
k=1
f{Mi(j),Mk(j)}, (5)
f{Mi(j),Mk(j)}=
Mi(j)−Mk(j) se Mi(j)> Mk(j)
0 se Mi(j)≤Mk(j) (6)
wherej is the dataset index (in our case, 1 or 2), k is the algorithm index (in our case, 1 to 4), i
is the index of the algorithm being tested, andMi(j)is the performance of thei-th algorithm on the
j-th dataset in terms of a measureM (MAP, NDCG@n or P@n). So,Si(M) (winning number) is the
sum of thef function value for the algorithm being tested with every algorithmk, on each datasetj, beingf the difference between the performance in terms of the measure M of two algorithms i and
k in a datasetj, if Mi(j)is higher thanMk(j). Otherwise, the f value is 0. To affirm that aMi(j)
is higher than aMk(j) we run Wilcoxon and t-tests to ensure that the difference between them is
statistically significant with a 90% confidence level. In case one (or both) the tests fails we consider a tie, and the difference is not computed.
So, if an algorithmihad a good performance for measureM, and outperformed several others with a good difference for both datasets, it will have a high winning number value. On the other hand, if an algorithm can not outperform any other in terms of a measureM on any of the datasets, its
winning number will be zero.
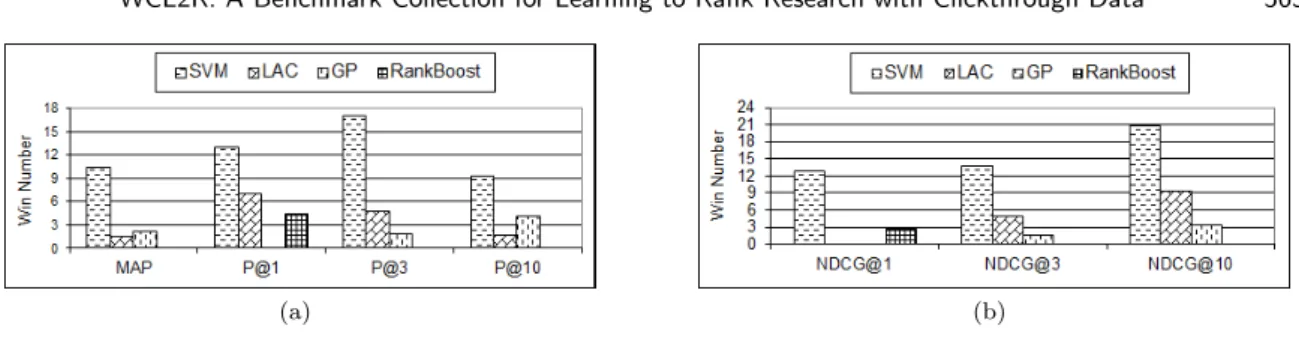
Figure 1 compares thewinning number values considering P@n, NDCG@n and MAP measures for the four algorithms and the two datasets. We can observe that in terms of MAP the top performer was SV Mrank, with LAC and GP having significantly smaller winning numbers. RankBoost’s winning
number value was zero as it never won against any other algorithm in terms of MAP. Considering precision and NDCG, again,SV Mrank was the top performer. RankBoost, on the other hand, had
satisfactory results considering only the first rank position, in terms of precision and NDCG, despite of being not as good asSV Mrank. However when we consider the other rank positions, RankBoost’s
performance was always outperformed or got tied. GP was not so good considering the first rank position, but its performance increased as we go down in the rank. The same is true for LAC in terms of NDCG but the opposite trend is seen in terms of precision. GP had a good performance in terms of precision considering the top 10 positions of the rank, beating LAC and RankBoost, while LAC performed similarly in terms of NDCG@10, beating GP and RankBoost, but also loosing to SV Mrank.
5. CONCLUSIONS AND FUTURE WORK
(a) (b)
Fig. 1. Comparison cross two datasets by (a) P@n and MAP and (b) NDCG@n
shown that the most discriminative ones are in fact those features based on clickthrough information. In addition, we performed a comparative study of several L2R algorithms on WCL2R. Our experi-mental results shown that clickthrough features could also improve the effectiveness of the L2R task, since all of methods could obtain significant improvements when clickthrough data was used.
As future work, we intend to expand the assessment experiments, increasing the amount of features (including new ones based on clickthrough), queries and documents available. We also plan to further investigate models to predict when to use the clickthrough features (and when not). Moreover, we intend to make available new datasets in which relevance judgments could be indirectly based on clickthrough information instead of (expensive) manual assessments. Finally, we intend to continue benchmarking the collection with new L2R algorithms, including some of our own.
6. ACKNOWLEDGEMENTS
We would like to thank Stephen Robertson for his important comments on the assessment experiment design report. This work is partially supported by the projects INCT-Web (MCT/CNPq/FAPEMIG grant 57.3871/2008-6), InfoWeb (MCT/CNPq 55.0874/2007-0), and by the authors’ individual grants and scholarships from CNPq, FAPEMIG, and CAPES.
REFERENCES
Agichtein, E.,Brill, E.,and Dumais, S.Improving web search ranking by incorporating user behavior information. InProceedings of the International ACM SIGIR Conference on Research & Development of Information Retrieval. Seattle, WA, USA, pp. 19–26, 2006.
Almeida, H.,Gonçalves, M.,Cristo, M.,and Calado, P.A combined component approach for finding collection-adapted ranking functions based on genetic programming. InProceedings of the International ACM SIGIR Confer-ence on Research & Development of Information Retrieval. Amsterdam, The Netherlands, pp. 399–406, 2007. Atalla, F.,Miranda, D.,Almeida, J.,Gonçalves, M. A.,and Almeida, V. Analyzing the impact of churn and
malicious behavior on the quality of peer-to-peer web search. InProceedings of the ACM Symposium on Applied Computing. Fortaleza, Brazil, pp. 1137–1144, 2008.
Baeza-Yates, R. A. and Ribeiro-Neto, B. A.Modern Information Retrieval. ACM Press / Addison-Wesley, 1999. Brin, S. and Page, L.The anatomy of a large-scale hypertextual Web search engine. InProceedings of the Internation
World Wide Web Conference. Amsterdam, The Netherlands, pp. 107–117, 1998.
Calado, P. P.The WBR-99 collection – description of the WBR-99 collection data-structures and file formats, 2003. http://www.linguateca.pt/Repositorio/WBR-99/wbr99.pdf.
Cao, Z.,Qin, T.,Liu, T.,Tsai, M.,and Li, H. Learning to rank: from pairwise approach to listwise approach. In Proceedings of the International Conference on Machine Learning. Corvallis, OR, USA, pp. 129–136, 2007. Dou, Z.,Song, R.,Yuan, X.,and Wen, J.-R. Are click-through data adequate for learning web search rankings?
InProceedings of the International Conference on Information and Knowledge Engineering. Napa Valley, CA, USA, pp. 73–82, 2008.
Dupret, G. and Liao, C. A model to estimate intrinsic document relevance from the clickthrough logs of a web search engine. InProceedings of Third ACM International Conference on Web Search and Data Mining. New York City, New York, USA, pp. 181–190, 2010.
Gao, J.,Yuan, W.,Li, X.,Deng, K.,and Nie, J.-Y. Smoothing clickthrough data for web search ranking. In Proceedings of the International ACM SIGIR Conference on Research & Development of Information Retrieval. Boston, MA, USA, pp. 355–362, 2009.
Herbrich, R.,Graepel, T.,and Obermayer, K. In ,Large margin rank boundaries for ordinal regression, 2000. Ji, S.,Zhou, K.,Liao, C.,Zheng, Z.,Xue, G.-R.,Chapelle, O.,Sun, G.,and Zha, H. Global ranking by
exploiting user clicks. InProceedings of the International ACM SIGIR Conference on Research & Development of Information Retrieval. Boston, MA, USA, pp. 35–42, 2009.
Joachims, T. Optimizing search engines using clickthrough data. InProceedings of the ACM SIGKDD International Conference on Knowledge Discovery and Data Mining. Edmonton, Alberta, Canada, pp. 133–142, 2002.
Joachims, T.Training linear SVMs in linear time. InProceedings of the ACM SIGKDD International Conference on Knowledge Discovery and Data Mining. Philadelphia, Pennsylvania, USA, pp. 217–226, 2006.
Koza, J. Genetic Programming: On the programming of computers by natural selection. MIT Press, 1992.
Li, T. Q. T.-Y. L. J. X. H.Letor: A benchmark collection for research on learning to rank for information retrieval. Information Retrieval13 (4): 346–374, 2010.
Liu, T. Y.,Xu, J.,Qin, T.,Xiong, W.,and Li, H. Letor: Benchmark dataset for research on learning to rank for information retrieval. InProceedings of SIGIR 2007 Workshop on Learning to Rank for Information Retrieval. Amsterdam, The Netherlands, pp. 3–10, 2007.
Moura, E. S. d.,Santos, C. F. d.,Araujo, B. D. s. d.,Silva, A. S. d.,Calado, P.,and Nascimento, M. A. Locality-based pruning methods for web search.ACM Transactions on Information Systems 26 (2): 1–28, 2008. Nie, L.,Davison, B. D.,and Qi, X. Topical link analysis for web search. InProceedings of the International ACM
SIGIR Conference on Research & Development of Information Retrieval. Seattle, WA, USA, pp. 91–98, 2006. Page, L.,Brin, S.,Motwani, R.,and Winograd, T. The pagerank citation ranking: Bringing order to the web.
Technical Report 1999-66, Stanford InfoLab. November, 1999. Previous number = SIDL-WP-1999-0120.
Pôssas, B.,Ziviani, N.,Meira, Jr., W.,and Ribeiro-Neto, B.Set-based vector model: An efficient approach for correlation-based ranking. ACM Transactions on Information Systems23 (4): 397–429, 2005.
Qin, T.,Zhang, X.,Wang, D.,Liu, T.,Lai, W.,and Li, H. Ranking with multiple hyperplanes. InProceedings of the International ACM SIGIR Conference on Research & Development of Information Retrieval. Amsterdam, The Netherlands, pp. 279–286, 2007.
Radlinski, F. and Joachims, T.Query chains: learning to rank from implicit feedback. InProceedings of the ACM SIGKDD International Conference on Knowledge Discovery and Data Mining. Chicago, IL, USA, pp. 239–248, 2005. Radlinski, F. and Joachims, T. Active exploration for learning rankings from clickthrough data. InProceedings of the ACM SIGKDD International Conference on Knowledge Discovery and Data Mining. San Jose, CA, USA, pp. 570–579, 2007.
Radlinski, F.,Kurup, M.,and Joachims, T.How does clickthrough data reflect retrieval quality? InProceedings of the International Conference on Information and Knowledge Engineering. Napa Valley, CA, USA, pp. 43–52, 2008. Rogati, M. and Yang, Y.High-performing feature selection for text classification. InProceedings of the International
Conference on Information and Knowledge Engineering. McLean, VA, USA, pp. 659–661, 2002.
Salton, G., Wong, A.,and Yang, C. S. A vector space model for automatic indexing. Communications of ACM18 (11): 613–620, 1975.
Sparck-Jones, K.,Walker, S.,and Robertson, S. E.A probabilistic model of information retrieval: development and comparative experiments.Information Processing and Management36 (6): 779–808, 2000.
Tsai, M.,Liu, T.,Qin, T.,Chen, H.,and Ma, W. FRank: a ranking method with fidelity loss. InProceedings of the International ACM SIGIR Conference on Research & Development of Information Retrieval. Amsterdam, The Netherlands, pp. 383–390, 2007.
Vapnik, V. N. The nature of statistical learning theory. Springer-Verlag New York, Inc., New York, NY, USA, 1995. Veloso, A.,Almeida, H.,Gonçalves, M.,and Meira, W.Learning to rank at query-time using association rules. InProceedings of the International ACM SIGIR Conference on Research & Development of Information Retrieval. Singapore, pp. 267–274, 2008.
Voorhees, E. M. and Harman, D. Overview of the seventh Text REtrieval Conference (TREC-7). InProceedings of TREC-7. Gaithersburg, MD, USA, pp. 1–24, 1998.
Voorhees, E. M. and Harman, D.Overview of the eighth Text REtrieval Conference (TREC-8). InProceedings of TREC-8. Gaithersburg, MD, USA, pp. 1–24, 1999.
Xu, J.,Chen, C.,Xu, G.,Li, H.,and Abib, E. R. T.Improving quality of training data for learning to rank using click-through data. InProceedings of Third ACM International Conference on Web Search and Data Mining. New York, NY, USA, pp. 171–180, 2010.