A Work Project, presented as part of the requirements for the Award of a Masters Degree in Finance from the Nova School of Business and Economics.
WHEN NOT-FOR-PROFIT TRY TO INFLUENCE FIRMS
MARIA DO CARMO BORBA DE CASTRO 367
A Project carried out with the supervision of: Ana Marques
ABSTRACT
I study the influence of not-for-profit entities in companies, through shareholders
proposals in the U.S. largest companies. This paper analyzes the not-for-profit entities
involved, the issues addressed by the proposals and the financial characteristics of target
companies, as well as market reactions and voting outcomes. Results indicate that
not-for-profit entities tend to target companies with higher profitability and value more
frequently than general investors. Furthermore, the voting outcome is influenced by
insider ownership and types of proposals. Finally, market reactions change with
profitability, leverage, ownership structure and types of proposals.
1. INTRODUCTION
Shareholders can express their opinions and try to influence a firm by submitting
proposals to be voted at shareholders meetings. General meetings are held every year
and gather the directors and the shareholders of the company. The proposals submitted
require fifty percent of the votes from the shareholders in their meeting to win a
majority vote. Managers advise shareholders to vote for or against each proposal.
According to Institutional Shareholder Services (ISS) 2011, in 2010, companies
consider that their engagements with shareholders have increased. Financial press
reports that a significant number of nonprofit institutions (NPIs) participates in
shareholders meetings (Gogoi 2011, Crosby 2000). These organizations do not exist
primarily to generate profits and do not issue share capital or distribute their surplus by
shareholders, founders or board members. According to 1993 System of Nation
Accounts (SNA), they are also separate from government, self-governing and
non-compulsory. The most common type of non-for-profit institutions are religious
congregations, trade and labor unions, trade and professional associations, public arts
and political organizations, foundations and social and sports clubs. The United Nations
(2003) states that NPIs constitute a significant and growing economic force in the U.S.
and in several countries throughout the world. This paper tries to answer the following
question: do nonprofit investors actively monitor firms?
Previous papers illustrate the influence of shareholders proposals in corporate
governance (Renneboog and Szilagyi 2011, Noe 2002, Almazan et al. 2005) but none
studied the proposals of NPIs. Thus, nothing is known about what the proposals are
My study of the participation of non profits in the general meetings begins with
a characterization of the entities involved and their proposals. I perform an event study
to test whether shareholders proposals from non profits cause a market reaction. Given
that these proposals can be seen as disciplinary mechanisms, I expect to find a
significant market reaction. I also perform statistic tests to assess for differences in
market reactions between shareholders proposals’ sponsors and voting outcomes.
Therefore, I compare, on one hand the target companies of not-for-profit institutions
with target companies of other type of investors, and on the other hand, the companies
that have approved proposals with the ones that have only not approved proposals.
I find that a substantial number of proposals in 2009 is submitted by
non-for-profit institutions. These proposals are related to several issues, but most of them are
about advisory vote in executive compensation. The event study indicates that the stock
market reaction is higher after the proxy and meeting dates than before those dates.
While the cumulative abnormal returns around the proxy date are positive, there is no
evidence that abnormal returns around the meeting date are positive or nonzero. By
comparing the target companies of non-for-profit institutions with other type of
investors, I find that the first ones tend to have higher book-to-market ratio, return on
assets, EPS growth and market capitalization.
About the models, the results suggest that the percentage of votes for the
proposals tends to be higher in companies with lower percentage of insider ownership.
For six types of proposals both voting outcome and probability of being approved vary.
About the stock price reaction around proxy date, it is negatively related to profitability,
leverage and percentage of institutional ownership of companies. The dummy variables
too. Besides the variables that influence the returns around the announcement date, the
percentage of insider ownership and majority vote are also negatively related with the
abnormal returns surrounding the shareholders meeting date. Furthermore other type of
proposals, namely credit card practices and equity compensation retention, cause
different market reactions around meeting date.
This paper offers new evidence about the not-for-profit’s proposals. My study
highlights the actively participation of this type of investors in shareholders meetings,
that have never been investigated before. My paper contributes to the debate of
shareholder activism, on which type of companies non-for-profit entities tend to submit
proposals, summarizing the main differences from the target companies of other
investors.
In line with other papers, I examine the outcomes in terms of stock price impact
and voting success. Contributing to the literature, I use indicators for valuation,
profitability, growth, size, leverage and ownership structure. In addition to the effect of
these indicators, I study the possible impact of the different type of proposals in
dependent variables (% of votes in favor and CARs).
2. LITERATURE REVIEW
There are plenty of studies which analyze the role of shareholders in corporate
governance. These articles discuss the influence of several types of shareholders in
different areas of an organization, in different periods of time, and in several countries.
Gillan and Starks (2003) mention the evolution of shareholder activism in general (also
in the United States) and analyze the evidence provided by several empirical studies on
causal relationship between activism and the changes in the business activities of
companies. Furthermore, by analyzing different types of shareholders and proposals,
Gillan and Starks (2000) argue that activism of non-coordinated groups has been
ineffective in the United States. They observe the voting outcomes and short-term
market reactions for the different types of proposals and sponsor identity. Thomas and
Cotter (2007) find evidence for a higher number of proposals and level of support from
shareholders in the period between 2002-2004 than in earlier periods in the U.S..
Akhigbe et al. (1997) find evidence confirming that firms benefit from increased
monitoring, as a result of shareholder activism. Karpoff et al. (1996) report that poorly
prior performed companies tend to attract proposals. Noe (2002) adds that strategic
investors monitor management in an effectively and profitably way. Finally, Sjöström
(2009) proposes that shareholders can be seen as norm entrepreneurs, given that they
use their ownership to change norms.
Wen (2009), Sjöström (2008 and 2009), Proffitt and Spicer (2006), Frantz and
Instefjord (2007), Tkac (2006) and Guay et al. (2004) are examples of recent studies
which analyze the actions undertaken by shareholders in order to influence a company’s
corporate social responsibility. Wen (2009) and Proffitt and Spicer (2006) concentrate
their analysis in institutional investors’ activism, revealing a growing awareness of
social responsible investments of this type of investors. Proffitt and Spicer (2006),
Sjöström (2008) and Tkac (2006) point out that religious groups were the most active
investors in the field of corporate social responsibility in the US. Tkac (2006)
distinguishes other groups, like social organizations and socially responsibility mutual
funds, and studies the social activism via shareholders proposals. She concludes that
groups were withdrawn. However, the types of investors and proposals are not the only
determinant of the voting results. Renneboog and Szilagyi (2011) study
shareholder-initiated proxy proposals and find that both the voting outcomes and the announcement
period stock price effects are affected by governance quality. Gifford (2010) defines
high levels of power, legitimacy and urgency and the target company managers as the
most significant factors that contribute to shareholder salience in improving
environmental, social and corporate governance performance of investee company.
Ertimur et al. (2010) find significantly that implementation decision varies with
shareholders pressure and type of proposals.
Recent literature reports on the relationship between shareholder activism and
compensation within the companies. This is because according to Dodd-Frank Act
(2011, US), publicly traded firms must let shareholders get a regular (but not binding)
vote on executive pay packages, or a “say on pay”. Ertimur et al. (2011) argue that
activists target firms with higher levels of CEO compensation. They defend that in
companies where CEO payment is excessive, voting support on advisory vote proposals
is higher. Ferri and Sandino (2009) explore the expensing of employee stock options.
They find evidence proving that in companies where shareholders proposals related to
this expense were submitted, the CEO compensation decreased. In June 2011, CFO
publishes an article about the increased power given to shareholders in the last years
through, for example, the Dodd-Frank Act. Companies are giving more attention about
what investors want. However, they fear that a no vote on executive pay packages will
3. SAMPLE AND DESCRIPTIVE STATISTICS
I use information about the proposals of 190 of the largest firms in the S&P500
Index, this was hand-collected from the 2009 proxy statements.1 Given that the capital
of the largest US firms is highly dispersed, there is a substantial number of shareholders
making proposals. Furthermore, due to their size, these firms have a high importance in
the economy. Financial data comes from Compustat and market data is retrieved from
CRSP.
Table 1 reports the type of proposals submitted by non-for-profit entities in the
sample firms in 2009. The most frequent type of proposal is the one about advisory vote
on compensation of executives (17 out of a total of 47 proposals, with a participation of
24 out of a total of 78 not-for-profit institutions). Next are health care principles (5
proposals and 7 NPIs) and political contributions and expenditures (4 proposals and 4
NPIs). Although the proposals about weapons in space are not one of the most frequent
type (3 proposals), are those which involve more NPIs (19). In 2009, twenty four
percent of the proposals related to advisory vote on executive compensation were
approved. However, overall, less than nine per cent of the proposals submitted by
non-profit institutions obtained the majority of votes in the annual shareholders meeting.
Table 2 summarizes the entities that submitted more than one proposal, or whose
proposals were approved in 2009. Only fifty seven out of the eighty one entities (70%)
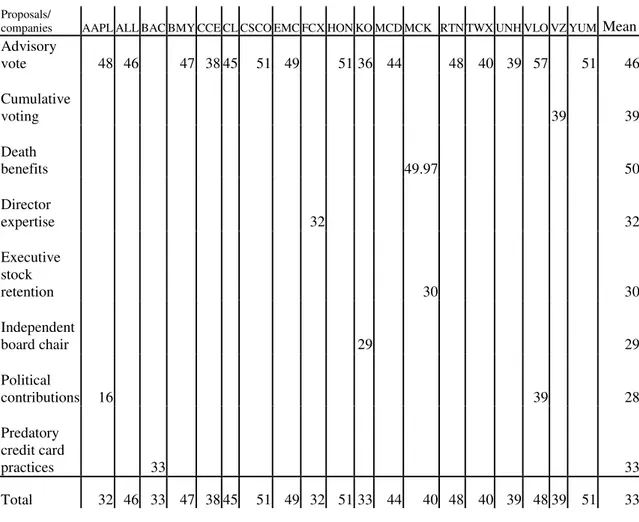
are in these conditions. Table 3 presents the percentage of votes for the proposals in the
general meetings of the firms, after I have eliminated those that have little support from
the shareholders. Companies with a mean of votes for the proposals (submitted by
1
nonprofit institutions) lower than thirty per cent were cut off from the table. Again, it
can be noted that the advisory vote on executive compensation’s proposals are the only
that were approved in 2009, by getting fifty-one percent of the votes for in Cisco,
Honeywell International, and Yum! Brands and fifty-seven percent of the votes in
Valero energy. The last column indicates that this issue has the greatest support from
shareholders, with an average of forty six percent of votes in favor. I manually check
that many of the proposals reproved in 2009 were repeated in 2010 annual meetings (28
of 43). Almost all of the replicate proposals get higher percentage of support in 2010
and five of them, (or 18%), were approved. This was in the following firms/topics:
Apple, Allstate, Colgate-Palmolive and EMC about advisory vote and for McKesson
about death benefits.
Then I analyze the market reactions to proposals by using two event windows of
three days. The event study estimate the short-term stock price impact of the thirty five
proposals of non profits by calculating cumulative abnormal returns (CARs) around the
proxy and the meeting dates.2 The proxy date is the date of the first announcement of
the proposals, when the proxy statement for annual meeting of shareholders general
information were first sent and given to them, with the proposals description and the
invitation for the event. The meeting date is the date of the annual shareholders meeting.
The CARs are calculated using a market model to estimate the expected returns
of CRSP’s value weighted. For each of the two events I analyze the CARs of three
different windows: [-1, 0], [-1, 1] and [0, 1].3 Table 4 reports descriptive statistics on the
CARs around the proxy date in Panel A and around the meeting date in Panel B.
2
From now on I consider the 35 companies that receive proposals from NPIs institutions, instead of the 47 proposals submitted by them and the 78 NPIs institutions
3
Without huge differences between them, the [1, 0] CARs have a mean of 0.009 and
-0.003 and a median of 0.004 and -0.002, [-1, 1] get a mean of 0.013 and -0.005 and a
median of 0.002 and -0.002 and [0,1] take a mean of 0.012 and -0.001 and a median of
0.003 and -0.001 around the proxy and the meeting date, respectively. This shows that a
higher reaction of stock price exists after the proxy and the meeting dates than before
those dates, as defended by Renneboog and Szilagyi (2011).
Untabulated results show that the CARs around the date of the proxy are
statistically positive (with a 10% confidence level) and CARs around the meeting date
are not statistically different from zero.
Table 5 presents the means of [-1, 1] CARs of companies that had a proposal of
each type from a not-for-profit company, during 2009. The proposals targeting health
care principles have the strongest stock price effect around the proxy date, with the
higher CARs mean (0.065). 4 Curiously, the proposals related to executive
compensation, despite of having the highest percentage of support in shareholders
meetings, are not the ones that have the highest CARs mean. Proposals related to
director expertise have the lowest CARs mean (-0.048). Around the meeting date,
cumulative voting and non-addictive brands have the lowest cumulative abnormal
returns. The proposals related to health care principles, and military sales to foreign
governments have the most positively reaction of the market.5 Overall, the effect of the
type of proposal in the CARs seems to be higher around the meeting date than around
the proxy data.
4
Submitting proposals about health care, shareholders request that the Board of Directors adopt principles for comprehensive health care principles. For example, they defend that health care coverage should be universal, continuous, and affordable to individuals and families.
5
With the proposals related military sales to foreign governments, shareholders urge the Board of
Directors to provide, a comprehensive report, of companies’ Industries’ foreign sales of military and
I analyze the different stock price reactions in the companies at which at least
one proposal receives the majority of votes in the shareholders meetings and the ones
that did not get it. In order to study the difference in mean, median and variances
between the two samples, Table 6 presents descriptive statistics and Table 7 performs
some statistical tests. Table 6 indicates that the market reacts negatively to the proposals
which won majority. All these proposals are related to advisory vote in executive
compensation. This is consistent with findings of Karpoff et al. (1996), that the average
of cumulative abnormal returns for these proposals, around the proxy date, is negative.
They suggest that compensation-related proposals destroy value and hamper operations.
For the proposals which do not cast the majority of votes, the cumulative abnormal
returns have a positive, but insignificant, mean for almost all of the event windows
around the two events. Renneboog and Szilagyi (2011) find the same result for
proposals that failed to achieve the majority of votes between 1996 and 2005. They
consider that market incorrectly anticipate which proposals will be approved.
By performing the parametric tests (cross-sectional t-test and z-test) in Table 7, I
find significant evidence about the difference in means for the windows [-1, 1] and [0,
1] between the two samples (approved and not approved) around the first announcement
of proposals. Around the meeting date the windows [-1, 0] and [-1, 1] register
significant differences between the mean of cumulative abnormal returns. Assuming
unequal variance between the groups and using a Fisher test, I find evidence about the
differences in variance for the last sample. Finally, with the nonparametric test based on
Mann-Whitney, I find significant evidence that one of the two samples tends to have
higher values than the other for [0, 1] CARs around the proxy and for [-1, 0] around the
shareholders meetings, tends to be more significant in proposals that do not won the
majority of votes. The influence of the proposal outcome in the short-term cumulative
return for [-1, 1] window is further analyzed below. Overall, I find evidence of a
difference after the proxy date and before the meeting date.
From the collected information about the proposals in the largest U.S.
companies, I compare the cumulative abnormal returns in companies where
not-for-profit submitted proposals from the others. I do not find significant differences in mean
and median in none of the estimated tests, t, z and U and I conclude that the stock price
market reaction between the two groups is the same. The fact does not contradict the
finding in Gillan and Starks (2000), that sponsored type of investors (individual and
institutional) influence the CARs, because I do not consider all individual investor, only
religious organizations.
4. MULTIVARIATE ANALYSIS
I now turn to multivariate models to analyze the voting outcome and stock market
reaction of the proposals submitted by nonprofit institutions in 2009. For the voting
outcome, I construct a linear regression model using as dependent variable the
percentage of votes in favor at the shareholders meeting. Moreover, I use linear
regression models to investigate the stock market reaction after the proxy date and after
the meeting date.
4.1. Analysis of voting outcome
In order to analyze the voting outcome, the linear regression model tests the
variables that influence the percentage of votes cast in favor of the proposals submitted
I start by using the following model:
% votes in favor = f(valuation, profitability, growth, firm size, leverage and ownership
structure, type of proposal)
Financial characteristics are important factors to consider when studying the
proposals’ effects. In fact, both Karpoff et al. (1996) and Ertimur et al. (2010) conclude
that poorly financial performed companies attract proposals. I account, as Karpoff et al.
(1996) and Thomas and Cotter (2007), for differences in valuation, profitability, growth,
stock price returns, firm size, leverage and ownership structure. They use price-to-book
ratio for appraise valuation. However, to value the target firm I use total assets (like
Renneboog and Szilagyi 2011), return on assets and book-to-market ratio (as Ertimur et
al. 2010), the ratio between book value and market value of equity (the product of price
of the company’s common stock and common shares outstanding). Theoperating return
on sales (or operating margin), evaluates the company’s operation efficiency and
profitability and is measured as earnings before interest and taxes divided by sales.
Earnings per share (EPS) growth rate, the compound annual rate of changes over the
three years preceding the proposal year, and market capitalization, the logarithm of
market value of equity, are the indicators for the growth and size of the firm,
respectively.6
The ratio between assets and long-term debt is also considered by the model to
assess leverage. I use as alternative for the leverage, as Renneboog and Szilagyi (2011),
6
the debt-to-equity ratio, the proportion of debt and equity that the company uses to
finance assets, by dividing liabilities by book value of equity. Finally, in order to
studying the ownership structure, I consider the percentage of insider and institutional
ownership as indicators.7 This indicator tends to be one of the most influential of stock
market and voting outcome, for example in Gillian and Starks (2000). Institutional
ownership refers to the percentage of outstanding shares owned by investors and insider
ownership concerns as the proportion of these shares held by insiders, that own 5% or
more of them, for example by directors and managers of the firm. The financial data is
obtained from Compustat monthly updated in North America for the fiscal year of 2009.
By considering the financial characteristics of the companies where the
non-for-profit institutions submitted proposals during 2009, target firms, I obtain the descriptive
statistics presented in Panel A of Table 8. Comparatively, Panel B presents the
descriptive statistics of the firms where non-for-profit institutions did not submit
proposals during 2009 (non-target firms). In order to compare the two groups I perform
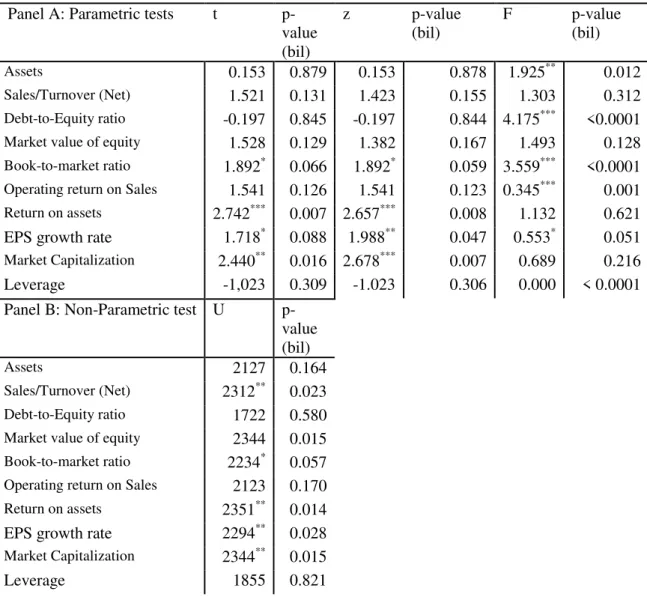
some tests, the results are shown in Table 9. In the parametric tests, Panel A, I conclude
that the book-to-market ratio, return on assets, earnings per share growth and market
capitalization means of target companies tend to be different than the other group. No
significant differences are estimated in the other variables. In the non-parametric test,
Panel B, I find significant differences between the financial values of target companies
and non-target companies in sales, book-to-market ratio, return on assets, earnings per
share growth and market capitalization. Therefore, I can conclude that not-for-profit
entities tend to target companies with relatively similar financial characteristics as than
the other shareholders. General nonprofit institutions tend to target companies with
7
higher valuation (book-to-market ratio), higher profitability relatively to assets owned
(return on assets), higher profitability per unit of equity (EPS growth) and more
valuablecompanies (higher market capitalization). Unlike Thomas and Cotter (2007) no
difference in firm size is found.
Next I compare the chosen financial indicators for two groups of companies
with different voting outcomes. One group of companies, where the submitted proposals
were approved during the year (obtaining more than fifty percent of the votes) and
other, where this goal has not been achieved. Untabulated findings indicate that there
are no differences in mean and median, between the approved and not approved
proposals, for a ten percent of significance in parametric and non parametric tests in all
the financial variables.
Table 10 presents the results of estimating equation. In model 1, with the
control variables that measure valuation (book-to-market), profitability (operating return
on sales), growth (EPS growth rate), firm size (market capitalization), leverage and
ownership structure (institutional and insider ownership), I use the dummy variables for
the type of proposals: advisory vote, energy report, genetically products, health care,
military sales and weapons in space. The variables take the value one if the proposal is
related to each one of the issue and zero otherwise. Given the dimension of the sample,
only thirty five observations, the other type of proposals is excluded from the model.8
For each one the six types of proposals I find significant evidence for different
probability of being approved. The effect is positive for advisory compensation vote and
negative for all the other issues addressed. In model 1 I also find that the percentage of
insider ownership is determinant for the percentage of votes in favor. Managers
recommend shareholders for voting against almost all of the proposals, so it is evident
that higher the percentage of insider shareholders lower is the percentage of vote in
favor.
In models 2, I use only the advisory vote type variable because half of the
proposals are about this issue. I find that the proportion of votes is negatively related
with insider ownership. The other variables related to valuation, profitability, growth,
firm size and leverage fail to enter significantly in the regression.
4.2.Analysis of abnormal returns
The stock market reaction is evaluated by the cumulative abnormal returns for
the event window [-1, 1] around the proxy and the meeting dates. Surrounding the two
events the models try to explain the influence of several variables and type of proposals
in the market reaction.
The abnormal returns analysis uses the following model specification:
CARs around proxy and meeting dates = f(valuation, profitability, growth, stock price
Variables for valuation, profitability, growth, firm size, leverage and ownership
structure are defined as above. Dummy variables for all type of proposals and majority
vote are also included in the regression.9
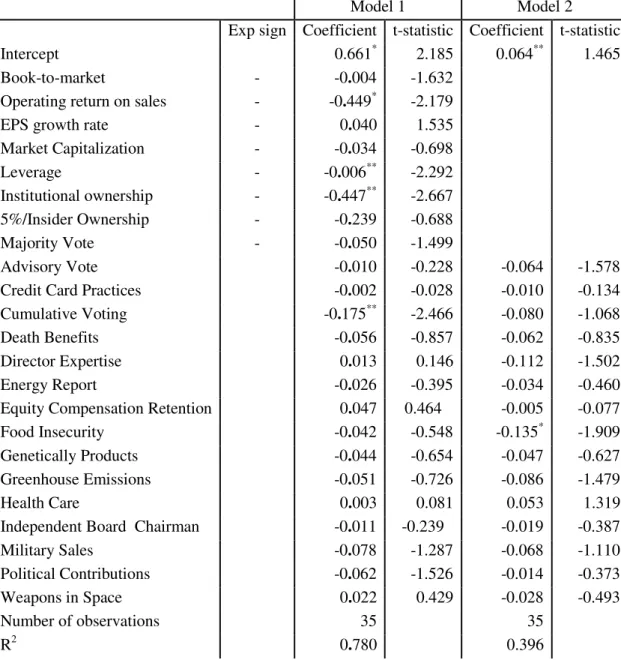
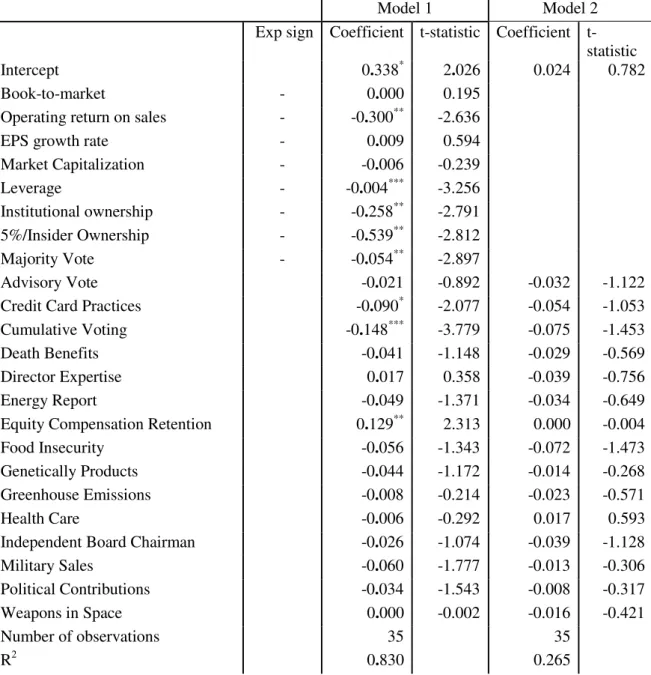
Table 11 and Table 12 exhibit the results of the regressions for market reactions,
around the dates of proxy and meeting, respectively. In model 1 for both dependent
variables, I look for the influence of the types of proposals also considering the
variables for valuation, profitability, growth, firm size, leverage, ownership structure
and majority vote. I find strictly differences between the effects of the issues addressed
in the abnormal return around the two dates. Around proxy date, only proposals related
to cumulative voting influence, negatively, the market reaction. Also proposals about
credit card practices have evidence to significantly change the abnormal returns,
negatively and equity compensation retention, positively.
The proportion of institutional ownership influences negatively the abnormal
return around both dates. Although this result is different from other studies, like
Karpoff et al. (1996), where greater institutional ownership tends to increase the CARs
around proxy date, the difference can be explained by the particular sponsor that I am
considering, nonprofit entities. Institutional shareholders pressure firms to make
organizational changes, but these issues are not the most representative type of the
proposals submitted by nonprofit institutions. Besides affecting the voting outcome, the
Insider ownership proportion also influences negatively the market reaction surrounding
the meeting date, for the same reason.
9Majority vote’ dummy
Greater profitability, measured through operating return on sales and leverage,
decrease the CARs around meeting and proxy dates. I conclude that market reaction to
proposals in poor performance companies tends to be higher. Ertimur et al. (2010)
consider that poorly performance are more likely to undergo significant governance
changes. Also Gillian and Starks (2000) find that CARs are higher in poorly performing
target companies with higher institutional ownership. As predicted, the majority vote
influences the cumulative abnormal return specially around meeting date.
In models 2, when I only include the dummy variables for types of proposals, I
find evidence for proposals related to food insecurity in the regression of CARs around
proxy date. This type of proposal tends to induce a lower market reaction around the
date of announcement.
5. CONCLUSIONS
This paper highlights the significant number of non-for-profit institutions as
active shareholders in the largest U.S. companies. It provides important information on
the type of proposal, support and the entities involved.
I have examined the voting outcome, the market reaction and all the indicators
that influence them. I have shown some financial characteristics in the companies that
receive proposals sponsored by these particular institutions and the others, discovering
some differences, particularly in firms’ valuation and profitability. Insider ownership
influences voting outcome significantly. The type of proposals also changes the likely
of the proposals to be approved. I also find evidence for the impact of operating return
on sales, leverage, valuation, majority vote and type of proposals in the cumulative
My analysis and these empirical results have contributed to the previous studies
about the discussing on shareholder activism, detailing the proposals submitted by
REFERENCE LIST
Akhigbe, Aigbe, Madura, Jeff and Tucker, Alan L..” Long-term valuation effects of
shareholder Activism”. 1997. Applied Financial Economics, 7(5): 567-573.
Almazan, Andres, Hartzell, Jay C. and Starks, Laura T..“Active Institutional
Shareholders and Costs of Monitoring: Evidence from Executive Compensation”. 2005. Financial Management, 34(4): 5-34
Crosby, Michael H.. 2000.“Religious challenge by shareholder actions: changing the
behaviour of tobacco companies and their allies”. British medical journal, 321: 375-377.
Ertimur, Yonca, Ferri, Fabrizio and Stubben, Stephen R.. 2010.“Board of directors'
responsiveness to shareholders: Evidence from shareholder proposals”. Journal of
Corporate Finance, 16: 53-72
Ertimur, Yonca, Ferri, Fabrizio and Muslu, Volkan. 2011. “Shareholder Activism
and CEO Pay”. The Review of financial studies, 24 (2): 535-592.
Ferri, Fabrizio and Sandino, Tatiana. 2009. “The impact of shareholder activism on
financial reporting and compensation: The case of employee stock options expensing.”
The Accounting Review, 84: 433-466.
Frantz, Pascal and Instefjord, Norvald. 2007. “Socially and privately optimal
shareholder activism”. Journal of Management and Governance, 11: 23-43.
Gifford, E. James M.. 2010. “Effective Shareholder Engagement: The Factors that
Contribute to Shareholder Salience”. Journal of Business Ethics, 92: 79-97.
Gillan, Stuart L. and Starks, Laura T.. 2000. “Corporate governance proposals and
shareholder activism: the role of institutional investors”. Journal of Financial Economics, 57: 275-305.
Gillan, Stuart L. and Starks, Laura T.. 2003. ”The Evolution of Shareholder
Activism in the United States”.Journal of Applied Corporate Finance, 19 (1): 55-73.
Gogoi, Pallavi. May 6, 2011. “Religious groups question Goldman on pay”. Associated Press Business Writer.
Guay, Terrence, Doh, Jonathan P. and Sinclair, Graham. 2004. “Non-governmental Organizations, Shareholder Activism, and Socially Responsible Investments: Ethical,
Strategic, and Governance Implications”. Journal of Business Ethics, 52: 125-139.
Karpoff, Jonathan M., Malatesta, Paul H. and Walkling, Ralph A.. 1996.
“Corporate governance and shareholders initiatives: Empirical evidence”. Journal of Financial Economics, 42: 365-395
Noe, Thomas H..2002. “Investor Activism and Financial Market Structure”. The Review of Financial Studies, 15(1): 289-318.
Proffit , W. Trexler R. and Spicer, Andrew S.. 2006. “Shaping the shareholder activism agenda: institutional investors and global corporate social responsibility.” Strategic Organization, 4 (2): 165-190
Renneboog, Luc and Szilagyi, Peter G.. 2011. “The role of shareholder proposals in
corporate governance”. Journal of Corporate Finance, 17: 167–188.
Sjöström, Emma. 2008. “Shareholder Activism for Corporate Social Responsibility:
What Do We Know?”. Sustainable Development, 16 (3): 141–154.
Sjöström, Emma. 2009. “Shareholders as Norm Entrepreneurs for Corporate Social
Responsibility”. Journal of Business Ethics , 94:177–191.
Thomas, Randall S. and Cotter, James F..2007.”Shareholder proposals in the new millennium: Shareholder support, board response and market reaction”. Journal of Corporate Finance,13: 368–391.
Tkac, Paula. 2006. “One Proxy at a Time: Pursuing Social Change Through
Shareholder Proposals”, Federal Reserve Bank of AtlantaEconomic Review, 1–20.
United Nations. 2003. Handbook of National Accounting: Handbook on Non-Profit Institutions in the System of National Accounts”. New York: United Nations Publication.
TABLES
Table 1 – Type of Proposals
Proposals # proposals # NPIs A NA
Advisory vote on executive compensation 17 24 4 4 14 21
Cumulative voting 1 1 1 1
Death benefits 1 1 1 1
Director expertise 1 1 1 1
Equity compensation retention 1 1 1 1
Executive stock retention 1 1 1 1
Food insecurity 1 2 1 2
Genetically engineered products 1 1 1 1
Greenhouse gas reduction 2 2 2 2
Health care principles 5 7 5 7
Human rights policy 2 2 2 2
Independent board chair 2 2 2 2
Low carbon energy report 1 1 1 1
Military sales to foreign governments 2 5 1 4
Non addictive brands 1 3 1 3
Political contributions and expenditures 4 4 4 4
Predatory credit card lending practices 1 1 1 1
Weapons in space 3 19 3 19
Total 47 78 4 4 43 74
Note: A= Approved, NA= Not approved
Table 2 – List of Non-for-profit Institutions
Non-for-profit Institutions # proposals A NA
Catholic Health East 2 2
Christian Brothers Investment Services 1 1 0
Congregation of the Sisters of Charity of Incarnate Word 6 6
Congregation of Sisters of St. Agnes 5 5
General Board of Pension and Health Benefits of the United Methodist Church 2 2
(Glenmary) Home Missioners of America 1 1 0
International Brotherhood of Teamsters General Fund 7 7
Mercy Investment Program 5 1 4
Missionary Oblates of Mary Immaculate 2 2
Nathan Cummings Foundation 7 7
Province of St. Joseph of the Capuchin Order 2 2
School Sisters of Notre Dame Cooperative Investment Fund 2 2
Sisters of Charity of Saint Elizabeth 3 3
Sisters of Mercy of the Americas 2 2
Sisters of St. Francis of Philadelphia 4 4
St. Scholastica Monastery 2 2
Unitarian Universalist Association of Congregations 4 1 3
Total 57 4 53
Table 3 – Percentage of votes for the proposal
Proposals/
companies AAPL ALL BAC BMY CCE CL CSCO EMC FCX HON KO MCD MCK RTN TWX UNH VLO VZ YUM Mean Advisory
vote 48 46 47 38 45 51 49 5136 44 48 40 39 57 51 46
Cumulative
voting 39 39
Death
benefits 49.97 50
Director
expertise 32 32
Executive stock
retention 30 30
Independent
board chair 29 29
Political
contributions 16 39 28
Predatory credit card
practices 33 33
Total 32 46 33 47 38 45 51 49 32 51 33 44 40 48 40 39 48 39 51 33
Table 4 – Cumulative abnormal returns – descriptive statistics
Variable N Minimum Maximum Mean Median St. Deviation
Panel A: Around proxy date
CAR window [-1,0] 35 -0.061 0.136 0.009 0.004 0.040 CAR window [-1,1] 35 -0.048 0.295 0.013 0.002 0.058 CAR window [0,1] 35 -0.050 0.275 0.012 0.003 0.053
Panel B: Around meeting date
Table 5 – CARs mean by type of proposal
Type of proposal Proxy date Meeting date
Advisory vote 0.003 -0.009
Cumulative voting -0.015 -0.051
Death benefits 0.002 -0.006
Director expertise -0.048 -0.015
Equity compensation retention -0.005 -0.008 Executive stock retention 0.002 -0.006
Food insecurity -0.017 -0.032
Genetically Products 0.018 0.010
Greenhouse gas emissions -0.029 -0.023
Health care principles 0.065 0.013
Human rights 0.006 -0.021
Independent board chairman 0.013 -0.031
Low carbon energy report 0.03 -0.010
Military sales to foreign governments -0.004 0.011
Non addictive brands -0.017 -0.032
Political contributions and expenditures -0.003 -0.006 Predatory credit card lending practices 0.054 -0.031
Weapons in space 0.037 0.007
Table 6 – CARs by proposal outcome – descriptive statistics
Proposal won the majority
Yes No
Variable N Min Max Mean St. Dev
N Min Max Mean St. Dev Panel A: Around proxy date
CAR
window [-1,0]
4 -0.035 0.030 0.006 0.030 31 -0.061 0.136 0.009 0.042
CAR
window [-1,1]
4 -0.030 0.010 -0.008 0.017 31 -0.048 0.295 0.016 0.061
CAR
window [0,1]
4 -0.050 0.005 -0.023* 0.025 31 -0.033 0.275 0.017* 0.055
Panel B: Around meeting date
CAR
window [-1,0]
4 -0.084 -0.005 -0.045 0.039 31 -0.062 0.055 0.002 0.024
CAR
window [-1,1]
4 -0.098 0.000 -0.038 0.047 31 -0.051 0.133 -0.001 0.034
CAR
window [0,1]
4 -0.051 0.011 -0.011 0.028 31 -0.042 0.102 0.000 0.026
Table 7 – CARs around proxy date by proposal outcome – statistic tests
Variable t p-
value
z p-
value
F p-
value
U p-
value Panel A: Around proxy date
[-1,0] -0.129 0.898 -0.168 0.867 0.512 0.646 68 0.776 [-1,1] -0.763 0.451 -1.720* 0.085 0.075* 0.054 45 0.392 [0,1] -1.406 0.169 -2.496** 0.013 0.203 0.214 23** 0.046
Panel B: Around meeting date
[-1,0] -3.428*** 0.002 -2.386** 0.017 2.525 0.153 15** 0.016 [-1,1] -1.998* 0.054 -1.529 0.126 1.967 0.28 37 0.204 [0,1] -1.406 0.169 -0.748 0.455 1.134 0.702 56 0.776
Note: *, ** and *** denote significance at 10, 5 and 1% level, respectively.
Table 8 – Descriptive statistics of financial characteristics
N Minimum Maximum Mean St. Deviation
Panel A: Target firms
Assets 35 7148 2223299 119282.961 370743.542
Sales/Turnover (Net) 35 10868 275564 50726.326 54392.943
Debt-to-Equity ratio 35 -30.908 26.889 2.524 7.862
Market value of equity 35 9097.446 322334.13 57817.859 62268.703
Book-to-market ratio 35 -5.170 17.669 3.993 4.459
Operating return on Sales 35 0.003 0.438 0.157 0.107
Return on assets 35 -0.056 0.341 0.076 0.072
EPS growth rate 35 -1.852 0.575 -0.16 0.515
Market Capitalization 35 3.959 5.508 4.582 0.391
Leverage 35 0.000 32.729 6.953 6.094
Institutional ownership 35 48.47% 94.8% 72.915% 11.027% 5%/Insider Ownership 35 0% 24.88% 2.579% 4.957%
Panel B: Non-target firms
Assets 105 4428.614 2031989 108894.306 267219.708
Sales/Turnover (Net) 105 7011.383 406103 36065.603 47648.662
Debt-to-Equity ratio 105 -18.301 17.664 2.796 3.848
Market value of equity 105 1772.054 211743.16 41726.979 50958.041
Book-to-market ratio 105 -6.180 14.799 2.502 2.364
Operating return on Sales 105 -1.149 0.512 0.118 0.183
Return on assets 105 -0.219 0.272 0.040 0.068
EPS growth rate 105 -2.924 0.370 -0.395 0.743
Market Capitalization 105 3.248 5.326 4.367 0.471
Table 9 – Statistics tests for type of entity
Panel A: Parametric tests t p- value (bil)
z p-value (bil)
F p-value (bil)
Assets 0.153 0.879 0.153 0.878 1.925** 0.012
Sales/Turnover (Net) 1.521 0.131 1.423 0.155 1.303 0.312
Debt-to-Equity ratio -0.197 0.845 -0.197 0.844 4.175*** <0.0001
Market value of equity 1.528 0.129 1.382 0.167 1.493 0.128
Book-to-market ratio 1.892* 0.066 1.892* 0.059 3.559*** <0.0001
Operating return on Sales 1.541 0.126 1.541 0.123 0.345*** 0.001
Return on assets 2.742*** 0.007 2.657*** 0.008 1.132 0.621
EPS growth rate 1.718* 0.088 1.988** 0.047 0.553* 0.051
Market Capitalization 2.440** 0.016 2.678*** 0.007 0.689 0.216
Leverage -1,023 0.309 -1.023 0.306 0.000 < 0.0001
Panel B: Non-Parametric test U p-value (bil)
Assets 2127 0.164
Sales/Turnover (Net) 2312** 0.023
Debt-to-Equity ratio 1722 0.580
Market value of equity 2344 0.015
Book-to-market ratio 2234* 0.057
Operating return on Sales 2123 0.170
Return on assets 2351** 0.014
EPS growth rate 2294** 0.028
Market Capitalization 2344** 0.015
Leverage 1855 0.821
Table 10 – Models explaining the percentage of votes in favor
Model 1 Model 2
Exp sign Coefficient t-statistic Coefficient t-statistic
Intercept 0.706** 2.231 0.234 0.491
Advisory Vote + 0.135*** 5.161 0.239*** 6.048 Energy Report - -0.179** -2.755
Genetically Products - -0.219*** -3.375
Health Care - -0.232*** -6.491
Military Sales - -0.262*** -4.663 Weapons in Space - -0.247*** -5.224
Book-to-market - 0.001 0.260 -0.007 -1.519
Operating return on Sales - -0.050 -0.383 0.143 0.609
EPS growth rate - 0.006 0.265 -0.045 -1.161
Market Capitalization - -0.057 -1.213 0.003 0.044
Leverage - 0.001 0.256 0.004 1.193
Institutional ownership + -0.172 -0.972 -0.122 -0.480 5%/Insider Ownership - -0.618*** -2.899 -0.728* -1.833
Number of observations 35 35
R2 0.919 0.645
Table 11 – Models explaining abnormal returns around the proxy date
Model 1 Model 2
Exp sign Coefficient t-statistic Coefficient t-statistic
Intercept 0.661* 2.185 0.064** 1.465
Book-to-market - -0.004 -1.632
Operating return on sales - -0.449* -2.179
EPS growth rate - 0.040 1.535
Market Capitalization - -0.034 -0.698
Leverage - -0.006** -2.292
Institutional ownership - -0.447** -2.667 5%/Insider Ownership - -0.239 -0.688
Majority Vote - -0.050 -1.499
Advisory Vote -0.010 -0.228 -0.064 -1.578
Credit Card Practices -0.002 -0.028 -0.010 -0.134 Cumulative Voting -0.175** -2.466 -0.080 -1.068
Death Benefits -0.056 -0.857 -0.062 -0.835
Director Expertise 0.013 0.146 -0.112 -1.502
Energy Report -0.026 -0.395 -0.034 -0.460
Equity Compensation Retention 0.047 0.464 -0.005 -0.077 Food Insecurity -0.042 -0.548 -0.135* -1.909 Genetically Products -0.044 -0.654 -0.047 -0.627 Greenhouse Emissions -0.051 -0.726 -0.086 -1.479
Health Care 0.003 0.081 0.053 1.319
Independent Board Chairman -0.011 -0.239 -0.019 -0.387
Military Sales -0.078 -1.287 -0.068 -1.110
Political Contributions -0.062 -1.526 -0.014 -0.373
Weapons in Space 0.022 0.429 -0.028 -0.493
Number of observations 35 35
R2 0.780 0.396
Table 12 – Models explaining abnormal returns around the meeting date
Model 1 Model 2
Exp sign Coefficient statistic Coefficient t-statistic
Intercept 0.338* 2.026 0.024 0.782
Book-to-market - 0.000 0.195
Operating return on sales - -0.300** -2.636
EPS growth rate - 0.009 0.594
Market Capitalization - -0.006 -0.239
Leverage - -0.004*** -3.256
Institutional ownership - -0.258** -2.791 5%/Insider Ownership - -0.539** -2.812
Majority Vote - -0.054** -2.897
Advisory Vote -0.021 -0.892 -0.032 -1.122
Credit Card Practices -0.090* -2.077 -0.054 -1.053 Cumulative Voting -0.148*** -3.779 -0.075 -1.453
Death Benefits -0.041 -1.148 -0.029 -0.569
Director Expertise 0.017 0.358 -0.039 -0.756
Energy Report -0.049 -1.371 -0.034 -0.649
Equity Compensation Retention 0.129** 2.313 0.000 -0.004
Food Insecurity -0.056 -1.343 -0.072 -1.473
Genetically Products -0.044 -1.172 -0.014 -0.268 Greenhouse Emissions -0.008 -0.214 -0.023 -0.571
Health Care -0.006 -0.292 0.017 0.593
Independent Board Chairman -0.026 -1.074 -0.039 -1.128
Military Sales -0.060 -1.777 -0.013 -0.306
Political Contributions -0.034 -1.543 -0.008 -0.317
Weapons in Space 0.000 -0.002 -0.016 -0.421
Number of observations 35 35
R2 0.830 0.265