Management Science Letters 5 (2015) 715–720
Contents lists available at GrowingScience
Management Science Letters
homepage: www.GrowingScience.com/msl
The effect of bank ownership concentration on capital adequacy and liquidity
Masoumeh Delbariragheba and Nowrouz Nourallah Zadehb*
aDepartment of Management and Accounting, South Tehran Branch, Islamic Azad University, Tehran, Iran
bFaculty member, Department of Management and Accounting, South Tehran Branch, Islamic Azad University, Tehran, Iran
C H R O N I C L E A B S T R A C T
Article history:
Received March 25, 2015 Received in revised format June 1 2015
Accepted June 10 2015 Available online June 12 2015
This paper presents an empirical investigation to study the effect of bank ownership concentration on capital adequacy and liquidity on 14 selected private Iranian banks located in city of Tehran, Iran. The study uses a linear regression model where ownership concentration is independent variable, size, leverage, growth domestic product and revenue growth are control variables and liquidity and capital adequacy are dependent variables. Using historical information over the period 2010-2013, the study has determined a negative and meaningful relationship between liquidity and ownership concentration. However, the study has determined a positive and meaningful relationship between capital adequacy and ownership concentration.
Growing Science Ltd. All rights reserved. 5
© 201 Keywords:
Ownership concentration Capital adequacy Liquidity Banking industry
1. Introduction
One of the primary concerns on performance measurement in banking industry is associated with liquidity and the level of liquidity. Chalermchatvichien et al. (2014) investigated the impacts of ownership concentration on the risk-taking behavior in banking industry. The study concentrated on East Asian countries since these nations had successfully applied the Basel standards and they presented a high degree of regulatory convergence over the period 2005-2009. They analyzed the relationship between ownership concentration and capital adequacy (Basel II) and reported that an increase in ownership concentration by one standard deviation results in an improvement in capital adequacy by 7.64 %. They also reported that ownership concentration could have been a substantial determinant of capital stability. While at lower levels of ownership concentration, an increase in concentrated ownership could have reduced capital stability; at higher ownership levels, bigger ownership concentration could have increased capital stability. They also reported that concentrated ownership could improve banks’ liquidity. Gunasekarage et al. (2007) studied the effect of the degree of state ownership and ownership concentration on firm performance based on some the information of firms listed on China's two exchanges over the period 2000-2004. They reported that, on average, the firms’
* Corresponding author.
E-mail address: [email protected] (N. Nourallah Zadeh)
716
performance was negatively associated with the state ownership but such a negative relationship was meaningful only at high levels of government ownership. In addition, they reported that a balanced ownership structure enhances the firm performance and there were indications of detrimental impacts of block ownership. The relationship between ownership structure and corporate performance has been the subject of intense research in both transition and market economies (Claessens & Djankov, 1999).
Baysinger et al. (1991) studied the effects of board and ownership structure on corporate R&D strategy. They investigated the extent to which the percentage of outside directors on a corporation’s board of directors, the concentration of equity ownership, and the roles of individual and institutional stockholders impact on the firm’s R&D strategy. They reported that high insider representation on a board and a concentration of equity among institutional investors positively influenced on corporate R&D spending.
Rubin (2007) investigated the link between the liquidity of a firm's stock and its ownership structure, specifically, how much of the firm's stock is held by insiders and institutions, and how concentrated was their ownership. They reported that the liquidity-ownership relation was mostly driven by institutional ownership rather than insider ownership. In addition, liquidity was positively related to total institutional holdings but negatively related to institutional blockholdings. Bolton and
Thadden (1998) developed a simple model of corporate ownership structure in which advantages and disadvantages of ownership concentration were analyzed. The model compared the liquidity advantages obtained through dispersed corporate ownership with the advantages from efficient management control computed by some degree of ownership concentration. The study re-examined the free-rider problem in corporate control in the presence of liquidity trading, derives predictions for the trade and pricing of blocks, and presented some useful criteria for the optimal choice of ownership structure.
Earle et al. (2005) investigated the effect of ownership concentration on firm performance based on panel data for companies listed on the Budapest Stock Exchange, where ownership seemed to be highly concentrated and frequently involves multiple blocks. Fixed-effects estimates indicated that the size of the largest block increases profitability and efficiency strongly and monotonically, but the effects of total block-holding were much smaller and statistically insignificant. Controlling for the size of the largest block, point estimates of the marginal impacts of additional blocks were negative. The results recommended that the marginal expenses of concentration may outweigh the benefits when the increased concentration involves “too many cooks”.
2. The proposed study
This paper presents an empirical investigation to study the effect of bank ownership concentration on capital adequacy and liquidity on 14 selected private Iranian banks located in city of Tehran, Iran. The study uses a linear regression model where size (SIZE), leverage (Lev), growth domestic product (GDP)
and revenue growth (RG) are control variables, ownership concentration (OC) is independent variable
and liquidity (LR1, LR2) and capital adequacy ratio (CAR) are dependent variables. The proposed study uses the following regression function,
C
AR
it=
β
0+
β
1OC
it+
β
2SIZE
it+
β
3LEV
it+
β
4GDP
it+
β
5RG
it+
ε
it,
(1)OC
RG
1it 0 1 it 2 it 3 it 4 it 5 it it
LR
=
β
+
β
+
β
SIZE
+
β
LEV
+
β
GDP
+
β
+
ε
.
(2)Here, liquidity ratio is calculated either in terms of current ratio (LR1), which is calculated as current
Tier one capital+Tier two capital
Risk weighted assets
CAR
=
.
(3)In this survey, bank size is calculated by taking the natural logarithm on total assets, Leverage (Lev) is measured as the ratio of total liabilities on total equities and finally growth is calculated in terms of relative bank’s growth in two consecutive years. Finally, the official growth domestic product reported by central bank is considered for measuring GDP. Table 1 shows the summary of some basic statistics.
Table 1
The summary of some basic statistics
Variable N Mean Median Std. dev. Skewness Kurtosis Min Max
CAR 51 0.12 0.1 0.06 0.42 -0.57 0 0.25
1
LR 53 0.94 0.93 0.12 0.37 0.54 0.68 1.21
2
LR 50 0.79 0.76 0.14 0.73 0.5 0.55 1.15
OC 52 0.11 0.1 0.07 1.02 0.39 0 0.26
Size 52 18.79 19 1.49 -1.06 0.78 14.74 21.04
Lev 52 14.06 12.7 11.5 2.25 7.29 0.26 59.04
GDP 56 0.51 1.2 5.27 -0.25 -1.57 -6.80 6.5
RG 44 0.26 0.23 0.14 0.69 -0.16 0.01 0.62
As we can observe from the results of Table 1, the mean and median of the figures are close to each other and this specifies the symmetry of the information. Table 2 shows the summary of testing normality of dependent variables using Kolmogorov-Smirnov test (Corder & Foreman, 2014).
Table 2
The summary of testing normality of dependent variables using Kolmogorov-Smirnov
Variable N Statistics Maximum difference Z value
P-Mean Std. Dev. Absolute Positive Negative
CAR 51 0.12 0.06 0.16 0.16 -0.10 1.14 0.151
LR1 53 0.94 0.12 0.11 0.11 -0.08 0.78 0.569
LR2 50 0.79 0.14 0.1 0.1 -0.08 0.69 0.728
The results of Table 2 have indicated that all dependent variables were normally distributed. Next, we investigate the correlation among different independent variables and Table 3 shows the results of our survey. As we can observe from the results of Table 3, there are not strong correlations between any pairs of independent variables.
Table 3
The summary of correlation among different variables
Var. CAR LR1 LR2 OC Size Lev GDP GR
CAR
1
1
LR -0.674**(0.00) 1
2
LR -0.519**(0.00) 0.388**(0.005) 1
OC
0.711**(0.00) -0.669**(0.00) -0.470**(0.001) 1
Size 0.463**(0.001) -0.610**(0.00) -0381**(0.006) 0.585**(0.00) 1
Lev -0329*(0.018) -0.080(0.572) -0.137(0.324) 0.041(0.776) 0.283*(0.042) 1 GDP -0.153(0.284) 0.055(0.693) 0.358*(0.011) 0.02(0.888) -0.233(0.096) 0.023(0.87) 1 GR -0.256(0.098) 0.192(0.213) 0.467**(0.001) -0.321*(0.033) -0.400**(0.007) -0.083(0.593) 0.126(0.414) 1
** Sig. < 0.001 * Sig. < 0.05
3. The results
718
3.1. The relationship between capital adequacy ratio and ownership concentration
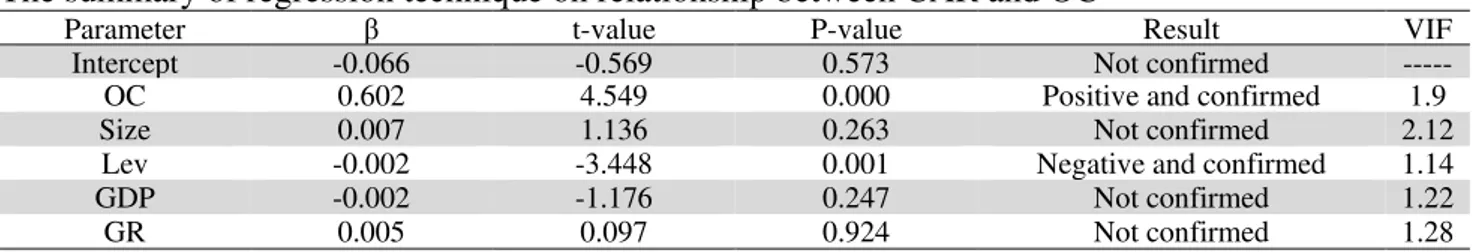
We first present the results of the relationship between capital adequacy ratio and ownership concentration given in Eq. (1). The implementation of Hausman and Limer tests (Gujarati, 2012) have indicated that we should use pool (F-value = 2.069 P-value = 0.060, df=13.24, Chi-Square = 32.327). Table 4 shows the results of regression analysis.
Table 4
The summary of regression technique on relationship between CAR and OC
Parameter β t-value P-value Result VIF
Intercept -0.066 -0.569 0.573 Not confirmed
---OC 0.602 4.549 0.000 Positive and confirmed 1.9
Size 0.007 1.136 0.263 Not confirmed 2.12
Lev -0.002 -3.448 0.001 Negative and confirmed 1.14
GDP -0.002 -1.176 0.247 Not confirmed 1.22
GR 0.005 0.097 0.924 Not confirmed 1.28
F-value = 13.13, P-value = 0.000 R-Square = 0.64, Durbin-Watson = 1.56
As we can observe from the results of Table 4, F-value yields a meaningful value, which means the relationship between independent and dependent variables are linear. In addition, Durbin-Watson value is within the acceptable level and finally, R-Square is equal to 0.64, which means the independent variables could describe approximately 64% of the changes on dependent variable. Moreover, VIF values are all less than 10, which means there is no collinearity among independent variables. The results of t-value associated with OC is equal to 4.549 with Sig. = 0.000, which means there was a positive and meaningful relationship between OC and CAR.
3.2. The relationship between liquidity and ownership concentration
As stated before, in order to examine the relationship between liquidity and ownership concentration, we have used two formula to calculated liquidity, one based on current ratio (LR1) and the other based
on ratio of total amount of loans given to banks’ customers to total money deposited by customers (LR2).
3.2.1. The relationship between LR1 and ownership concentration
The implementation of Hausman and Limer tests have indicated that we should use pool method (F-value = 1.864 P-(F-value = 0.088, df=13.25, Chi-Square = 29.821). Table 5 shows the results of regression analysis.
Table 5
The summary of regression technique on relationship between LR1 and OC
Parameter β t-value P-value Result VIF
Intercept 1.461 6.205 0.000 Confirmed
---OC -0.997 -3.578 0.001 Negative and confirmed 1.95
Size -0.021 -1.549 0.130 Not confirmed 2.16
Lev -0.000007 -0.006 0.996 Not confirmed 1.15
GDP -0.000084 -0.028 0.978 Not confirmed 1.22
GR -0.077 -0.745 0.461 Not confirmed 1.22
F-value = 8.07, P-value = 0.000 R-Square = .0 51, Durbin-Watson = .1 45
variables could describe approximately 51% of the changes on dependent variable. Moreover, VIF values are all less than 10, which means there is no collinearity among independent variables. The results of t-value associated with OC is equal to -3.578 with Sig. = 0.001, which means there was a negative and meaningful relationship between OC and LR1.
3.2.2. The relationship between LR2 and ownership concentration
The implementation of Hausman and Limer tests have indicated that we should use pool method (F-value = 1.186 P-(F-value = 0.344, df=13.25, Chi-Square = 21.132). Table 6 shows the results of regression analysis.
Table 6
The summary of regression technique on relationship between LR2 and OC
Parameter β t-value P-value Result VIF
Intercept 0.586 2.007 0.052 Not Confirmed
---OC -1.046 -3.027 0.004 Negative and confirmed 1.95
Size 0.014 0.861 0.395 Not confirmed 2.16
Lev -0.002 -1.349 0.186 Not confirmed 1.15
GDP 0.009 2.510 0.016 Positive and confirmed 1.22
GR 0.293 2.274 0.029 Positive and confirmed 1.22
F-value = 5.87, P-value = 0.000 R-Square = .0 44, Durbin-Watson = .1 52
As we can see from the results of Table 6, F-value yields a meaningful value, which means the relationship between independent and dependent variables are linear. In addition, Durbin-Watson value is within the acceptable level and finally, R-Square is equal to 0.44, which means the independent variables could describe approximately 44% of the changes on dependent variable. Moreover, VIF values are all less than 10, which means there is no collinearity among independent variables. The results of t-value associated with OC is equal to -3.027 with Sig. = 0.004, which means there was a negative and meaningful relationship between OC and LR2.
4. Conclusion
In this paper, we have presented an empirical investigation to study the relationship between ownership concentration of some private Iranian banks and capital adequacy ratio as well as liquidity. The study has used different regression techniques to examine the relationships and using some historical data over the period 2010-2013. The study has determined a negative and meaningful relationship between liquidity and ownership concentration. However, the study has determined a positive and meaningful relationship between capital adequacy and ownership concentration. The findings of this survey are consistent with existing results in the literature (Claessens & Djankov, 1999; Rubin, 2007).
Acknowledgement
The authors would like to thank the anonymous referees for constructive comments on earlier version of this paper.
References
Baysinger, B. D., Kosnik, R. D., & Turk, T. A. (1991). Effects of board and ownership structure on corporate R&D strategy. Academy of Management journal, 34(1), 205-214.
Bolton, P., & Thadden, V. (1998). Blocks, liquidity, and corporate control. The Journal of
720
Claessens, S., & Djankov, S. (1999). Ownership concentration and corporate performance in the Czech Republic. Journal of comparative economics, 27(3), 498-513.
Chalermchatvichien, P., Jumreornvong, S., Jiraporn, P., & Singh, M. (2014). The effect of bank ownership concentration on capital adequacy, liquidity, and capital stability. Journal of Financial
Services Research, 45(2), 219-240.
Corder, G. W., & Foreman, D. I. (2014). Nonparametric Statistics: A Step-by-Step Approach. Wiley.
Earle, J. S., Kucsera, C., & Telegdy, Á. (2005). Ownership concentration and corporate performance on the Budapest Stock Exchange: do too many cooks spoil the goulash?. Corporate Governance:
An International Review, 13(2), 254-264.
Gujarati, D. N. (2012). Basic econometrics. Tata McGraw-Hill Education.
Gunasekarage, A., Hess, K., & Hu, A. J. (2007). The influence of the degree of state ownership and the ownership concentration on the performance of listed Chinese companies. Research in International
Business and Finance, 21(3), 379-395.
Rubin, A. (2007). Ownership level, ownership concentration and liquidity. Journal of financial