Article
*e-mail: [email protected]
Determination of Protonation Constants of Some Tetracycline Antibiotics by Potentiometry
and LC Methods in Water and Acetonitrile-Water Binary Mixtures
Senem Şanli,a Nurullah Şanli*,a and Güleren Alsancakb
aDepartment of Chemistry, Faculty of Science & Arts, Hitit University, 19040, Çorum, Turkey
bDepartment of Chemistry, Faculty of Science & Arts, Süleyman Demirel University, 32260, Isparta, Turkey
Uma estimativa acurada das constantes de dissociação de antibióticos tetraciclina em misturas binárias acetonitrila-água é muito importante para muitas técnicas de separação, como cromatografia líquida e eletroforese capilar que usam essas misturas de solvente. Neste estudo, os valores de pKa de cinco tetraciclinas (tetraciclina, oxitetraciclina, clorotetraciclina, doxiciclina e metaciclina) foram determinados em água e em misturas binárias (10%, 20% e 30% (v/v)), através de potenciometria e cromatografia líquida. Os resultados obtidos mostram uma tendência similar para os valores de pKa1dos cinco antibióticos tetraciclina, os quais aumentam com o aumento da concentração dos modificadores orgânicos, resultando numa relação linear entre os valores de pKa1 e a fração molar de acetonitrila. Os valores obtidos para pKa em meio aquoso foram comparados com os valores preditos pelo programa SPARC.
An accurate estimation of dissociation constants of tetracycline antibiotics in acetonitrile-water binary mixtures is very important for several separation techniques such as liquid chromatography and capillary electrophoresis that use these solvent mixtures. In this study, the pKa values of five tetracyclines (tetracycline, oxytetracycline, chlortetracycline, doxycycline and metacycline), have been determined in water and acetonitrile-water binary mixtures (10%, 20% and 30% (v/v)) by potentiometry and liquid chromatography (LC). The obtained results show a similar trend for the pKa1 values of five tetracycline antibiotics as they increase with increasing concentration of organic modifier, which allows a linear relationship between pKa1 values and mole fraction of acetonitrile to be obtained. The pKa values obtained in aqueous medium have been compared with the values predicted by the SPARC on-line pKa calculator.
Keywords: tetracyclines, dissociation constants, potentiometric titration, LC
Introduction
The dissociation constant (pKa) of a drug molecule is a key parameter in absorption, distribution, metabolism, excretion and toxicity researches because it governs solubility, absorption, distribution, and elimination of substances. Also, the pKa values constitute important data for thorough understanding of certain chemical phenomena such as biological uptake, and the binding of these molecules to environmental matrices and forming chelates with metallic cations. The drugs’ pKa data are applied to estimate the major species of pharmaceuticals present in the environment (usually in neutral pH range) and dosage-form development. Particularly, these obtained pKa values can be used for the development of separation methods
of tetracyclines on various separation techniques such as liquid chromatography (LC) and capillary electrophoresis (CE).1,2
programs for the determination of dissociation constants. Moreover, the use of computer programs for the refinement of dissociation constants allows the different pKa values in polyprotic substances to be determined, even when they are very close.19,20
In the last decade, a new procedure has been developed when LC and CE methodologies are used for determination of ionization constants in combination with a diode array detector (DAD) for absorbance measurements.11,21,22
Traditionally, water has been considered the solvent which best represents the biological conditions. However, hydro-organic mixtures such as acetonitrile-water (MeCN-water), have been found suitable because they show simultaneously a low polar character and a partially aqueous content, as do all biological systems. MeCN can dissolve a wide majority of organic acids more effectively than water and in many cases it is a more suitable solvent for the determination of the dissociation constants. MeCN behaves as a weaker base and as a much weaker acid than water. It has a relatively high dielectric constant (ε = 36) and a small autoprotolysis constant (pKs = 33.6). Accordingly, MeCN acts as a strongly differentiating solvent with a modest solvating power for many polar ionic solutes.23
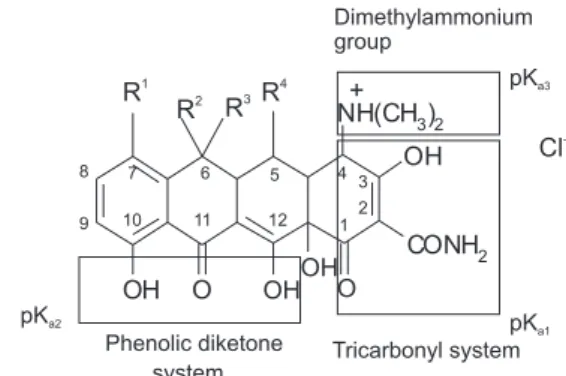
Tetracycline antibiotics (TCs) are broad-spectrum medicinal drug compounds active against a number of gram-positive and gram-negative bacteria. TCs have been successfully used worldwide in both veterinary and human medicine. These antibiotics are widely used as veterinary drugs for food-producing animals because of their broad-spectrum activity and cost effectiveness.3,24 The commonly used TCs in medicine are tetracycline (TC), oxytetracycline (OTC), chlortetracycline (CTC), doxycycline (DC) and metacycline (MTC). TCs consist of 4 fused rings with substitutions on positions 5, 6 and 7. As we can deduce in Figure 1, the structure of TCs are very similar. They are amphoteric compounds with characteristic pH values and form crystalline hydrates and salts with acids and bases. The general formula contains three distinct acid groups-the tricarbonyl-methane, groups-the ammonium cation and groups-the phenolic diketone group. The protonation sites of TCs are shown in Figure 2.
The pKa values of TCs are either not known accurately or not available at all. Only a limited number of studies related with pK values of studied TCs are found in the literature. However, some data in literature differ considerably, number of pKa values and the methods used for their determination are not adequately described (temperature, ionic strength, solvent media, etc.).2,3,24-27 In order to overcome the lack of information related with the acid-base equilibria of this kind of compounds
in MeCN-water binary mixtures, the pKa values of five TCs (tetracycline, oxytetracycline, chlortetracycline, doxycycline and metacycline) in water and MeCN-water binary mixtures have been determined by means of potentiometric and chromatographic (LC and LC-DAD) measurements. The potentiometric determinations were carried out in water, 10%, and 20% (v/v) MeCN content, whereas the chromatographic determinations of pKa values were at 10%, 20%, and 30% (v/v) MeCN content. The pKa values obtained will be useful for the development and optimization of separation methods of TCs based on liquid chromatography in MeCN-water mixtures. The results obtained for pKa in water have been compared with those predicted by SPARC on-line calculator.28,29 This program estimates several physico-chemical properties of organic compounds on the basis of their molecular structure.
Experimental
Chemicals and reagents
TC, OTC, CTC, DC and MTC were purchased from Sigma and were used without further purification. Water, with conductivity ≥ 0.05 µS cm-1 was obtained with a Milli Figure 1. Molecular structures of studied compounds.
Q water purification system (Milli Pore Corp.) and used to all solutions. MeCN was of HPLC grade and used as the organic component of the mobile phase. Potassium hydrogen phtalate was dried at 110 oC before use (Fluka). The pH values of the mobile phases were measured against a 0.05 mol kg-1 potassium hydrogen phtalate solution as primary reference standard solution, dissolved in the appropriate MeCN-water medium. This standard has been selected because their pH values at different MeCN percentages (up to 70% (v/v)) are already known.30 The use of organic solvent-water mixtures requires the correct measurements of pH in these media. Measurements are performed in a similar way to those performed in water using IUPAC standardization rules.31,32 Stock 0.025 mol L-1 carbonate-free potassium hydroxide solutions were prepared in each MeCN-water mixture from 1 mol L-1 potassium hydroxide solution (Titrisol, Merck) by dilution. Hydrochloric acid solutions were prepared by dilution from 1 mol L-1 hydrochloric acid (Titrisol, Merck) in each MeCN-water mixture. The ionic strength of all working solutions was adjusted at 0.1 mol L-1 with potassium chloride (Merck).
The alkali titre and absence of carbonate were periodically checked by pH-metry, using the appropriate Gran function33 against primary standard oven-dried potassium hydrogen phthalate. Acid solutions prepared from hydrochloric acid were titrated against standardized potassium hydroxide.34
Stock standard solutions of TCs were freshly prepared in water at concentrations of approximately 200 mg L-1 and stored in amber bottles in a refrigerator (4 oC). Working solutions were diluted with the corresponding mobile phase to 10 mg L-1. These solutions were passed through a 0.45 µm nylon filter membrane (MSI) before injections. The hold-up time, tm,was measured for every mobile phase composition by injection of 0.01% (m/v) potassium bromide solution. The retention factors, k, for all the compounds at each mobile phase assayed were determined from three different injections of the TCs.
Apparatus
In order to obtain the pKa values using potentiometric technique, potential values of the potentiometric cell were measured with a Model Mettler-Toledo MA 235 pH/ion analyser with combined glass electrode system (± 0.1 mV). The cell was thermostated externally at 25 oC ± 0.1 with a cooler system water bath (HETO CBN 8-30 and temperature control unit HETO HMT 200) and the test solution was stirred magnetically under a continuous stream of purified nitrogen. Triplicate titrations were carried out in the double-wall Pyrex titration cell of 80 mL capacity.
A chromatographic system consisted of Shimadzu Model LC 10 ADVP pump with an auto injector (SIL 10 AD VP) and diode array detector system (SPDM 10 A DAD) was used for studies. This equipment has column oven (CTO 10 AVP) and degasser system (DGU 14 A). Phenomenex Luna RP C-18 column (250 mm × 4.6 mm i.d., 5 µm) was used as stationary phase. Flow rate was 0.8 mL min-1 and the column temperature was 25 oC. The compounds were injected using isocratic system and 20 µL volume was injected. The effluent was monitored at 271 nm.
Procedures
Potentiometric procedure
The glass electrode was stored in water when not in use and soaked for 20-25 min in MeCN-water mixture before potentiometric measurements. The stabilization criterion for the potential readings was 0.2 mV within 120 s. In all instances, the electrode system gave stable and reproducible potentials within 3 min. The standardization of the electrode system was carried out, each time in MeCN-water mixtures (background solution) studied by Gran’s method.33 For this purpose, the electrode was immersed in these mixtures (20 mL and 0.1 mol L-1 ionic strength). Usually, 10 or 12 additions of hydrochloric acid were enough for E0 to be accurately determined. The potential was allowed to stabilize after each addition of acid and the potential values obtained were used to calculate the standard potential of the cell, E0.
The pKa values of TCs were determined by titration of the appropriate solutions of these compounds (2.74 × 10⁻³ mol L-1 for tetracycline) in water, 10% (v/v), and 20% (v/v) MeCN-water, using KOH solution as titrant, in 0.1 mol L-1 ionic strength (KCl). Carbon dioxide dissolved in titrate solution was purged out by nitrogen gas. The TCs solution was completely mixed with a magnetic stirrer. Titration was carried out in triplicate at constant temperature (25 ± 0.1 oC) to ensure reproducibility. Drop wise addition of KOH solution (100 µL) was performed by calibrated Biohit-Proline pipetters (Biohit Corp. Finland) and the titrations were continued up to pH 12.
Chromatographic method
used as reference standard value (RSV) for calibration of pH/ion analyzer. pH measurement of the mobile phases were performed in triplicate to ensure stability and reproducibility of the potentiometric system.
For each TCs and for every mobile phase composition and pH considered, the retention time values, tRi, were determined from three different injections. Retention factors (ki) were calculated from equation 1:
ki = (tRi - tm) / tm (1)
where tm indicates the retention time of the potassium bromide (hold-up time), which was measured by injection of 0.01% potassium bromide solution in water for each mobile phase composition and pH studied. The pKa values associated with tricarbonyl system were determined by using the NLREG program.35
Liquid chromatography-diode array detection
A novel method based on the absorbance spectra at the maximum of chromatographic peak, obtained with DAD has been applied to calculate the pKa values. This method allows comparing the values of dissociation constants obtained from chromatographic retention of tetracyclines at different pH values and those obtained from absorbance spectra at the maximum of the chromatographic peak. It is possible to constitute a valuable means of obtaining better precision. Absorbance spectra were recorded between 190 and 300 nm and then processed by modified STAR (Stability Constants by Absorbance Readings) program.11,21,36
SPARC calculations
The SPARC program uses algorithms based on fundamental chemical structure theory that combines principles of quantitative structure activity relationships (QSAR), linear free-energy relationships (LFER) and perturbation theory from quantum chemistry.28,29 This program estimates the macroscopic and microscopic pKa of any organic compound solely from its chemical structure. Macroscopic pKa1, pKa2 and pKa3 values of studied compounds were calculated by this program. SPARC is available free of charge on the internet.
Results and Discussion
The obtained pKa values of tetracyclines by different methodologies, together with literature data and the values predicted by SPARC are given in Table 1. The first dissociation constant pK1, is generally attributed to tricarbonyl system and nearly between 3.0-3.5 in water. The second dissociation constant pK2 is due to the phenolic
diketone system being about 7 and the third dissociation constant pK3assigned to the protonated dimethylamino group (about 9).
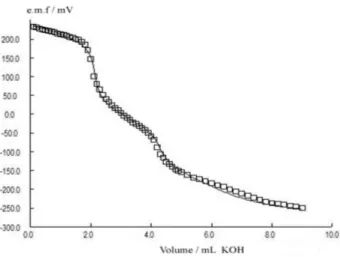
Potentiometric pKa values were determined from several series of independent measurements. One series of measurements for one titration of TC in water using KOH solution as titrant is shown in Figure 3. Two steps were clearly observed in the potentiometric curve, the first relating to the tricarbonyl system, the second to the ionization of phenolic diketone system. The third step was not clearly seen as expected and it is related to the dimethylammonium group. From the potentiometric data, the equilibrium constant for TC gave a value for pKa1, pKa2 and pKa3 of 3.35 ± 0.03, 7.29 ± 0.03 and 9.88 ± 0.03, respectively. The data obtained for TCs from the literature data are in good agreement. The calculation of pKa values requires an iterative cycle for each point of the potentiometric titration at which electromotive force (e.m.f.) was measured and were carried out by using the program PKPOT.20 This program allows the thermodynamic acid-base constants in aqueous and non-aqueous media to be determined, taking into account the activity coefficient of the species and by this program we could determine pKa1, pKa2 and pKa3 values of tetracyclines. This program refines the thermodynamic equilibrium constants in order to minimize the sum of squared differences (Uemf) between the experimental electromotive force (e.m.f.) values and those calculated on the basis of the mass balances for hydrogen and tetracycline, the equilibrium constants, the cell standard potential and the activity coefficients:
(2)
where m is the number of titrations and nthe number of experimental points in each titration.
For LC technique, data pairs of pH and retention factors and the ionic strength over pH range of 2.5-4.5 were used. The k values were determined from three separate injections at every mobile phase composition at each pH considered. Relative Standard deviations were lower than 2%. CTC, DC and MTC could not be eluted from column in 10% (v/v) MeCN-water mixture. Plots of the retention factor (k) values versus pH of the mobile phases are presented in Figure 4 for tetracyclines in 30% (v/v) MeCN.
sigmoid Y = bottom + (top-bottom) / [1 + exp(V50 - X) / slope]), using a non-linear least square program (Origin 7.0). Computer generated plots of k versus pH were obtained and the pH value at the inflection point (V50) was taken as valuable index of pKa1 (Table 1).
The pKa values were calculated using a non-linear least-square fit of the data using the program NLREG35 and are shown in Table 1. This is a general purpose program, where the function to be minimized and the parameters to be estimated can be defined by means of the built-in program
Table 1. Dissociation constants of tetracyclines obtained from the literature, SPARC program, potentiometric and LC methods in water, 10%, 20% and 30% (v/v) MeCN-water binary mixtures
Compounds SPARC Lit. Potentiometry LC LC-DAD
Water 10% (v/v) 20% (v/v) 10% (v/v) 20% (v/v) 30% (v/v) 10% (v/v) 20% (v/v) 30% (v/v)
TC pKa1 pKa2 pKa3 3.01 5.79 8.55 3.32(0.30)a 7.78(0.05)a 9.58(0.30)a 3.30b 7.70b 9.50b 3.36(0.04)c 7.77(0.02)c 9.27(0.02)c 3.35(0.03)* 7.29(0.03) 9.88(0.03) 3.47(0.02) 7.24(0.03) 10.00(0.09) 3.62 (0.07) 7.28 (0.07) 10.25 (0.08) 3.77(0.23) ---3.98(0.09) ---4.15(0.21) ---3.09(0.05) ---3.69(0.02) ---4.00(0.03) ---CTC pKa1 pKa2 pKa3 3.95 5.59 7.94 3.33(0.30)a 7.55(0.02)a 9.33(0.30)a 3.30b 7.40b 9.30b 3.25(0.02) 6.72(0.02) 8.84(0.06) 3.30(0.05) 6.74(0.01) 9.19(0.05) 3.34(0.04) 6.67(0.01) 9.33 (0.05) ---3.89(0.28) ---4.07(0.32) ---3.71(0.03) ---3.90(0.01) ---OTC pKa1 pKa2 pKa3 3.79 5.51 8.46 3.22(0.30)a 7.46(0.03)a 8.94(0.30)a 3.30b 7.30b 9.10b 3.53(0.01) 7.25(0.03) 9.58(0.07) 3.62(0.03) 7.19(0.02) 9.73(0.06) 3.71(0.04) 7.20(0.04) 9.83 (0.05) 3.53 (0.06) ---3.99(0.01) ---4.15(0.30) ---3.36(0.04) ---3.46(0.02) ---3.90(0.03) ---DC pKa1 pKa2 pKa3 3.58 5.74 9.67 3.02(0.30)a 7.97(0.15)a 9.15(0.07)a 3.50(0.04) 7.07(0.06) 9.13(0.09) 3.62(0.08) 7.20(0.05) 9.10(0.05) 3.71 (0.08) 7.43 (0.05) 9.38(0.02) ---4.05(0.01) ---4.08(0.14) ---3.57(0.04) ---3.82(0.02) ---MTC pKa1 pKa2 pKa3 3.55 5.68 9.53 ---3.80(0.09) ---4.04(0.18) ---3.43(0.04) ---3.92(0.02) ---*Parenthesis are standard deviations; apK
a values are obtained in water from Reference 3 by potentiometric method. bpK
a values are obtained in water from
Reference 26 by multiwavelength spectrophotometry. cpK
a values are obtained in water from Reference 24 by potentiometric method.
Figure 3. Plot of potentiometric titration of 2.74 × 10⁻³ mol L-1 tetracycline
(TC) in water with 0.025 mol L-1 KOH.Solid lines indicate the theoretical
values calculated by PKPOT program.
editor. In our case, the input data include the experimental retention factors (kexp), the measured pH and the calculated activity coefficients, whereas the dissociation constants and the retention factors of the neutral and anionic species are treated as parameters to be optimized. Starting values for these parameters must also be included. The ionic strength was determined from the amount of sodium hydroxide added to obtain the desired pH of the mobile phase, and from the dissociation constant of the buffer in the more acidic solutions (corresponding to formic acid buffers).
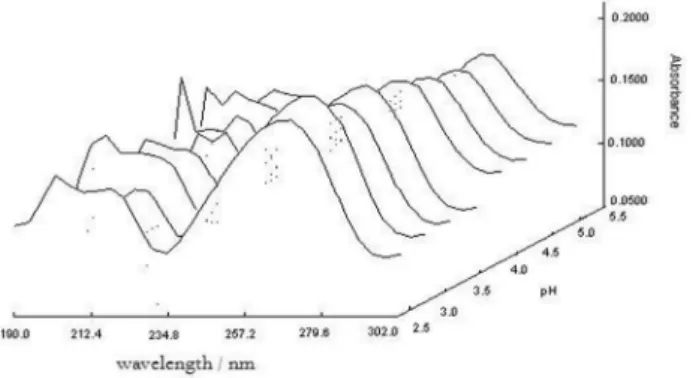
The LC-DAD technique does not use retention factors; instead of them it uses the spectra measured by the diode-array detector, but the procedure will be affected by the errors in the pH measurement. The comparison between pKa values obtained from retention and absorbance allows a better understanding of dissociation equilibria to be reached, with the additional advantage that both kinds of data can be obtained in the same experimental run. The spectral data obtained from STAR program corresponding to the pKa determination of doxycycline in 30% (v/v) MeCN are presented in Figure 5.
The program refines the equilibrium constants, using the Gauss-Newton algorithm, until a minimum value in the sum of the squared differences between the experimental and calculated absorbance values for each spectra and wavelength (Uabs) is obtained:
(3)
where ns and nw indicate the number of spectra and wavelengths, respectively. Ai,j,exp and Ai,j,calc are the experimental and calculated absorbance values for the wavelength j in the spectrum i. The calculated absorbances are obtained in three steps: the program first solves the mass balances for each spectrum according to the guessed equilibrium constants and experimental conditions; then, a multiple linear regression procedure is applied in order
to determine the molar absorbances of each unknown species, and finally the individual absorbance values are re-calculated from the guessed species concentration and the corresponding molar absorbances.
Among these techniques, the potentiometric method is a high precision technique to determine pKa values of substances. It is commonly used due to its accuracy and the commercial availability of fast, automated instruments. However, its shortcomings include the requirements to use a milligram of pure compounds and a mixture of aqueous buffers. It needs a minimum solubility of the compound studied (about 10-3 mol L-1). This is due to the fact that the electrode system is calibrated before each potentiometric titration,33 and the pH electrode remains into the solution during all the titration. Because of that the calibration parameters are the same for all titration data corresponding to the same experimental run. To avoid errors, especially for measurements at neutral-to-high pH, carbonate-free solutions must be prepared laboriously.
LC is used as a powerful technique for the determination of dissociation constants, as it requires only a small quantity of compounds, studied samples do not need to be pure and poor water solubility is not a serious drawback. This method does not include measuring solute or titrant concentrations, just retention times. Also, calculation is straightforward and independent of solute purity. However, the standard deviations of pKa values are higher than those obtained by potentiometric and LC-DAD methods. One of the most important disadvantages of the LC method is that the pH of the mobile phase and, therefore, the range of pKa values that can be determined are limited by the stability of the column package. Moreover, due to the large retention times observed, it is not easy to determine pKa values in water and aqueous-organic mixtures with low contents of aqueous-organic solvent. Nevertheless, as the main objective of pKa determination by LC is the optimization of chromatographic separations, this method is perfectly adequate for this purpose.
In recent years, a new procedure has been developed when LC and CE methodologies are used for pKa determination in combination with a diode-array detector (DAD) for absorbance measurements. In these cases, pKa values can be determined from the absorbance spectra obtained at the maxima of chromatographic or electrophoretic peaks. The advantages of these proposed methods lie in the fact that the application of both methods does not increase the analysis time and enables the confirmation of results.
By comparison in LC methodology, the pH of the mobile phase is measured against the pH of a standard; the drawback of this procedure is the possibility of small changes in the electrode response every time it is immersed in a different solution. Moreover, small errors in the
preparation of the standard will be noted as systematic deviations. Additionally, the retention factors (k) used to estimate the pKa are derived from the retention time of the solute and the hold-up time, giving lower precision.
A further comparison between the pKa values obtained in this work in aqueous medium and those given in the literature and predicted by SPARC shows that the values corresponding to the first pKa are generally in good agreement. The remarkably good results obtained by SPARC should be mentioned, because, except in the case of CTC, predicted values for tricarbonyl system (pKa1) are within 0.3 pKa units from real experimental values. Results are not so good for the dissociation constants of the phenolic diketone system (pKa2), as the differences between the results obtained in this work and predicted by SPARC are higher but those available in the literature are similar, particularly for pKa3, in which case they may exceed 0.5 pKa unit.
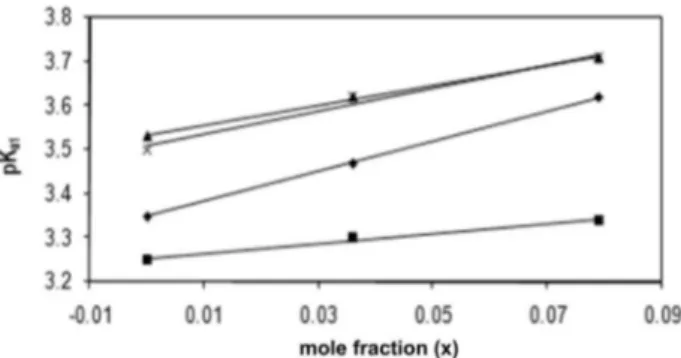
The relationships between pKa1 values obtained and mole fractions are shown in Figure 6. The equations between pKa1 values and mole fraction, of organic modifier are shown in Table 2.
The values obtained in this work by potentiometry, LC and LC-DAD for the first pKa are in good agreement, but LC values are a bit higher from the others. Table 2 shows that the variation of potentiometric pK1 values of TCs are increased linearly when the content of MeCN is increased.
pK2 values are nearly constant and for most cases pK3 values are increased by the increasing of the organic modifier. The change of pKa values of TCs in MeCN-water mixtures could be explained by the fact that preferential solvation by water exists in MeCN-water mixtures.37 Although the variations of the physico-chemical properties of solutes in mixed solvents can be described by the Kamlet-Taft solvatochromic parameters38 or the Dimroth-Reichardt ET polarity parameter,39 it has been found that in several water-organic co-solvent mixtures, such as acetonitrile-water30 (up to 70% acetonitrile), pKa values of a given substance show a linear relationship with the mole fraction of organic co-solvent. This is indicated by the following expression:
pKa,φ = pKa,w + φΔpK (4)
where pKa,w indicates the dissociation constant in water, φ the mole fraction of organic cosolvent, ΔpK the slope of the linear relationship, and pKa,φ the pKa at the corresponding composition.
Conclusions
This paper presents the first study dealing with the determination of pKa values of TCs by potentiometry and LC methods in MeCN-water binary mixtures and gives a possibility for deeper analysis of the processes which take place during LC analysis of TCs. The chromatographically determined pKa values are the most appropriate for predicting the effect of eluent pH on retention and hence for optimization of separation methods based on especially reversed phase liquid chromatography. Also, the important data extracted from this exploration can be used for other pharmacokinetic, pharmacological or technological studies concerning these compounds.
Acknowledgment
We gratefully acknowledge to Dr. Jose Luis Beltran from University of Barcelona for supporting the program STAR, NLREG and PKPOT.
References
1. Poole, C. F.; Poole, S. K.; Chromatography Today, Elsevier: Amsterdam, 1991.
2. Babić, S.; Horvat, A. J. M.; Pavlović, D. M.; Kaštelan-Macan,
M.; TrAC, Trends Anal. Chem.2007, 26, 1043.
3. Qiang, Z.; Adams, C.; Water Res. 2004, 38, 2874.
4. Fallavena, P. R. B.; Schapoval, E. E. S.; Int. J. Pharm.1997,
158, 109.
Figure 6. pK1 values of TCs versus mole fractions of MeCN. Symbols: : tetracycline, : chlortetracycline, : doxycycline : oxytetracycline.
Table 2. The equations between pKa1 values and mole fractions of organic modifier
Compounds Equation Regression
coefficient TC pKa1 = 3.42 (0.04) x* + 3.35 (0.01) R = 0.999
CTC pKa1 = 1.13 (0.13) x + 3.25 (0.01) R = 0.993
OTC pKa1 = 2.27 (0.12) x + 3.53 (0.01) R = 0.999
5. Martínez, V.; Maguregui, M. I.; Jiménez, R. M.; Alonso, R. M.;
J. Pharm. Biomed. Anal. 2000,23, 459.
6. Wróbel, R.; Chmurzynski, L.; Anal. Chim. Acta 2000,405, 303.
7. Ràfols, C.; Rosés, M.; Bosch, E.; Anal. Chim. Acta1997,338, 127.
8. Polster, J.; Lachmann, H.; Spectrometric Titrations: Analysis
of Chemical Equilibria, VCH Publishers: Weinheim, 1989.
9. Allen, R. I.; Box, K. J.; Comer, J. E. A.; Peake, C.; Tam, K. Y.;
J. Pharm. Biomed. Anal. 1998,17, 699.
10. Barbosa, J.; Barrón, D.; Jiménez-Lozano, E.; Sanz-Nebot, V.;
Anal. Chim. Acta2001, 437, 309.
11. Beltrán, J. L.; Şanlı, N.; Fonrodona, G.; Baron, D; Özkan, G; Barbosa, J.; Anal. Chim. Acta 2003,484, 253.
12. Janos, P.; J. Chromatogr., A 2004,1037, 15.
13. Andrasi, M.; Buglyo, P.; Zekany, L.; Gaspar, A.; J. Pharm.
Biomed. Anal. 2007,44, 1040.
14. Foulon, C.; Duhal, N.; Lacroix-Callens, B.; Vaccher, C.; Bonte, J. P.; Goossens, J. F.; Eur. J. Pharm. Sci.2007, 31, 165. 15. Nogales, V.; Ruiz, V.; Rosés, M.; Ràfols, C.; Bosch, E.;
J. Chromatogr., A2006, 1123, 113.
16. Jiménez-Lozano, E.; Marqués, I.; Barrón, D.; Beltrán, J. L.; Barbosa, J.; Anal. Chim. Acta2002, 464, 37.
17. Martell, A. E.; Motekaitis, R. J.; Determination and Use
of Stability Constants, 2nd ed., VCH Publishers: New York,
1992.
18. Gans, P.; Sabatini, A.; Vacca, A.; Talanta 1996,43, 1739. 19. Erdemgil, F. Z.; Şanlı, S.; Şanlı, N.; Özkan, G.; Barbosa, J.;
Guiteras, J.; Beltrán, J. L.; Talanta2007, 72, 489.
20. Barbosa, J.; Barrón, D.; Beltrán, J. L.; Sanz-Nebot, V.; Anal.
Chim. Acta1995, 317, 75.
21. Pérez-Urquiza, M.; Beltrán, J. L.; J. Chromatogr., A2001, 917, 331.
22. Jiménez-Lozano, E.; Marqués, I.; Barrón, D; Beltrán, J. L.; Barbosa, J.; Anal. Chim. Acta2002, 464, 37.
23. Aktaş, A. H.; Şanlı, N.; Pekcan, G.; Acta Chim. Slov. 2006, 53, 214.
24. Hosny, W. M.; El-Medani, S. M.; Shoukry, M. M.; Talanta 1999,
48, 913.
25. Agrawal, Y. K.; Patel, D. R.; J. Pharm. Sci.1986, 75, 190. 26. Pinsuwan, S.; Alvarez-Núñez, A. F.; Tabibi, E. S.; Yalkowsky,
S. H.; J. Pharm. Sci.1999,181, 31.
27. Evagelou, V.; Tsantili-Kakoulidou, A.; Koupparis, M.; J. Pharm.
Biomed. Anal.2003,31, 1119.
28. http://ibmlc2.chem.uga.edu/sparc/, accessed in May 2008. 29. Hilal, S. H.; Karicckhoff , S. W.; Carreira, L. A.; QSAR Comb.
Sci.2004,23, 709.
30. Barbosa, J.; Beltrán, J. L.; Sanz-Nebot, V.; Anal. Chim. Acta
1994, 288, 271.
31. Rondinini, S.; Mussini, P. R.; Mussini, T.; Pure Appl. Chem.
1987, 59, 1549.
32. Mussini, P. R.; Mussini, T.; Rondinini, S.; Pure Appl. Chem.
1997, 69, 1007.
33. Gran, G.; Analyst 1952, 77, 661.
34. Serjeant, E. P. In Potentiometry and Potentiometric Titrations
ina Series of Monographs on Analytical Chemistry and Its
Applications; Elving, P. J.; Winefordner J. D., eds.; John Wiley
& Sons, Inc.: New York, 1984, vol. 69, ch. 5. 35. http://www.nlreg.com, accessed in May 2008.
36. Beltrán, J. L.; Codony, R.; Prat, M. D.; Anal. Chim. Acta1993,
276, 441.
37. Barbosa, J.; Barron, D.; Berges, R.; Sanz-Nebot, V.; Toro, I.;
J. Chem. Soc., Faraday Trans. 1997, 93, 1915.
38. Kamlet, M. J.; Abboud, J. L. M.; Taft, R. W.; Prog. Phys. Org.
Chem. 1981, 13, 485.
39. Reichardt, C.; Solvents and Solvent Effects in Organic Chemistry, 2nd ed.,454 VCH Verlagsgesellschaft: Weinheim, 1988.