Article
0103 - 5053 $6.00+0.00
*e-mail: [email protected]
Application of H-Point Standard Addition Method for Simultaneous Spectrophotometric
Determination of Hydrochlorothiazide and Propranolol
Reza Hajian,*,a Nafiseh Shamsb and Ardeshir Rada
aCollege of Science, Chemistry Department, Islamic Azad University Branch of Gachsaran, 75818-63876 Gachsaran, Iran
bDepartment of Chemistry, Najafabad Institute of Higher Education, 85166-74371 Najafabad, Iran
A aplicação do método de adição padrão no ponto H para solucionar os espectros sobrepostos de hidroclorotiazida e propranolol foi avaliado. Os resultados mostram que o método HPSAM pode ser aplicado para a determinação simultânea dos compostos, em meio aquoso. Os resultados da aplicação do HPSAM mostraram que as duas drogas podem ser determinadas simultaneamente, numa razão de concentração hidroclorotiazida:propranolol variando entre 1:20 e 10:1 numa amostra sintética. O método foi aplicado com sucesso na determinação da hidroclorotiazida na presença de propranolol em algumas amostras sintéticas. Ainda, a aplicabilidade do método foi demonstrada pela determinação de ambos em alguns fluídos biológicos.
The applicability of H-point standard addition method (HPSAM) to resolving overlapping spectra corresponding to the hydrochlorothiazide and propranolol was verified. The results show that the HPSAM is suitable for the simultaneous determination of hydrochlorothiazide and propranolol in aqueous media. The results of applying the HPSAM showed that the two drugs could be determined simultaneously with the concentration ratios hydrochlorothiazide:propranolol varying from 1:20 to 10:1 in a mixed sample. The proposed method has been successfully applied to the simultaneous determination of hydrochlorothiazide in the presence of propranolol in some synthetic samples. Moreover, the applicability of the method was demonstrated by their determination in some biological fluids.
Keywords: hydrochlorothiazide, propranolol, spectrophotometry, H-point standard addition method, HPSAM
Introduction
Diuretics are an important group of the drugs used in various clinical situations such as cardiac and renal insufficiency, nefrotic syndrome, edema, cirrhosis and
hypertension.1
Hydrochlorothiazide is a benzothiadiazine (Scheme 1)
diuretic closely related to chlorothiazide.2 The mechanism
of the antihypertensive effect of the thiazides is unknown. Thiazides do not affect normal blood pressure. Thiazides affect the renal tubular mechanism of electrolyte reabsorption. At maximal therapeutic dosage, all thiazides are approximately equal in their diuretic potency. Thiazides increase excretion of sodium and chloride in approximately equivalent amounts. Natriuresis causes a secondary loss of potassium and bicarbonate. Onset of diuretic action of hydrochlorothiazide occurs in two hours
and the peak effect in about four hours. Its action persists for approximately 6 to 12 h. Thiazides are eliminated rapidly by the kidney.
Propranolol (Scheme 2) is a synthetic β-adrenergic
receptor-blocking agent chemically described as 2-propanol-1-[(1-methylethyl) amino]-3-(1-naphthalenyloxy).
Propranolol is a nonselective β-adrenergic receptor
blocking agent possessing no other autonomic nervous
system activity.3 It specifically competes with β-adrenergic
receptor stimulating agents for available receptor sites.
When access to β-receptor sites is blocked by propranolol,
the chronotropic, inotropic, and vasodilator responses to
β-adrenergic stimulation are decreased proportionately.
Synergism effect between hydrochlorothiazide and
propranololin patients is indicated in the management of
hypertension.4,5 This fixed combination is not indicated
for initial therapy of hypertension. Hypertension requires therapy dosage rationalized to the individual patient. If the fixed combination represents the dosage determined, its use may be more convenient in patient management. Being widely used drugs, several methods have been reported for their determination in pharmaceutical formulations.
Hydrochlorothiazide has been determined by liquid
chromatography/tandem mass spectrometry,6,7 High
performance liquid chromatography, HPLC, and time
resolved chemiluminescence.8,9
In the case of propranolol, several methods have been proposed for determination of propranolol using
atomic absorption spectrometric,10spectrofluorimetry,11
conductometric titration and chromatography.12-16
To our knowledge, there is not a proposed method for simultaneous determination of hydrochlorothiazide and propranolol in pharmaceutical dosage forms and biological fluids. Since UV-Visible spectrophotometry is a rapid, sensitive and inexpensive analytical tool, it is appropriate for dosage control of pharmaceutical preparations. However, the lack of specificity of the UV-Visible absorption usually hinders the application of this technique in case of absorbing species mismatch, due to spectral overlap.
In the present work a very simple, sensitive, selective and low cost procedure for simultaneous spectrophotometric determination of hydrochlorothiazide and propranolol using H-point standard addition method (HPSAM) is described. The method consists in the determination of the absorbance of two species in an appropriate wavelength pair.
Experimental
Chemicals
All the chemicals were of analytical grade and were purchased from Merck (Darmstadt, Germany) unless stated
otherwise. Doubly distilled water was used throughout. Hydrochlorothiazide and propranolol were purchased from Darou Pakhsh and Pharma Chemie Medical companies (Tehran, Iran), respectively.
A 1.0 × 10⁻³ mol L-1 hydrochlorothiazide solution was
prepared daily by dissolving 0.0298 g hydrochlorothiazide (p.a. 99%) in water and the solution was diluted with water to a 100 mL volumetric flask. The solution was kept in a
refrigerator at 4 oC in the dark. More dilute solutions were
prepared by serial dilution with water.
Britton-Robinson (B-R) buffers (0.1 mol L-1 in
phosphate, acetate and borate) in the pH range of 2-9 were used, throughout.
Apparatus
UV-Vis absorption spectra were measured on an Agilent UV-Vis spectrophotometer, PerkinElmer (Lambda 25), with 1.0 cm quartz cells.
A Pentium IV (2.53 MHz) computer controlled all of the setting and data processing.
A pH-meter (Metrohm, Model 691) with a double junction glass electrode was used to check the pH of the solutions.
Preparation of real samples
The method of Haussler and Hajdu17, and Forrey et al.18
were modified as follows: 1 mL of urine was acidified with about 50 µL of concentrated HCl and extracted for 2 min with 5 mL of diethyl ether in a 16 × 150 mm screw-capped tube by shaking rapidly on a wrist-action shaker, and then centrifuged. A 4 mL aliquot of the ether phase was removed and re-extracted for the same time interval
with 1 mL of 0.1 mol L-1 potassium phosphate buffer,
pH 9.0, followed by centrifugation, and the ether was then removed. The residual was diluted in a 250 mL volumetric flask. The spectra of the final solution were read by UV-Vis spectrophotometry.
Serum samples were obtained and stored frozen until the assay. Into each of 10 centrifugation tubes containing a certain concentration of hydrochlorothiazide and/or furosemide, 0.10 mL human serum sample was transferred, and then mixed well with 1.0 mL of methanol to precipitate the blood proteins. The precipitated proteins were separated by centrifuging of the mixture at 4000 rpm for 20 min. The clear supernatant layer was filtered through a 0.45 µm milli-pore filter to produce protein-free human serum. The human serum sample was transferred into a 25 mL calibrated flask, completed to the volume with B-R pH 9.0 buffer, and then introduced to the optical cell.
Recommended procedure
An aliquot of the solution containing hydrochlorothiazide and/or propranolol and 1 mL Britton-Robinson buffer solution (pH 9.0) were added into a 10 mL volumetric flask and made up to the mark with water. The solution was then allowed to stand for 10 min at room temperature. After that, a portion of the solution was transferred into a quartz cell to measure its absorbance at appropriate wavelength pairs (270 and 300 nm for determination of hydrochlorothiazide and 250 and 288 nm for determination of propranolol). The concentration ranges of hydrochlorothiazide and propranolol for construction
of HPSAM calibration curve were 10-60 µmol L-1 for
both species.
Results and Discussion
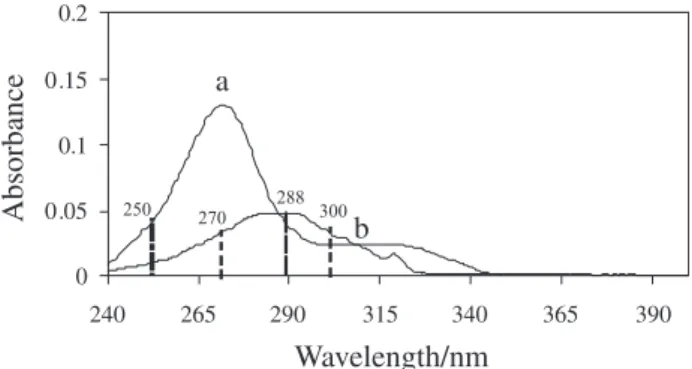
The absorption spectra of hydrochlorothiazide and propranolol under the experimental conditions are shown in Figure 1. As can be seen in Figure 1, the maximum wavelengths of two compounds are very close to each other and their spectra are highly overlapped. Therefore, determination of hydrochlorothiazide and propranolol in the presence of each other is impossible by classical spectrophotometry. Therefore, it is necessary to use a chemometrics method to solve this problem.
Effect of operational parameters
In order to optimize the procedure for the simultaneous determination of hydrochlorothiazide and propranolol, we studied the effect of chemical parameter involving pH on the maximum absorbance of two species separately.
As it is shown in Figure 2, there were not significant changes in the absorption spectra of hydrochlorothiazide and propranolol in the pH range 2-10, however, at pH > 4.0 the overlap between two spectra decreased. Therefore pH
of 9.0 was selected for obtaining higher selectivity and omitting interference ions.
H-point standard addition method
Consider an unknown sample containing an analyte X and an interferent Y. In this special system, hydrochlorothiazide and propranolol were considered as the analyte and interferent, respectively. The determination of concentration of X by HPSAM under these conditions
requires the selection of two wavelengths λ1 and λ2, at which
the interferent species, Y, has the same absorbance.19,20
Then, known amounts of X are successively added to the mixture and the resulting absorbances are measured at the two wavelengths and expressed by the following equations:
A(λ1) = b0 + b + Mλ1Ci (1)
A(λ2) = A0 + A + Mλ2Ci (2)
where, A(λ1)and A(λ2)are the analytical signals measured at
λ1 and λ2, respectively. b0 and A0 (b0 ≠A0) are the original
analytical signal of X at A(λ1) and A(λ2), respectively. b
and A are the analytical signals of Y at A
(λ1) and A(λ2),
respectively. Mλ1 and Mλ2 are the slopes of the standard
addition calibration lines at λ1 and λ2, respectively and Ci is
the added X concentration. The two straight lines obtained
intersect at the so-called H-point (−C
H, AH).
At H-point, since A(λ1) = A(λ2), Ci = CH, from equations 1 and 2 it follows that:
b
0 + b + Mλ1(–CH) = A0 + A + Mλ2 (–CH) (3)
–C
H = [(A0 – b0) + (A – b)]/(Mλ1 – Mλ2) (4)
From equation 4, if the component Y, is the known
interferent and the analytical signal correspondent to Y, b
(at λ1 or λ2) do not change with the additions of analyte X,
that is, b = A = constant, so:
Figure 1. Absorption spectra of (a) 10 µmol L-1 hydrochlorothiazide
and (b) 10 µmol L-1 propranolol at pH 4.0. The dash lines are selected
wavelengths for applying HPSAM.
Figure 2. Effect of pH on the maximum absorption spectra of (a) 10 µmol L-1
–CH = (A0 – b0)/(Mλ1 – Ml2) = –b0/Mλ1 = –A0/Mλ2 (5)
where, CH = CX and CX corresponds to the analyte
concentration in the mixture, because − C
H depends only
on variables related to the analyte.21
If the value of − C
H is included in equation 1, AH, the
ordinate value of the intersection point will be described as follows:
A
H = b0 + b + Mλ1(–CH) (7)
as b
0 = Mλ1CH, then AH = b and similarly,
AH = A (8)
Hence, A
H value is only related to the signal of the
interferent Y at the two selected wavelengths. To evaluate the interferent concentration from the ordinate value of
the H-point (AH), a calibration curve or the absorbance
value of an interferent standard is needed. Similarly, for determination of Y by HPSAM under these conditions,
selection of two wavelengths λ1 and λ2, at which the species
X, has the same absorbance is possible.
Wavelength selection
To select the appropriate wavelength pair for using HPSAM the following principles should be applied. At these selected wavelengths the analyte signals must be linear with concentrations and the interferent signal must be equal, remaining unchanged by changing the analyte concentration. The analytical signal obtained from a mixture containing the analyte and the interfering should be equal to the sum of the individual signals of the two components. In addition, the difference in the slopes of the two straight lines measured
at two selected wavelengths (λ1 and λ2) must be as large as
possible in order to get good accuracy and sensitivity.19-24
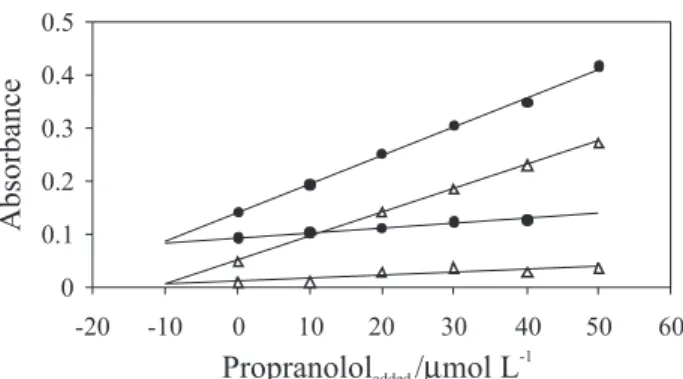
For determination of hydrochlorothiazide and propranolol, we selected two pairs of wavelengths on the hydrochlorothiazide and propranolol spectra. In this case there were several pairs of wavelengths. As it is observed from Figure 1, the best wavelength pairs were 270-300 and 250-288 nm for determination of hydrochlorothiazide and propranolol respectively. Standard solutions of two species were initially tested to validate the applicability of the chosen wavelengths. Figures 3, 4 are H-point standard addition calibration lines constructed at two selected wavelengths (250-288 nm) for determination of propranolol in the present of hydrochlorothiazide. According to the characteristics of
HPSAM at the H-point, C
H is independent of interferent
concentration, but AH is dependent of the interferent.
Accuracy
Several synthetic samples with a different concentration ratio of hydrochlorothiazide and propranolol were analyzed by using the suggested method. As can be seen from Table 1, the accuracy of the results is satisfactory in the concentration ratio of hydrochlorothiazide to propranolol varying from 1:20 to 10:1.
Reproducibility of the method
To check the reproducibility of the method four replicate experiments for the analyze of hydrochlorothiazide and propranolol mixtures were done (Table 2). A good standard deviation was obtained for two pharmaceutical compounds.
Application
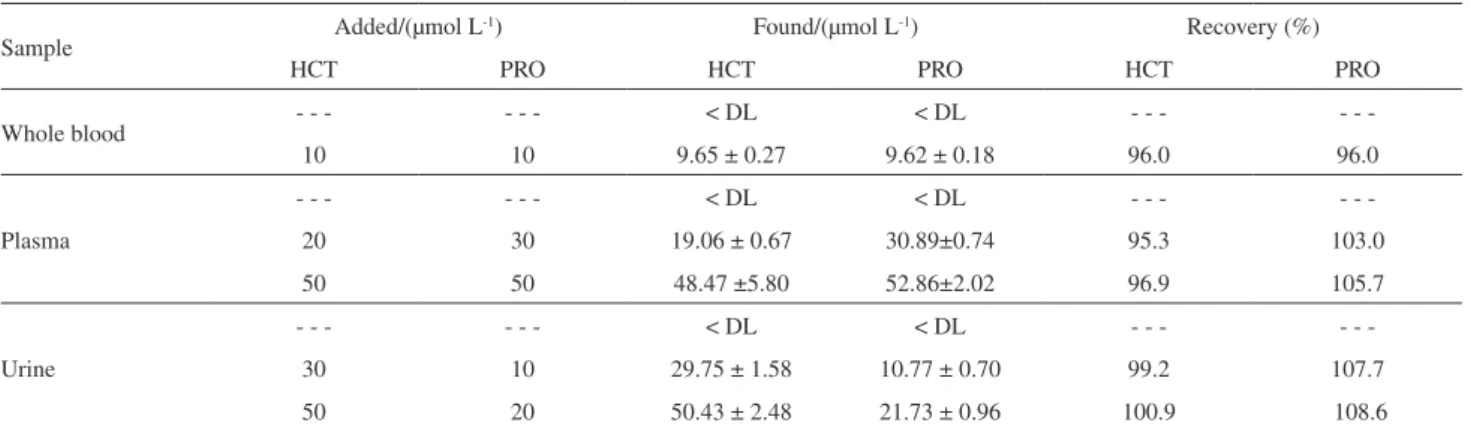
In addition for showing the applicability of the method, biological fluids with complex matrixes were spiked with hydrochlorothiazide and propranolol and proposed method was applied for their determination. The results are shown in Table 3. It can be seen that the results are all satisfactory.
Figure 3. H-point standard addition plot for fixed propranolol concentration (10 µmol L-1) and different concentrations of hydrochlorothiazide at
wavelengths 250 and 288 nm at pH 9.0.
Figure 4. H-point standard addition plot for fixed hydrochlorothiazide concentration (10 µmol L-1) and different concentration of propranolol at
Limit of detection
Limit of detection was calculated as LOD= 3SCH,
were SCH is the standard deviation of several (n = 6)
replicated measurements of zero concentration of analyte with the HPSAM. The corresponding value obtained for
hydrochlorothiazide and propranolol was 0.65 µmol L-1.
Interferents
For analyzing interference, the influence of several species was tested, including those that most frequently accompany hydrochlorothiazide and propranolol in real samples. The effect of interfering species at different concentrations on
the current response of a solution containing 10 µmol L-1
of each analyte was studied. An ion was considered to interfere when its presence produced a variation in the
absorbance of the sample (at two wavelengths) greater
than ± 10%. The ions Fe2+, Fe3+, Zn2+, SO
4
2-, Ni2+, Cu2+,
Cr3+, Li+, K+, Br− and Cl− did not interfere at the 1000 times
more than pharmaceutical compounds. Other high pressure drugs such as nalidixic acid and captopril did not interfere up to 10 times excess. Among the pharmaceutical drugs examined, most did not interfere at high level except losartan, hydralazine, methoprolol and cipropheloxacin which would be tolerated at low concentration levels but these drugs are
Table 1. Determination of hydrochlorothiazide and propranolol in some synthetic mixtures
A-C equation
R2
Present in the sample/ (µmol L-1)
Found/ (µmol L-1)
HCT* PRO** HCT PRO
A270 = 0.0029C + 0.0330 0.9815 1 10 0.91 9.70 A300 = 0.0008C + 0.0311 0.9957
A288 = 0.0057C + 0.0576 0.9895 A250 = 0.0018C + 0.0196 0.9912
A270 = 0.0025C + 0.0264 0.9931 10 1 9.54 1.20 A300 = 0.0003C + 0.0054 0.9953
A288 = 0.0060C + 0.0192 0.9983 A250 = 0.0011C + 0.0132 0.9952
A270 = 0.0015C + 0.0427 0.9947 10 10 9.00 10.43 A300 = 0.0002C + 0.0310 0.9468
A288 = 0.0045C + 0.0506 0.9996 A250 = 0.0006C + 0.0099 0.8326
A270 = 0.0188C + 0.5556 0.9710 20 40 19.96 39.89 A300 = 0.0019C + 0.2182 0.9951
A288 = 0.0057C + 0.2716 0.9987 A250 = 0.0010C + 0.0841 0.9753
A270 = 0.0160C + 0.9103 0.9885 50 50 47.10 49.22 A300 = 0.0025C + 0.2748 0.9743
A288 = 0.0056C + 0.4068 0.9949 A250 = 0.0010C + 0.1804 0.9766
A270 = 0.0149C + 1.8640 0.9946 100 100 107.30 97.10 A300 = 0.0025C + 0.5553 0.9970
A288 = 0.0067C + 1.1399 0.9951 A250 = 0.0030C + 0.7806 0.9923
A270 = 0.0153C + 0.1395 0.9986 2 40 1.7 37.49 A300 = 0.0024C + 0.1171 0.9241
A288 = 0.0051C + 0.1947 0.9940 A250 = 0.0010C + 0.0410 0.9928
* Hydrochlorothiazide; ** Propranolol.
Table 2. Results of the replicate measurements for determination of hydrochlorothiazide and propranolol in synthetic mixtures
A-C equation R2
Present in the sample/ (µmol L-1)
Found/ (µmol L-1)
HCT* PRO** HCT PRO
A270 = 0.0146C + 0.3362 0.9978 20.0 10.0 20.66 9.76 A300 = 0.0019C + 0.0737 0.9937
A288 = 0.0057C + 0.1035 0.9993 A250 = 0.0011C + 0.0586 0.9955
A270 = 0.0147C + 0.3280 0.9994 20.0 10.0 20.28 10.08 A300 = 0.0020C + 0.0704 0.9979
A288 = 0.0055C + 0.1062 0.9999 A250 = 0.0010C + 0.0608 0.9998
A270 = 0.0146C + 0.3245 0.9998 20.0 10.0 19.92 10.30 A300 = 0.0019C + 0.0715 0.9989
A288 = 0.0055C + 0.1035 0.9999 A250 = 0.0010C + 0.0571 0.9989
A270 = 0.0147C + 0.3204 0.9997 20.0 10.0 19.79 10.15 A300 = 0.0020C + 0.0690 0.9997
A288 = 0.0055C + 0.1046 0.9998 A250 = 0.0010C + 0.0589 0.9945
Average 20.16 10.07
Standard deviation 0.39 0.23
A270 = 0.0140C + 0.2186 0.9985 10.0 20.0 10.04 20.90 A300 = 0.0019C + 0.0970 0.9819
A288 = 0.0054C + 0.1449 0.9986 A250 = 0.0009C + 0.0508 0.9654
A270 = 0.0140C + 0.2158 0.9992 10.0 20.0 10.10 18.68 A300 = 0.0020C + 0.0945 0.9959
A288 = 0.0056C + 0.1379 0.9984 A250 = 0.0009C + 0.0501 0.9942
A270 = 0.0138C + 0.2172 0.9992 10.0 20.0 10.10 18.90 A300 = 0.0019C + 0.0967 0.9939
A288 = 0.0057C + 0.1393 0.9981 A250 = 0.0010C + 0.0504 0.9864
A270 = 0.0141C + 0.2117 0.9995 10.0 20.0 9.68 19.06 A300 = 0.0019C + 0.0936 0.9959
A288 = 0.0058C + 0.1362 0.9993 A250 = 0.0011C + 0.0466 0.9990
Average 9.98 19.38
Standard deviation 0.20 1.02
Table 3. Determination of hydrochlorothiazide and propranolol in some biological fluids (n = 3)
Sample Added/(µmol L
-1) Found/(µmol L-1) Recovery (%)
HCT PRO HCT PRO HCT PRO
Whole blood - - - < DL < DL - - -
10 10 9.65 ± 0.27 9.62 ± 0.18 96.0 96.0
Plasma
- - - < DL < DL - - -
20 30 19.06 ± 0.67 30.89±0.74 95.3 103.0
50 50 48.47 ±5.80 52.86±2.02 96.9 105.7
Urine
- - - < DL < DL - - -
30 10 29.75 ± 1.58 10.77 ± 0.70 99.2 107.7
50 20 50.43 ± 2.48 21.73 ± 0.96 100.9 108.6
“±“ Amounts are confidence intervals (n=3).
not used in a combination form with hydrochlorothizide and popranolol.
Conclusions
The suggested method shows that application of HPSAM can be well adopted for resolving binary mixtures of hydrochlorothiazide and propranolol. The proposed method provides satisfactory results in synthetic and real mixtures. The method also offers good selectivity, accuracy and precision that can be applied for different concentration ratios.
Acknowledgments
The authors gratefully acknowledge the support to this work by Islamic Azad University branch of Gachsaran (IAUG) and Najafabad Institute of Higher Education. Also the assistance of Darou Pakhsh and Pharma Chemie Medical pharmaceutical companies for offering pure drugs is gratefully acknowledged.
References
1. Wright, J.M.; Lee, C.H.; Chamber, E.K.; Can. Med. Assoc. J.
1999, 161, 25.
2. http://www.accessdata.fda.gov/Scripts/cder/DrugsatFDA, accessed in September 2008.
3. http://en.wikipedia.org/wiki/Propranolol, accessed in September 2008.
4. Wolff, M.E., ed. In Therapeutic Agents, Burger’s Medicinal Chemistry and Drug Discovery, 5th ed., Wiley-Interscience,
New York, 2000, vol. 2.
5. http://www.healthsquare.com/newrx/ind1208.htm, accessed in September 2008.
6. Liu, F.; Xu, Y.; Gao, S.; Zhang, J.; Guo, Q.; J. Pharm. Biomed. Anal. 2007, 44 1187.
7. Li, H.; Wang, Y.; Jiang, Y.; Tang, Y.; Wang, J.; Zhao, L.; Gu, J.; J. Chromatogr. B2007, 852, 436.
8. Huang, T.; He, Z.; Yang, B.; Shao, L.; Zheng, X.i; Duan, G.; J. Pharm. Biomed. Anal. 2006, 41, 644.
9. Pulgarín, J.A.M.; Molina, A. A.; Olivares, G. P.; Anal. Chim. Acta2004, 518, 37.
10. Khalil, S.; Borham, N.; J. Pharm. Biomed. Anal. 2000, 22, 235.
11. Ruiz, T. P.; Lozano, C. M.; Tomás, V.; Carpena, J.; Talanta1998, 45, 969.
12. Yousry, M. I.;Alaa S. A.; Microchim. Acta1995, 118, 85. 13. Fell, A. F.; Robinson, M. L.; Dyas, A. M.; Analyst1991, 116,
1343.
14. Lai, F.; Mayer, A.; Sheehan, T.; J. Pharm. Biomed. Anal.1993, 11,117.
15. Sirén, H.; Jumppanen, J.H.; Manninen, K.; Riekkola, M.L.; Electrophoresis 1994, 15, 779.
16. Pham-Huy, C. ; Radenen, B.; Sahui-Gnassi, A.; Claude, J.-R.; J. Chromatogr., B: Biomed. Sci. Appl.1995, 665, 125. 17. Haussler, A.; Hajdu, V.P.; Arzneim. Forsch. 1964, 14, 710. 18. Forrey, A.W.; Kimpel, B.; Blair, A.D.; Cutler, R.E.; Clin. Chem.
1974, 20, 152.
19. Reig, F. B.; Falco, P. C.; Analyst1988, 113, 1011.
20. Reig, F. B.; Falco, P. C.; Hernandez, B. H.; Cabeza, A. S.; Anal. Chim. Acta1992, 257, 89.
21. Safavi, A.; Abdollahi, H.; Talanta2001, 54, 727.
22. Shams, E.; Abdollahi, H.; Yekehtaz, M.; Hajian, R.; Talanta 2004,63, 359.
23. Shams, E.; Abdollahi, H.; Hajian, R.; Electroanal. 2005, 17, 1589.
24. Ensafi, A.A.; Hajian, R.; Anal. Chim. Acta2006, 580, 236.
Received: September 24, 2008