Received: December 30, 2009 Accepted: May 11, 2010
Conflict of Interest Statement: The authors state that there are no financial and personal conflicts of interest that could have inappropriately influenced their work.
Copyright: © 2010 Yévenes et al.; licensee EDIPUCRS. This is an Open Access article distributed under the terms of the Creative Commons Attribution-Noncommercial-No Derivative Works 3.0 Unported License.
Fluoride intake in preschoolers from two different
communes in Santiago, Chile
Ingestão de flúor em crianças pré-escolares de duas
comunidades em Santiago, Chile
Ismael Yévenes a Barbara Henández b Alfredo Apip Ramos b Miguel Neira Jara a Paula Maass Wolfenson a Ljubica Petrasic a
a Department of Chemical, Dental School,
University of Chile, Santiago, Chile
b Department of Restorative Dentistry, Dental
School, University of Chile, Santiago, Chile
Correspondence: Ismael Yévenes
Department of Chemistry, Dental School. University of Chile
Sergio Livingstone (ex-Olivos) 943, Independencia Santiago – Chile
E-mail: [email protected]
Abstract
Purpose: To determine the fluoride intake in three- to five-year-old preschool children from two communes in Chile, one with a non-fluoridated public water supply (Maipú) and the other with fluoridated public water supply since 1996, at a fluoride concentration of 0.6 mg/L (Peñalolen).
Methods: Cross-sectional, observational design. The sample population was composed of 200 three-to-five-year-old children attending four kindergartens in the Santiago Metropolitan Region, Chile, in the communes of Maipú and Peñalolen. Intake of fluoride was measured in a morning urine sample by using an ion-specific electrode and creatinine concentration. The fluoride intake from other sources was estimated from the parents’ and educators’ survey answers.
Results: The daily dose of fluoride intake (DDI) for all Maipú preschoolers was 0.021 mg F/kg body weight (bw)/day, a value less than the optimal dose, which is 0.05 to 0.07 mg F/kg bw/day. The DDI for the Peñalolen sample reached 0.066 mg F/kg bw/day. There is a contribution from fluoride toothpaste ingestion of 0.019 mg F/kg bw/day in Maipú and 0.017 mg F/kg bw/day in Peñalolen. The overall frequency of daily brushing was 3.15 times, during which 31% of Maipú children and 33% of Peñalolen children ingested toothpaste. The estimated amount of fluoride intake from toothpaste and tea consumption explained the contribution of fluoride not coming from fluoridated water.
Conclusion: The fluoride ingestion from water and other sources in the preschool commune of Peñalolen is much higher than the fluoride intake in preschoolers of the Maipú district. Key words: Fluoride; children; ingestion
Resumo
Objetivo: Determinar a ingestão de flúor em pré-escolares de três a cinco anos de idade, de duas comunidades de Santiago, Chile, sendo uma com abastecimento público de água não fluoretada e outra com água fluoretada.
Metodologia: Estudo observacional, transversal. A amostra foi composta de 200 crianças de três a cinco anos de idade, com boa saúde geral, de baixo nível socioeconómico, que frequentavam quatro jardins de infância da Região Metropolitana de Santiago, Chile. Duas escolas estavam localizadas em Maipú, que não tem água pública fluoretada e duas escolas estavam localizadas em Peñalolén, com água fluoretada desde 1996, em uma concentração de flúor de 0,6 mg/L. A ingestão de flúor foi medida em uma amostra de urina da manhã, medindo-se o flúor com eletrodo íon-específico e concentração de creatinina com o produto comercial VALTEK (R). A ingestão de flúor estimado de outros veículos foi avaliada por questionários aos pais e educadores.
Resultados: A dose diária de ingestão de flúor (DDI) para todos os pré-escolares Maipú foi 0,021 mg F/kg peso corporal (pc)/dia, um valor menor do que a dose ideal de flúor, de 0,05 para 0,07 mg F/kg corporal/dia. Na amostra de Peñalolen a DDI atingiu 0.066 mg F/kg corporal/dia, dentro dos parâmetros ideais. Houve cerca de 0,019 mg F/kg bw/dia em Maipú e 0.017 mg F/kg corporal/dia em Peñalolén proveniente da ingestão de creme dental com flúor. A frequência de escovação diária foi de 3,15 vezes, sendo que 31% das crianças de Maipú e 33% das crianças Peñalolen ingeriam creme dental. Cerca de 46,5% das crianças bebia chá todos os dias. A estimativa para a quantidade de ingestão de flúor do creme dental e consumo de chá explica a contribuição de flúor não proveniente de água fluoretada. Conclusão: A ingestão de flúor da água e outras fontes no município de Peñalolen pré-escolar é muito maior que a ingestão de flúor em pré-escolares do distrito de Maipú.
Introduction
Studies of the levels of urinary excretion of luoride (F) provide important information when monitoring health status and have modiied the concentration of luoride used in food or drink for human consumption. Thus, this process becomes part of Public Health for evaluation of those programs and establishes relationships between intake dose and possible physiological changes or beneicial effects.
The percentage of luoride actually absorbed and utilized by the body, also known as bioavailability, is variable. According to the INTA (Institute of Nutrition and Food Technology in Chile), the bioavailability is 100% in water, drops and tablets; 69% in milk and 50% in food in general (1).
The main contributor to the total intake of luoride is drinking water. In the U.S, approximately 76% of the luoride ingested by the population comes from water and non-dairy beverages (soft drinks) (2,3). However, it is important to take into consideration all potential sources. One of these sources includes toothpaste because it has a strong contributor to the total luoride intake (4).
In 2001, the Institute of Medicine, Food and Nutrition Board (USA), determined that there is an optimal dose of systemic luoride, which gives the maximum beneit, when compared to dental caries level. Based on empirical data, the optimal dose range is 0.05 to 0.07 mg F/kg/day (5).
Fluoride absorption is rapid and depending on its bioavailability, is delivered directly to the circulatory system. Studies indicate that 50% of luoride absorbed is excreted in the urine 24 hours after ingestion, and the rest is retained in mineralized tissues (6,7).
The renal excretion of the luoride ion ranges from 30% to 85% in children between 3 and 5 years. Regarding
this, it has been determined that in general, the higher the luoride intake, age and urine low, the greater the luoride excretion (8-12).
In Chile, approximately 66.3% of the population receives public water with a luoride concentration of 0.6 mg/L (ppm), and the majority of this population are residents of the metropolitan area. Among these communities, Peñalolen has supplemented luoride in their public water supply since 1996. Moreover, there are still communities in the metropolitan area that are outside this program. One of those is Maipú, which owns an independent drinking-water-network, SMAP, which has only partially implemented luoridation of the water supply, leaving large sections of the community without this supplement in drinking water (13,14). The purpose of this study was to determine the luoride intake in preschool children of these two communities.
Methodology
Characteristics of the Study
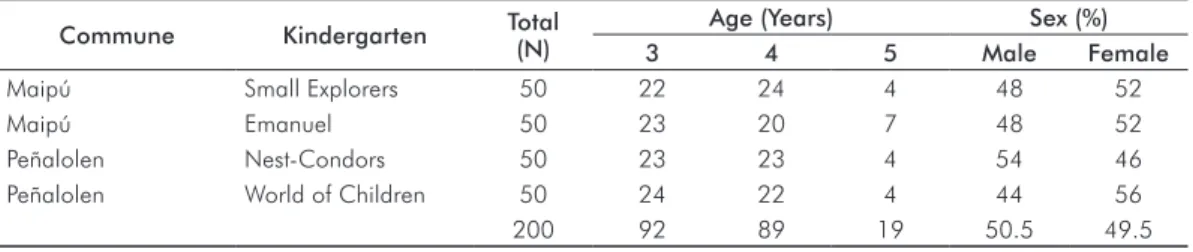
Observational, Cross-sectional. The sample was composed of 200 children attending four kindergarten schools belonging to the board of the National Kindergartens (JUNJI) of the Santiago Metropolitan Region, in Chile. Two schools were located in the commune of Maipú (Emanuel and Small Explorers) and two schools in the commune of Peñalolen (World of Children and Nest-Condors). From each kindergarten school, 50 children between 3 and 5 years old were selected, and the age distribution is displayed in Table 1. The age of the children was considered as completed years from the date of the examination, i.e., a 3 year-old child was
considered the age from 3 years and 0 months until 3 years, 11 months and 30 days. The correlation between weight and age are shown in Table 2.
Table 1.Distribution of the study population for kindergarten, community, age and sex.
Commune Kindergarten Total
(N)
Age (Years) Sex (%)
3 4 5 Male Female
Maipú Small Explorers 50 22 24 4 48 52
Maipú Emanuel 50 23 20 7 48 52
Peñalolen Nest-Condors 50 23 23 4 54 46
Peñalolen World of Children 50 24 22 4 44 56
200 92 89 19 50.5 49.5
Table 2. Average body weight (in kg) for each kindergarten, by age group.
Age (in years)
Small Explorers (Maipú)
Emanuel (Maipú)
Nest-Condors (Peñalolen)
World of Children (Peñalolen) Mean
Weight (SD)
Mean
Weight (SD)
Mean
Weight (SD)
Mean
Weight (SD)
3 16.51 (2.14) 16.56 (2.14) 14.90 (1.88) 17.28 (2.29)
4 17.64 (3.68) 19.10 (2.54) 17.49 (2.37) 18.19 (2.42)
This study was approved by the Ethics Committee of the Faculty of Dentistry of the University of Chile, and the parents of all children accepted participation in the study, signed an informed consent form and verbally conirmed that the residence of the child never changed since birth. The 2003 CASEN survey (Social Economic Characterization Survey) indicated that the target population had low socioeconomic status with a poverty percentage of 10.5% and 16.7% for the districts of Maipú and Peñalolen, respectively. The subjects included in the study have good general health and reside in the Maipú or Peñalolen communes of the Metropolitan Region. The exclusion criteria were those children who have changed their commune of residence throughout their lives. Table 2 demonstrates a correlation between weight and age. There is no statistically signiicant difference between groups (P>0.05). The average body weight was 17.5 kg for
Peñalolen children and 17.6 kg for Maipú children. The results for the preschools of Peñalolen are similar and were treated as a single population for the analysis. A similar analysis was performed for the children of Maipú.
Procedures
Plastic bottles labeled with the name of each child were handed to parents, with instructions to collect a morning urine sample. To ensure stability, they were asked to keep the sample refrigerated at home until the time of collection. The dates of urine sample collection were agreed upon by the teachers of each grade. During the collection, urine samples remained at the kindergarten, stored in a cooler with ice close to ± 4°C. The samples were transferred under the same conditions. Each cooler also contained two water samples from different points of the kindergarten. The samples were kept refrigerated until they were processed within the next 72 hours. The process from sample collection to analysis lasted 5 days total. The luoride and creatinine levels in the urine samples were measured, which provided the daily luoride intake.
Determination of Fluoride in Urine and Water
Fluoride in urine and water was determined in potentiometric form, with an ion-speciic electrode, according to the technique described by Villa (15), modiied by Yévenes et al. (16). 5 ml of TISAB II was added to 5 mL iltered urine/water and read directly by an ion meter previously calibrated, obtaining readings in mg/L (ppm: parts per million) of luoride.
Creatinine determination
We used a commercial product by VALTEK, based on the Jaffé reaction (17), where the creatinine mixed with alkaline picrate produces an orange color in proportion to the concentration in the sample and was measured at 510 nm in a spectrophotometer.
Calculation of excreted fluoride in urine
We used an equation that relates the ratio of morning luoride/ creatinine, described by Villa (18)to determine urinary
luoride excretion in preschool children at the community level
Fluoride/creatinine = -0.13+ 3.59 excreted per day
Evaluation of the average daily intake (DDI) of fluoride
We calculated DDI using an equation that relates the ratio of measured luoride excretion/day (mg/day)/average predicted excretion of luoride ingested, which is 35.5% (11), considering the average weight of the group under study.
Determination of daily frequency of toothpaste use and weekly tea consumption
Frequencies were determined from results of a survey, which was answered by parents, guardians and educators. Determination of the daily intake of luoride from toothpastes was calculated using the equation that relates the ratio between the average daily brushing, the type of paste, the amount of toothpaste used and the intake/body weight. It was assumed that 35.5% of the paste used is ingested by the children in this age group (15).
Statistical analysis
Data were analyzed by Statistic 4.5 software (StatSoft, Tulsa, USA) with Student’s t-test and analysis of variance at a 0.05 signiicance level and 95% conidence interval.
Results
The results of the urinary parameters of a single morning urine sample for the 200 children studied are shown in Table 3. The value of creatinine is similar between the two samples studied. The value of the luoride concentration in urine, expressed as mg/L, shows differences between communities. The population from Maipú exhibited an average of 0.15 mg/L, while in Peñalolen, this value reached 0.51 mg/L, which is signiicantly higher (P<0.05).
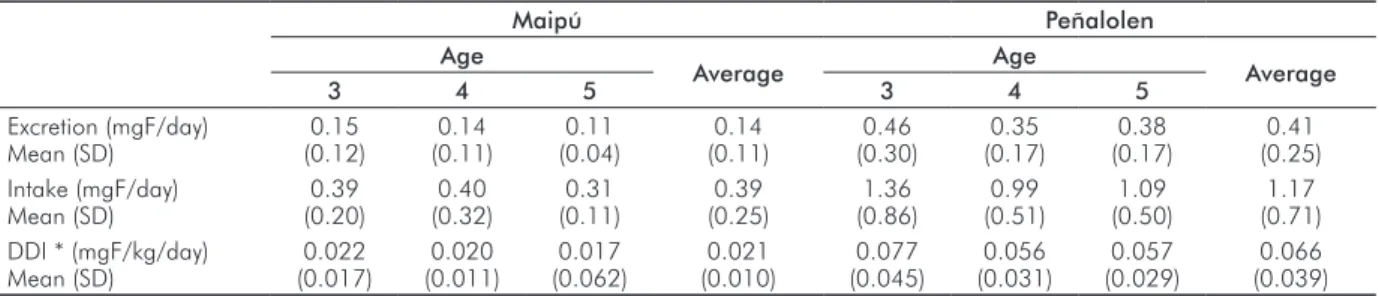
Table 4 shows the results of the excretion study for Maipú and Peñalolen. In Maipú, the excretion average for the group studied is 0.14±0.11 mg F/day. According to this value, the total calculated intake for the group was 0.39±0.25 mg F/day and the daily dose (DDI) reached 0.021 mg F/kg bw/day±0.010 mg F/kg bw/day. The values of excretion for Peñalolen had an average of 0.41±0.25 mg F/day for the three groups studied; there is an increased contribution of the group of children 3 years of age, which is also observed in the intake values and the daily dose. Values for these parameters indicate that children ingested 1.17±0.71 mg F/day, and the daily dose reached 0.066±0.039 mg F/kg bw/day.
toothpaste reaches similar values in Maipú and Peñalolen, 77% and 79% respectively. About 23% of the children in Maipú occasionally used adult toothpaste in the household. This value is equivalent to Peñalolen, reaching 24%. The average frequency of brushing was 3.15 times per day in both communities. In relation to the amount of toothpaste used, the “pea size” was selected by 100% in all four kindergartens. At home, the same size category reached 60% in Maipú and 73% in Peñalolen. The category of “medium brush” is slightly higher in Maipú (37%) than in Peñalolen (21%). The “brush all” presented minimum values in both communes. The ingestion of toothpaste is similar in both communes, 31% in Maipú and 33% in Peñalolen. These
values are an average intake between home and school. In this study, no signiicant differences between home or kindergarten (P>0.05) intakes were found. The estimated
dose of daily intake of luoride from toothpastes was 0.019 mg F/kg bw/day for Maipú and 0.017 mg F/kg bw/day for Peñalolen. Values are explained by the similarity in the measured parameters as type and quantity of paste and frequency of use. All subjects reported no tea consumption in the kindergarten. Tea consumption at home was similar in both communities, reaching 49% in Maipú and 44% in Peñalolen, whereas the average number of cups per day was less than one cup, 0.8 and 0.55, respectively (Table 6).
Table 3. Urinary parameters, average values.
Maipú Age in years
Peñalolén Age in years
3 4 5 Average 3 4 5 Average
Fluoride (mg/L) Mean (SD)
0.13 (0.08)
0.17 (0.18)
0.14 (0.07)
0.15 (0.13)
0.46 (0.27)
0.54 (0.30)
0.62 (0.17)
0.51 (0.28) Creatinine (g/L)
Mean (SD)
0.39 (0.12)
0.50 (0.11)
0.57 (0.15)
0.45 (0.13)
0.35 (0.16)
0.51 (0.17)
0.58 (0.19)
0.44 (0.19)
Table 4. Urinary parameters of the children according to age group in Maipú and Peñalolen.
Maipú Peñalolen
Age
Average Age Average
3 4 5 3 4 5
Excretion (mgF/day) Mean (SD)
0.15 (0.12)
0.14 (0.11)
0.11 (0.04)
0.14 (0.11)
0.46 (0.30)
0.35 (0.17)
0.38 (0.17)
0.41 (0.25) Intake (mgF/day)
Mean (SD)
0.39 (0.20)
0.40 (0.32)
0.31 (0.11)
0.39 (0.25)
1.36 (0.86)
0.99 (0.51)
1.09 (0.50)
1.17 (0.71) DDI * (mgF/kg/day)
Mean (SD)
0.022 (0.017)
0.020 (0.011)
0.017 (0.062)
0.021 (0.010)
0.077 (0.045)
0.056 (0.031)
0.057 (0.029)
0.066 (0.039)
* DDI: Daily Dose Ingestion.
Table 5. Toothpaste type, quantity and intake in brushing teeth in kindergarten and the home in Maipú and Peñalolen.
Place Toothbrushing Toothpaste Type (%) Quantity (%) Intake (%)
Nº time/day Infant Adult Both Pea Middle Brush All No Yes
Maipú
Kindergarten 1.03 100 0 0 100 0 0 67 33
Home 2.12 77 8 15 60 37 3 70 30
Total 3.15 88.5 4 7.5 80 18.5 1.5 69 31
Peñalolen
Kindergarten 1.05 100 0 0 100 0 0 73 27
Home 2.10 79 13 11 73 21 6 61 39
Total 3.15 89.5 6.5 5.5 86.5 10.5 3 67 33
Commune No (%) Yes (%) Nº mugs/day
Maipú 51 49 0.8
Peñalolén 56 44 0.55
Total 53.5 46.5 0.67
Table 6. Daily intake of tea at
Discussion
The municipality of Maipú, which has no luoridation program for the public water supply, showed an average fluoride concentration of 0.1 ppm between the two kindergartens analyzed in this study. The “Emanuel” kindergarten presented a concentration of 0.1 mg/L (ppm) luoride, while in “Small Explorers”, it was of 0.09 mg/L. These values are lower than those reported by Villa in 1996 for the metropolitan area prior to the program “Fluoridation of water consumption” (0.20 mg/L luoride) (19).
The “World of Children” and “Nest-Condors” kindergarten of Peñalolen showed a concentration of 0.45 mg/L and 0.5 mg/L luoride in the water consumed, respectively, giving an average of 0.48 mg/L luoride. Regarding this commune, the MINSAL reported in 2004 a concentration of 0.67 mg/L, higher than the value found in this study. All values were obtained by taking two samples of drinking water at different sites of each educational venue. The data in this study shows a clear difference in the amount of available luoride intake through water consumption.
Values of DDI in the municipality of Maipú was higher than those reported in Japanese children between 1 and 6 years (0.019 mg F/kg bw/day) (20), but lower than the non-luoridated communities in New Zealand (0.027 mg F/kg bw/day) (21) and in children 3 and 4 years of age and in non-luoridated areas of the northeast of England (0.031 mg F/kg bw/day) (22), although all these values are lower than the recommended DDI, between 0.05 to 0.07 mg F/kg bw/day (5). In the luoridated commune of Peñalolen, the value 0.066 mg F/kg bw/day was similar to the DDI found in the study in 2000 (11), but higher than the 0.036 mg F/kg bw/day found in children 3 and 4 years old in luoridated areas of New Zealand (21), the 0.047 mg F/kg bw/day found in English children in luoridated areas (22) and the
0.053 mg F/kg bw/day in German children (23). Groups of children 4 to 5 years old in this study were found in the recommended ranges of DDI, whereas the group that was three years of age was located on the optimum. These indings are consistent with other studies that compare luoride intake in children in relation to weight body decreases (20).
The daily dose of luoride ingested from toothpastes was 0.019 mg F/kg bw/day for Maipú and 0.017 mg F/kg bw/day for Peñalolen. This was similar to previous studies in 1996 (19) and 2004 (14), which reported values reaching 0.025 and 0.017 mg F/kg bw/day, respectively. However, a recent study investigating the luoride intake from toothpaste in 1- to 3-year-old Brazilian children (4), reported 0.106±0.085 mg F/kg bw/day and speculated that this different contribution of toothpaste may be due to the higher luoride concentrations found in toothpaste; age differences of the study population, as younger children are more likely to swallow toothpaste; or differences in the methods of estimating the luoride intake from toothpaste.
In relation to tea intake, the results indicate that 46.5% of the total population consumes tea, with an average of 0.67 cups per person per day. These igures are lower than those described by the MINSAL in 2004 (56.69% of intake) and Campos in 2006 (61.2%) (24), although the frequency is similar, as that study reached 0.68 cups per person per day. This infusion is an important source of luoride and, in our population, is a signiicant part of the daily diet of a signiicant percentage of the children studied.
Conclusions
The ingestion of luoride from water and other sources in the preschool commune of Peñalolen is much higher than the intake of preschoolers in the commune of Maipú.
References
Institute of Nutrition and Food Technology 1985. “Bioavailability of 1.
fluoride: a study of the fluoride level”. First Symposium on Fluorides. INTA. U de Chile, Santiago.
Fomon SJ, Ekstrand J, Fluoride Intake. In: Fejerskov O, Ekstrand J, 2.
Burt B, (eds). Fluoride in Dentistry. Copenhague: Munksgaard; 1996. p.40-52.
Subba-Rao G. Dietary intake and bioavailability of fluoride. Am Rev 3.
Nutr 1984;4:115-36.
de Almeida BS, da Silva Cardoso VE, Bufazalaf MAR. Fluoride 4.
ingestion from toothpaste and diet in 1- to 3-year-old Brazilian children. Community Dent Oral Epidemiol 2007;35:53-63. Institute of Medicine, Food and Nutrition Board. Dietary reference 5.
intakes (DRIs): Applications in Dietary Assessment. Washington DC: National Academy Press, 2001.
Whitford GM. The metabolism and toxicity of fluoride. In: Myers 6.
HM (ed) Monographs in oral science. S.Karger, Basel. 1996. p.10-29.
Whitford GM. The metabolism and toxicity of fluoride. In: Myers 7.
HM (ed) Monographs in oral science. S.Karger, Basel. 1996. p.1-9.
Grijalva-Haro MI, Barba-Leiva ME, Laborin-Alvarez A. Fluoride 8.
intake and excretion among children in Hermosillo, Sonora, Mexico. Salud Pública Mex 2001;43:127-34.
Zohouri F V, Rugg-Gunn AJ. Total fluoride intake and urinary 9.
excretion in 4-year-old Iranian children residing in low-fluoride areas. Br J Nutr 2000;83:15-25.
Haftenberg M, Viergutz G, Neumeister V, Hetzer G. Total fluoride 10.
intake and urinary excretion in german children aged 3-6 years. Caries Res 2001; 35:451-7.
Villa AE, Anabalón M, Cabezas L. The fractional urinary fluoride 11.
excretion in young children under stable fluoride intake conditions. Community Dent Oral Epidemiol 2000;28:344-55.
Gómez S. Fluoride therapy in dentistry for children and adolescents. 12.
3.ed. Por Grant Educacional Colgate. Santiago, 2001.
Villa AE, Guerrero S, Villalobos J. Estimation of optimal concentration 13.
of fluoride in drinking water under conditions prevailing in Chile. Community Dent Oral Epidemiol 1998;26:249-55.
MINSAL Dental Department. Report of progress of the national 14.
Villa A. Rapid method for determining very low fluoride con- 15.
centrations using a ion selective electrode. Analyst 1988;113: 50-6.
Yévenes I, Reyes J, Sánchez U, Sanza H. Study and determination 16.
of fluoride, triclosan and zinc citrate dentifrices double action. Av Odonto Estomatol 1999;15:433-44.
Bonsnes RW, Taussky HH. Colorimetric on the determination 17.
of creatinine by the Jaffe reaction. J Biol Chem 1945;158: 581-91.
Villa A. A new method for determining fluoride excretion in 18.
preschool children at the community level. Odontol Chil 1994; 42:28-31.
Villa A, Salazar G, Andrade M, Villa C, Anabalón M, Cabezas S et 19.
al. Study of urinary excretion and the use of toothpastes and other sources of fluoride in children pre-school, regions II, VI, VIII, IX, X and RM. Chilean Health Ministry; 1996.
Kimura T, Morita M, Kinoshita T, Tsuneishi M, Akagi T, Yamashita F 20.
et al. Fluoride intake from food and drink in Japanese children aged 1-6 years. Caries Res 2001; 35:47-49.
Guha-Chowdhury N, Drummond BK, Smillie AC. Total fluoride 21.
intake in children aged 3 to 4 years- a longitudinal study. J Dent Res 1996; 75:1451-7.
Maguire A, Zohouri FV, Hindmarch PN, Hatts J, Moynihan PJ. Fluoride 22.
intake and urinary excretion in 6 to 7-years-old children living in optimally, sub-optimally and non-fluoridated areas. Community Dent Oral Epidemiol 2007; 35:479-88.
Haftenberger M, Viergutz G, Neumeister V, Hetzer G. Total fluoride 23.
intake and urinary excretion in German children aged 3-6 years. Caries Res 2001; 35;451-7.
Yevenes I, Campos B, Apip A, Espinoza RM, Jara MN, Smith LP. 24.