Article
Printed in Brazil - ©2012 Sociedade Brasileira de Química0103 - 5053 $6.00+0.00
A
*e-mail: [email protected]
Evaluation of Metal Ions in Rice Samples:
Extraction and Direct Determination by ICP OES
Andrea Oliveira,a Nivaldo Baccana,b and Solange Cadore*,a
aInstituto de Química, Universidade Estadual de Campinas, CP 6154, 13083-970 Campinas-SP, Brazil
bFaculdade de Paulínia, 13140-000 Paulínia-SP, Brazil
Foi desenvolvido um método de extração de íons de metais presentes em amostras de arroz, usando solução amoniacal de EDTA (ácido etilenodiamino tetraacético), pH ≥ 10, como agente extrator, sob as seguintes condições otimizadas: 0,20 g de amostra de arroz e 5,00 mL da solução amoniacal de EDTA, com 5 min de tempo de exposição em ultrassom. Usando condições robustas de ICP OES (espectrometria de emissão atômica por plasma acoplado indutivamente), foi possível analisar a solução extraída, obtendo-se valores de recuperação acima de 90% para a maioria dos elementos estudados (P, K, Mg, Ca, Zn, Mn, Cu e Mo) com RSD < 5%. Os resultados mostraram concordância com aqueles obtidos por extração assistida por microondas e para o material de referência certificado de farinha de arroz (NIST SRM 1568a). Os limites de detecção do método ficaram no intervalo de 0,007 mg kg-1 (Mn) - 48,68 mg kg-1 (K), mostrando uma detectabilidade
adequada para a determinação das espécies de interesse. A análise das diversas amostras indicou que o arroz brasileiro integral contém teores mais elevados dos constituintes estudados, seguido pelo arroz parboilizado e o arroz agulhinha.
A method for extraction of metal ions present in rice samples using ammoniacal EDTA solution, pH ≥ 10, as extractor agent is proposed under the following optimized conditions: 0.20 g of rice sample and 5.00 mL of ammoniacal EDTA (ethylenediaminetetraacetic acid) solution, with 5 min of ultrasound exposure time. Using robust ICP OES (inductively coupled plasma atomic emission spectrometry) conditions, direct analysis of the extraction solution was allowed, and the recovery values obtained were above 90% for most of the studied elements (P, K, Mg, Ca, Zn, Mn, Cu and Mo) with RSD < 5%. The results were in good agreement with those obtained by microwave-assisted extraction and for the reference material of rice flour (NIST SRM 1568a). The limits of detection of method were in the range of 0.007 mg kg-1 (Mn) - 48.68 mg kg-1 (K), showing adequate
detectability for the determination of the analytes. The analysis of different samples indicated that Brazilian “integral” rice contains higher contents of the constituents studied, followed by “parboiled” rice, and the “agulhinha” rice a long and thin grain type.
Keywords:rice samples, ethylenediaminetetraacetic acid, elemental determination, ICP OES
Introduction
Rice (Oryza sativa L.), actually represents one of the
most important foodstuffs in the world; it is the basic dietary product for more than a thousand millions of human beings. Approximately 90% of rice produced in all the world is cultivated and consumed at the Asia. However, the Latin America occupies the second place in production and the third place in relation of rice consumption. Within this context, Brazil is considered one of the biggest rice manufacturer, and its consumption is estimated about
74-76 kg per habitant per year.1 Despite of great national
consume, the knowledge about Brazilian rice nutritional composition, taking into account the identification of inorganic metals present in the rice samples, followed its quantification, is still deficient.
In order to improve the knowledge about Brazilian rice nutritional composition, in this study a simple treatment of sample was investigated, and the inorganic metals were determined by inductively coupled plasma atomic emission spectrometry (ICP OES).
extraction of inorganic and organic compounds, slurry
dispersion, homogenization and other applications.2 For
many sample treatment applications, the samples were sonicated in an acidic medium, employing single acids
(e.g., HCl, HNO3, HF), acid mixtures (e.g., HCl+HNO3,
HNO3+HF) or acid mixed with an oxidizing agent (e.g.,
H2O2). In these cases, the importance of having both acidic
medium as extractant and high intensity probe sonication
is pointed out by some authors.3,4 Although many sample
treatments employ an acidic medium, alkaline media have also led to the development of suitable sample preparation procedures, involving digestions, extractions or slurry formation before determination using spectroanalytical
techniques.5 Thus, the use of alkaline medium in the
sample treatment is a good alternative for some analytical tasks and provides fast and simple sample preparation approaches. Tetramethylammonium hydroxide (TMAH) is extensively used for this purpose, mainly for the digestion
of biological and botanical samples.6-9 TMAH associated
with ethylenediaminetetraacetic acid (EDTA) has also been studied for the alkaline digestion of botanical samples. The addition of EDTA improved the element recoveries in the digest supernatant, considering the excellent ability of this complexing agent to form complexes with many elements. In these alkaline procedures, the metal determination was generally performed by flame or electrothermal atomic
absorption spectrometry (FAAS, ETAAS)10 or ICP OES.11
Thus, in this work, an ammoniacal EDTA solution and an ultrasonic bath were employed in the sample treatment of food samples, being applied to different kind of Brazilian rice. The determination of several metallic species (P, K, Mg, Ca, Zn, Mn, Fe, Cu and Mo) in these rice samples was performed by ICP OES operating in robust plasma conditions, which facilitates the evaluation of the differences of nutritional composition between the rice species studied. The certified reference material of rice flour, NIST 1568a, was used to evaluate the accuracy of the proposed method.
Experimental
Instrumentation
For the total determination of elements, a microwave oven, model ETHOS 1 (Milestone, Sorisole, Italy), equipped with PTFE vessels was used for sample digestion.
The extractions of rice samples with EDTA solution were performed employing an ultrasound bath, Ultrasonic Cleaner (Unique, São Paulo, Brazil), model, USC 1400 operating at a frequency of 40 kHz and with ultrasound power of 120 W. The ultrasound exposure time of the samples was optimized at 5 min.
The analytical measurements were made with a simultaneous Perkin-Elmer ICP OES, model Optima 3000DV (Norwalk, CT, USA), equipped with a peristaltic pump, a crossflow nebulizer coupled to a Ryton double pass spray chamber (Scott type) and a ceramic central torch tube injector with an internal diameter of 2.0 mm. This instrument has a solid-state segmented array charge coupled device (SCD) detector and operates in radial and axial torch configurations. For the axial viewing mode, which was employed in this work, the cool plasma recombination
area was striped off with a shear gas interface (N2). The
entire system is controlled with PE Winlab software. All measurements were performed in triplicate for the best evaluation of precision and accuracy of the method. The operational spectrometer conditions are presented in Table 1.
Solutions and reagents
Pure argon (99.996%, White Martins, São Paulo,
Brazil) was used. Analytical solutions (1000 mg L-1 in
2% v/v HNO3, Merck, Darmstadt, Germany) of each
analyte were used to prepare multielemental calibration
standards in 0.10 mol L-1 ammoniacal EDTA medium.
All the glassware used was previously cleaned with diluted nitric acid (10% v/v) and rinsed with deionized
water (18.2 MΩ cm, Milli-Q Water Purification System -
Millipore, Bedford, USA).
The 0.10 mol L-1 of ammoniacal EDTA solution
(Aldrich) was prepared by the dissolution of ethylene-diaminetetraacetic acid EDTA, (29.225g) in 700 mL of deionized water. A 24% (v/v) ammonium hydroxide solution
was added in order to obtain a pH ca. 10 EDTA solution.
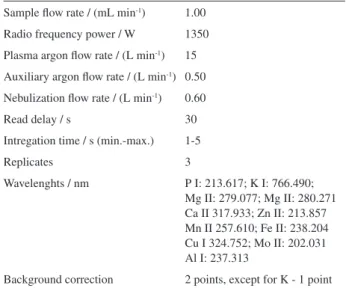
Table 1. Instrument operating conditions for the determination of metallic species in rice samples
Sample flow rate / (mL min-1) 1.00
Radio frequency power / W 1350
Plasma argon flow rate / (L min-1) 15
Auxiliary argon flow rate / (L min-1) 0.50
Nebulization flow rate / (L min-1) 0.60
Read delay / s 30
Intregation time / s (min.-max.) 1-5
Replicates 3
Wavelenghts / nm P I: 213.617; K I: 766.490; Mg II: 279.077; Mg II: 280.271 Ca II 317.933; Zn II: 213.857 Mn II 257.610; Fe II: 238.204 Cu I 324.752; Mo II: 202.031 Al I: 237.313
Then, the volume of the ammoniacal EDTA solution was filled to 1.00 L with deionized water. The EDTA ammoniacal solution were stored in polyethylene flasks and left under refrigeration at a temperature of about 4 ºC.
Samples
The rice samples correspond to three different kinds of Brazilian rice, being: “agulhinha” rice (AR), “parboiled” rice (PR) and “integral” rice (IR), all purchased in local supermarkets at Campinas City, São Paulo State, Brazil. These rice samples are slightly different, one from another, mainly due to their intrinsic properties such as genotype, as well as due to different treatments that were applied on the rice before packaging for sale.
Procedure
Determination of total content assisted by microwave radiation
The rice samples were first ground and then, digested in closed vessels in a microwave oven decomposition system according to the following procedure. Samples (0.25 g) were accurately weighed into a PTFE digestion
vessel and then 4 mL of 65% (v/v) HNO3, 1 mL 30% (v/v)
H2O2 and 3 mL of Milli-Q water were added. The closed
vessels were placed inside the microwave oven and the decomposition was carried out according to the program shown in Table 2. After that, the digests were left to cool and then the volumes were made up to 25 mL with Milli-Q water, followed by the quantifications of these elements by ICP OES.
Optimization of experimental extraction conditions for metals in rice samples
A 23 factorial design, with central point, resulting in 27
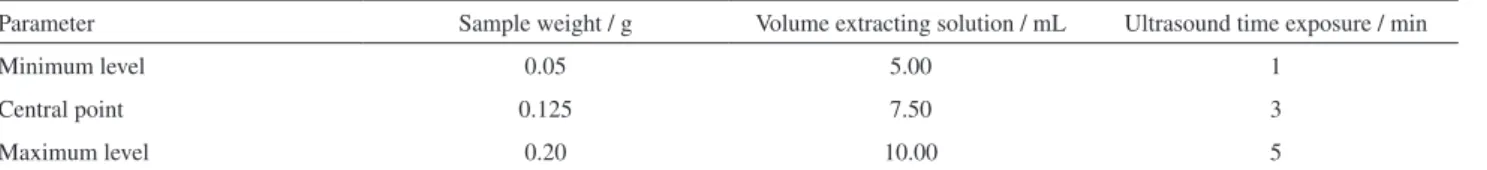
experiments was done in order to find the best experimental conditions for the extraction of metallic species from the rice samples. For this purpose, the software employed was Statgraphics Plus 3.0, and the variables studied were: sample weight, volume of ammoniacal EDTA solution and time of ultrasound sample exposure, as described in Table 3. Further, the best extraction condition was applied in the reference material, NIST 1568a, for optimization of
the instrumental parameters of ICP OES and also in the commercial rice samples.
Extraction of elements with ammoniacal EDTA solution
According to the 23 factorial design, portions of
rice samples ground were accurately weighed into polypropylene centrifuge tubes (50 mL volume) and
different volumes of 0.10 mol L-1 ammoniacal EDTA
extractant solution were added. Then, the samples were sonicated at room temperature for different times at a frequency of 40 kHz and with ultrasound power of 120 W. After sonication, the samples were centrifuged for 10 min at 3600 rpm, and the supernatants were separated from insoluble residues and taken for analysis.
Optimization of instrumental conditions for extraction of metallic species in rice samples
For the study of robust plasma conditions, the
ammoniacal EDTA solution was spiked with 5.00 mg L-1
of Mg standard solution and analyzed at different
nebulization gas flow rates, (from 0.20 to 1.00 L min-1), and
plasma power (from 1500 to 1000 W). These parameters were analyzed separately and the selected instrumental conditions are shown in Table 1. Plasma robustness was calculated by dividing the Mg II by Mg I ammoniacal
EDTA solution emission intensities.12 Using the optimized
operational conditions, that are, plasma power of 1350 W
and 0.60 L min-1 of nebulization flow rate, analysis of the
certified reference material was carried out. The use of this certified material allowed the evaluation of matrix and spectral interferences, as well as to choose adequate wavelengths for the studied elements by optimizing the proposed method, leading to more accurate results. Table 2. Microwave oven program for the decomposition of rice samples
Step time / min Power / W Temperature / ºC
1 6 1000 80
2 2 1000 80
3 3 1000 120
4 2 1000 120
5 10 1000 180
6 10 1000 180
Table 3. Values of the variables employed in the 23 factorial design
Parameter Sample weight / g Volume extracting solution / mL Ultrasound time exposure / min
Minimum level 0.05 5.00 1
Central point 0.125 7.50 3
Results and Discussion
The plasma robustness optimization
The optimization of the instrumental parameters in order to obtain a robust plasma has been studied by
other researchers.12-14 The Mg II/Mg I ratio is a practical
criterion to evaluate plasma robustness. The term robustness indicates how efficient is the energy transfer and the plasma response to change in atomization and excitation conditions
due to the chemical composition of the aspirated sample.12
The robust conditions are effective to reduce matrix effects, mainly the interference caused by easily ionized elements,
such as, Na, K and Ca and also organic matter.15 Thus, to
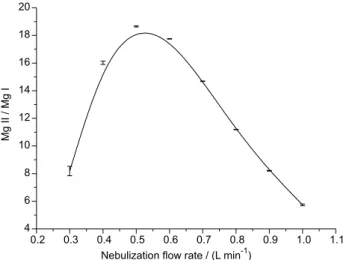
evaluate the plasma performance, experiments were carried out by applying a radio-frequency power of 1300 W, and afterwards by adjusting the nebulizer gas flow rate in order to reach the highest MgII/MgI ratio, as observed in Figure 1. The robustness was calculated by dividing the emission of the ionic line of Mg II (280.270 nm) by the
atomic line of Mg I (285.213 nm).12 A MgII/MgI ratio ≥ 10
indicates that the plasma is operating in robust conditions.
As can be seen in Figure 1, when 0.50 and 0.60 L min-1
nebulization flow rates were applied, the highest values
for the MgII/MgI ratio were reached. At a 0.50 L min-1
nebulization flow rate, the value obtained for the MgII/MgI ratio was 18.65, and the relative standard
deviation (RSD) ca. 4%. When the 0.60 L min-1 of
nebulization flow rate was applied, the MgII/MgI ratio was 17.75 and RSD obtained in this condition was RSD < 2%. In this case, both nebulization flow rates are adequate for working under robust conditions, however,
the value of 0.60 L min-1 was chosen, taking into account
the lower values obtained for RSD. Furthermore, spectral interferences as well as matrix effects should be considered: organic matter or other concomitants can be co-extracted together with the metallic species of interest in the ammoniacal EDTA medium. This justifies the option for robust plasma in conditions of the lowest possible values of RSD in order to reduce such undesirable effects. In relation to plasma power, studies were also carried out varying it over the range from 1000 to 1500 W in order to choose the
power that presents a MgII/MgI ratio ≥ 10.
Figure 2 shows that throughout the range of plasma power applied (from 1000 to1500 W), the MgII/MgI ratios obtained are higher than 10, and the respective values of RSD < 3%. However, for power values below 1200 W, such as 1100 and 1000 W, the plasma generated was not stable. In fact, with these values of power the plasma extinguished when the nebulized sample was introduced into the plasma generated under these conditions, not being possible to quantify the analyte. Further, even if the plasma is not extinguished, in this case using 1200 W of applied power, the data repeatability
is prejudiced, and values of RSD ≥ 10% were obtained.
This happens possibly due to matrix interference, taking into account that the sample is directly introduced into the plasma. Then, the instrumental operational conditions were
established as 1350 W of plasma power and 0.60 L min-1 of
nebulization flow rate, and the determination of elements extracted by the ammoniacal EDTA solution obtained with different experimental conditions were tested.
The use of ammoniacal EDTA solution as extractor agent
The use of EDTA as an extracting agent for metals
has been reported by some researchers.7-9 It is well known
that the addition of EDTA improves element recoveries in Figure 1. Effect of nebulization flow rate on the Mg II/Mg I ratio for
ammoniacal EDTA solution. Operational conditions: power of 300 W and auxiliary gas flow 0.50 L min-1.
the digest supernatant, considering the excellent ability of this reagent to form complexes with many elements. The
values of formation constant (Kf) for metal-EDTA are
favorable for the most elements studied, such as [K-EDTA]
6.3; [Mg-EDTA] 4.9 × 10⁸; [Ca-EDTA] 4.9 × 10¹⁰;
[Zn-EDTA] 3.2 × 10¹⁶; [Mn-EDTA] 7.4 × 10¹³; [Fe(III)-EDTA]
1.3 × 1025; [Cu-EDTA] 6.3 × 10¹⁸ and [Al-EDTA] 2.0 × 10¹⁶,
respectively.16 Uchida et al.8 recommended the use of the
EDTA diammonium salt, but this form was unavailable from the major chemical supplies. EDTA disodium salt
and EDTA as acid were readily obtained. Filgueiras et al.7
employed the ammoniacal EDTA solution at pH > 10 for metal complexation in plant tissues and observed remarkable increases in metal solubilization efficiencies. EDTA form is very difficult to dissolve in water, but easily soluble in an ammoniacal solution. In this study,
a 0.10 mol L-1 ammoniacal EDTA solution at pH > 10
was employed, considering at this pH, the bonding sites of EDTA are totally free to form complexes with metals. Moreover, in this ammoniacal EDTA medium (pH > 10),
the competition of H+ ions for bonding sites of EDTA is
reduced, allowing an effective complexation of analytes.
The conditional formation constants (Kf´) for metal-EDTA
at pH ca. 10 were calculated for most metallic species
studied, and considering that the value of α
Y4− = 0.36 at
pH 10 then, Kf´ can be estimated, being Kf´ = αY4−× Kf. The
values obtained for the metal elements studied at pH 10
were: [K-EDTA] 2.3; [Mg-EDTA] 1.8 × 10⁸; [Ca-EDTA]
1.8 × 10¹⁰; [Zn-EDTA] 1.2 × 10¹⁶; [Mn-EDTA] 2.7 × 10¹³;
[Fe(III)-EDTA] 4.7 × 1024; [Cd-EDTA] 1.0 × 10¹⁶;
[Cu-EDTA] 2.3 × 10¹⁸ and [Al-EDTA] 7.2 × 10¹⁵, being
slightly different from the formation constants mentioned above since they are pH dependent. However the values
of the conditional constants obtained at pH ≥ 10 indicate
that metal-EDTA complexation is still favorable for the effective extraction of metals.
Optimization of extracting conditions for metals in rice samples
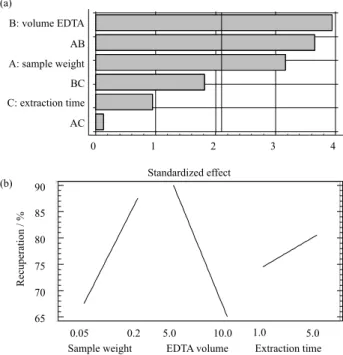
Considering the factorial design, a total of 27 experiments were done to establish the conditions for metal extraction. The best recovery percent values for most of the metallic species investigated were obtained under the following conditions (the compromise condition): 0.20 g of sample, 5.00 mL of ammoniacal EDTA solution and 5 min of ultrasound exposure, as verified in Figures 3a and 3b.
Figure 3a shows that at 95% confidence level, the EDTA volume (B), the sample weight (A) and the interaction between these variables (AB) are significant and, as verified in Figure 3b, the higher sample weight and extracting time
with lower EDTA volume provide adequate extracting conditions to reach the best recovery for most of the metallic species, except for Fe and Al. The results obtained for the analyte concentrations in the certified reference material, NIST 1568a, employing extraction with ammoniacal EDTA solution is shown in Table 4.
The lower recovery obtained in this work for Fe has
already been observed by Zhou et al.9 and by Filgueiras et al.7
and can be associated to the fact that both Fe and Al elements Figure 3. (a) Pareto plot for variables: (A) sample weight; (B) EDTA volume; (C) extraction time for optimization of metal extraction conditions. (b) Variable main effect plot, optimized extracting condition: (A) sample weight: 0.20 g; (B) EDTA volume: 5.00 mL; (C) extraction time: 5 min.
Table 4. Concentrations and recovery values (in %), for the analysis of the certified reference material, NIST 1568a rice flour, using the extraction conditions employed (n = 3, ± standard deviation). Instrumental conditions: plasma power: 1350 W, nebulization gas flow rate of 0.60 L min-1, auxiliary gas flow of 0.50 L min-1
Element Certified value Found value Recovery / %
P 0.153 ± 0.008% 0.111 ± 0.009% 72.7 ± 0.6
K 0.128 ± 0.0008% 0.125 ± 0.006% 97.4 ± 4.3
Mg 0.056 ± 0.002% 0.054 ± 0.0006% 97.0 ± 1.1
Ca 0.012 ± 0.0006% 0.011 ± 0.0002% 91.1 ± 2.1 Zn 19.4 ± 0.5 mg kg -1 18.5 ± 0.8 mg kg -1 95.3 ± 4.4
Fe 7.4 ± 0.9 mg kg -1 1.8 ± 0.09 mg kg -1 23.9 ± 1.3
Mn 20.0 ± 1.6 mg kg -1 19.1 ± 0.7 mg kg -1 95.6 ± 3.5
Cu 2.4 ± 0.3 mg kg -1 2.3 ± 0.03 mg kg -1 96.8 ± 1.4
Mo 1.46 ± 0.08 mg kg -1 1.41 ± 0.02 mg kg -1 96.6 ± 1.4
in presence of excess hydroxyl ions form the Fe(OH)3 and
Al(OH)3 compounds, not dissolving in excess of ions OH
−
,
remaining in the insoluble fraction.17 Additionally, the
lower recovery can also be associated to the fact that Fe to proteins bond of the matrix produces a stable form, such as ferritin, considered crucial for Fe homeostasis. It consists of a multimeric spherical protein that is able to store up to 4,500 Fe atoms inside its central cavity in a non-toxic and bioavailable form, probably not being disturbed by this
extraction procedure.18,19 In fact, the chemistry of Fe is more
complex, as reviewed by Theil and Briat,20 which discuss
plant ferritin that is one of the many dietary non-heme iron source in human nutrition. It is important to note that in all extracting experiments performed, a lower recovery for Fe was observed. In the case of aluminum, the extracting conditions established were not satisfactory considering its recovery. However, when the following extracting condition was used: 0.05 g of sample and 10 mL of ammoniacal EDTA solution; the recovery for Al was satisfactory (102.1 ± 2.7%), independent of ultrasound sample exposure time. For other elements studied, the recovery values were satisfactory. In general, the range of values obtained was about 91-97%, except for P.
Figures of merit
The limits of detection (LOD) and quantification
(LOQ) were calculated as described by Thomsen et al.:21
LOD = (3 × RSD × BEC)/100, and considering that the LOQ = (10 × RSD × BEC)/100. In these expressions, RSD corresponds to the relative standard deviation for 10 measurements of the blank and BEC corresponds to the background equivalent concentration, which was experimentally determined under the optimized conditions. The calculated values for LOD and LOQ in
mg L-1 (instrumental figures of merit) were converted in
mg kg-1 (figures of merit of the proposed method) considering
the sample dilution used,and are presented in Table 5.
Considering the values presented in Table 5 and the range of concentration of the analytes present in rice samples, for macro-constituents P (0.06-0.2%), K (0.04-0.1%), Mg (0.01-0.1%), Ca (0.003-0.007%),
and for micro-constituents Zn (7.3-14 mg kg-1), Mn
(4.6-17 mg kg-1) and Cu (ca. 2.0 mg kg-1), it is possible to
note that the proposed method has adequate detectability for the determination of these elements in rice samples.
Analysis of rice samples
The analysis of three different kinds of rice samples was carried out and the concentrations obtained are presented in
Table 6. The microwave-assisted digestion in closed vessels was used for comparison, and the values of concentration for the elements are reported.
As can be observed in Table 6, the values of concentration found for most of the elements are in agreement when comparing both sample treatment procedures employed, except for Fe. With microwave digestion, the recoveries for Fe in the samples of rice are higher than the values obtained with the EDTA extraction. Mo was not detected in these samples, probably because their concentrations are lower than LOD. The results obtained indicated that “integral” rice contains the highest content of the elements studied possibly due to the way this rice was manufactured. Thus, as can be observed, the proposed method is suitable for the determination of some inorganic elements present in rice. It is not necessary a laborious sample pretreatment, when compared to the acidic digestion, being commonly used for total determination of inorganic elements in food. Further, the direct introduction of the sample is also advantageous and, associated with robust plasma condition, the method is an efficient and fast analytical technique for detection of these analytes. Due to relative simplicity of the proposed method, it can be applied in routine analyses. In this kind of analysis, the reliable, simplicity and effectiveness are taking into account due to higher number of sample analyzed in a short time is required. Comparing the results from the proposed method and those obtained with acidic digestion, very close values were observed for the most of elements analyzed, except for the Fe, once this element is intrinsically bounded with the matrix. In this case, the ammoniacal EDTA solution is not an efficient extractor agent, such as acidic digestion.
Table 5. Limits of detection (LOD) and quantification (LOQ) of method for the determination of metallic species in rice samples in ammoniacal EDTA solution
Metallic species (λ / nm) LOD / (mg kg -1) LOQ / (mg kg -1)
P I 213.617 1.68 5.60
K I 766.490 48.68 162.25
Mg II 279.077 0.13 0.42
Ca II 317.933 0.04 0.14
Fe II 238.204 0.03 0.09
Zn I 213.857 0.05 0.18
Mn II 257.610 0.007 0.02
Cu I 324.752 0.06 0.20
Mo II 202.031 0.14 0.46
Conclusions
The study of extraction conditions employing ammoniacal EDTA solution associated with ultrasound gave satisfactory results for most of elements studied in three different types of rice samples. In this study, the capacity of EDTA to form complexes with the metals present in the rice samples was evaluated without need for complete digestion of the sample. The plasma operating in a robust condition was efficient, contributing to an effective control of the nutritional composition of different types of rice. The elements present in the rice samples can be monitored by this method to
evaluate both the essentiality and toxicity of these elements, considering human health. For this purpose, the ease of direct introduction of the sample to the ICP OES equipment is an advantage in comparison to acidic digestion methods.
Acknowledgments
The authors are grateful to Conselho Nacional de Desenvolvimento Científico e Tecnológico (CNPq), Fundação de Amparo à Pesquisa do Estado de São Paulo (FAPESP) and Instituto Nacional de Ciências e Tecnologias Analíticas Avançadas (INCTAA) for financial support. The authors would also like to thank Prof. Dr. Carol Collins for her assistance with the English language.
References
1. Embrapa Clima Temperado; Sistemas de Produção 3, Pelotas, RS, Brasil, 2005, http://sistemasdeproducao.cnptia.embrapa.br accessed in October 2011.
2. Nascentes, C. C.; Korn, M.; Sousa, C. S.; Arruda, M. A. Z.; J. Braz. Chem. Soc. 2001, 12, 57.
3. Silva, R. G. L.; Willie, S. N.; Sturgeon, R. E.; Santelli, R. E.; Sella, S. M.; Analyst1999, 124, 1843.
4. Pontes, F. V. M.; Mendes, B. A. D.; de Souza, E. M. F.; da Silva, L. I. D.; Carneiro, M. C.; Monteiro, M. I. C.; de Almeida, M. D.; Neto, A. A.; Vaitsman, D. S.; Anal. Chim. Acta2010, 659, 55. 5. Nóbrega, J. A.; Santos, M. C.; Sousa, R. A.; Cadore, S.; Barnes,
R. M.; Tatro, M.; Spectrochim. Acta, Part B2006, 61, 465. 6. Costa, L. M.; Gouveia, S. T.; Nóbrega, J. A.; Anal. Sci. 2002,
18, 313.
7. Filgueiras, A. V.; Lavilla, I.; Bendicho, C.; Fresen. J. Anal. Chem. 2001, 369, 451.
8. Uchida, T.; Isoyama, H.; Yamada, K.; Oguchi, K.; Nakagawa, G.; Anal. Chim. Acta1992, 256, 277.
9. Zhou, C. Y.; Wong, M. K.; Koh, L. L.; Wee, Y. C.; Talanta 1996, 43, 1061.
10. da Silva, J. B. B.; Borges, D. L. G.; Andreia, M.; da Veiga, M. S.; Curtius, A. J.; Welz, B.; Talanta2003, 60, 977.
11. Ribeiro, A. S.; Moretto, A. L.; Arruda, M. A. Z.; Cadore, S.; Mikrochim. Acta2003, 141, 149.
12. Mermet, J. M.; Anal. Chim. Acta1991, 250, 85.
13. Silva, F. V.; Trevizan, L. C.; Silva, C. S.; Nogueira, A. R. A.; Nóbrega, J. A.; Spectrochim. Acta, Part B2002, 57, 1905. 14. Silva, J. C. J.; Santos, D. M.; Cadore, S.; Nóbrega, J. A.;
Baccan, N.; Microchem. J.2004, 77, 185.
15. Brenner, I. B.; Zander, A.; Cole, M.; Wiseman, A.; J. Anal. At. Spectrom.1997, 12, 897.
16. Skoog, D. A.; West, D. M.; Holler, F. J.; Fundamentals of Analytical Chemistry, 7th ed.; Saunders College Publishing: New York, 1996.
Table 6. Concentrations obtained for solubilization of inorganic species from rice samples employing microwave-assisted digestion and ammoniacal EDTA solution with ultrasound (n = 3, ± standard deviation) Element Microwave
digestion
EDTA (ultrasound bath)
Difference / %
“Agulhinha” Rice
P 0.064 ± 0.004% 0.058 ± 0.002% −9.4 K 0.039 ± 0.003% 0.039 ± 0.001% 0.0 Mg 0.013 ± 0.001% 0.014 ± 0.00% +7.7 Ca 0.005 ± 0.0001% 0.005 ± 0.0001% 0.0 Fe 2.8 ± 0.06 mg kg-1 0.6 ± 0.07 mg kg-1 −78.6 Zn 12.3 ± 0.6 mg kg-1 11.4 ± 0.6 mg kg-1 −7.3 Mn 14.5 ± 0.3 mg kg-1 13.7 ± 0.6 mg kg-1 −5.5 Cu 2.7 ± 0.09 mg kg-1 2.7 ± 0.08 mg kg-1 0.0 Mo < 0.14 < 0.14
“Parboiled” Rice
P 0.138 ± 0.004% 0.120 ± 0.005% −13 K 0.116 ± 0.005% 0.121 ± 0.004% +4.3 Mg 0.034 ± 0.002% 0.031 ± 0.002% −8.8 Ca 0.003 ± 0.0002% 0.003 ± 0.0001% 0.0 Fe 8.4 ± 0.7 mg kg-1 1.8 ± 0.03 mg kg-1 −78.6 Zn 7.8 ± 0.3 mg kg-1 7.3 ± 0.5 mg kg-1 −6.4 Mn 5.0 ± 0.2 mg kg-1 4.6 ± 0.3 mg kg-1 −8.0 Cu 2.2 ± 0.08 mg kg-1 2.5 ± 0.03 mg kg-1 +13.6 Mo < 0.14 < 0.14
“Integral” Rice
17. Lee, J. D.; Química Inorgânica não tão Concisa, 4a ed., Edgar Blücher: Rio de Janeiro, RJ, Brasil, 1991.
18. Silveira, V. C.; Fadanelli, C.; Sperotto, R. A.; Stein, R. J.; Basso, L. A.; Santos, D. S.; Vaz Junior, I. S.; Dias, J. F.; Fett, J. P.; Sci. Agric. 2009, 66, 549.
19. Theil, E. C.; Matzapetakis, M.; Liu, X.; J. Biol. Inorg. Chem.
2006, 11, 803.
20. Theil, E. C.; Briat, J. F.; Int. Food Pol. Res. Inst. Int. Cent. Trop. Agric. 2004. 1-13.
21. Thomsen, V.; Roberts, G.; Burgess, K.; Spectroscopy2000, 15, 33.
Submitted: September 24, 2011
Published online: April 3, 2012