Article
Printed in Brazil - ©2012 Sociedade Brasileira de Química0103 - 5053 $6.00+0.00
A
*e-mail: [email protected]
Support Effect on Carbon Nanotube Growth by
Methane Chemical Vapor Deposition on Cobalt Catalysts
Hugo A. Oliveira,a Dante F. Franceschinib and Fabio B. Passos*,a
aDepartamento de Engenharia Química e Petróleo, Universidade Federal Fluminense,
Rua Passos da Pátria, 156, 24210-040 Niterói-RJ, Brazil
bInstituto de Física, Universidade Federal Fluminense,
Av. Milton Tavares de Souza s/n, 24210-341 Niterói-RJ, Brazil
A influência do suporte na produção de nanotubos de carbono por deposição química a vapor (CVD) de metano sobre catalisadores de cobalto foi investigada. As técnicas de fisissorção de N2, difratometria de raios X (XRD), redução à temperatura programada (TPR) e quimissorções de H2 e CO foram usadas na caracterização dos catalisadores de cobalto suportados em diferentes óxidos (Al2O3, SiO2, Nb2O5 e TiO2). As técnicas de espectroscopia Raman, oxidação a temperatura programada (TPO) e microscopia eletrônica de varredura (SEM) foram utilizadas na caracterização e quantificação de espécies de carbono produzidas. No crescimento dos nanotubos, o catalisador produziu três espécies principais de carbono: carbono amorfo, nanotubos de carbono de parede única (SWNT) e nanotubos de carbono de parede múltiplas (MWNT). Técnicas de caracterização mostraram que a seletividade catalítica a cada tipo de nanotubo depende da distribuição do tamanho de partículas de cobalto, a qual depende das propriedades texturais do suporte. O catalisador Co/TiO2 apresentou alta seletividade para a produção de nanotubos de parede única. Esta alta seletividade se deve a uma distribuição estreita do tamanho de partículas de cobalto sobre TiO2.
The influence of the support on carbon nanotube production by methane chemical vapor deposition (CVD) on cobalt catalysts was investigated. N2 physisorption, X-ray diffractometry (XRD), temperature programmed reduction (TPR) and H2 and CO chemisorption techniques were used to characterize the structure of cobalt catalysts supported on different metal oxides (Al2O3, SiO2, Nb2O5 and TiO2). Raman spectroscopy, temperature programmed oxidation (TPO) and scanning electron microscopy (SEM) were used for the characterization and quantification of produced carbon species. On carbon nanotube growth, the catalyst produced three main carbon species: amorphous carbon, single walled carbon nanotubes (SWNT) and multi walled carbon nanotubes (MWNT). The characterization techniques showed that the catalyst selectivity to each kind of nanotube depended on the cobalt particle size distribution, which was influenced by the textural properties of the support. Co/TiO2 showed the highest selectivity towards single wall nanotube formation. This high selectivity results from the narrow size distribution of cobalt particles on TiO2.
Keywords: carbon nanotubes, cobalt, catalyst support, chemical vapor deposition, methane
Introduction
In the last fifteen years, the research on carbon nanotube (CNT) production by chemical vapor deposition (CVD) has attracted great attention due to its easy setup and scale-up for mass production.1 A large number of researchers
have studied different operational conditions and catalyst
formulations for CNT production.1-7 However, these
operational conditions and catalysts formulations are not well established. Carbon nanotubes synthesis groups8-12 are
still developing new catalyst formulations for improving CNT production.
On catalytic carbon nanotube production, it is well-known that the support plays an important role in the dispersion and catalytic activity of the metal present on it.13
of the catalyst, support and metal particle is needed to understand its effects on CNT production.
The present work reports a study on the support influence (Al2O3, SiO2, TiO2 and Nb2O5) on CNT
production by methane CVD on 4 wt.% cobalt catalysts. The studied catalysts were characterized
by X-ray diffractometry (XRD), N2 physisorption,
temperature programmed reduction (TPR) and H2 and
CO chemisorptions. For the carbon species obtained by methane CVD, it was used the following characterization techniques: Raman spectroscopy (which is an effective technique for characterizing the structure of single walled
carbon nanotubes (SWNT))3,14 temperature programmed
oxidation (TPO) (which can quantify the amount of amorphous carbon, SWNT and multi walled carbon
nanotubes (MWNT) present on a sample)15 and scanning
electron microscopy (SEM) (which has been used to investigate the CNT morphologies). In addition, it was studied the methane decomposition on these catalysts, first step on the CNT mechanism growth. The obtained results allowed identifying how the metal and support influenced the carbon nanotube formation.
Experimental
Catalyst preparation
Four different supports were studied in this work: Al2O3
(Catapal-A Bohemite, Hamburg, Germany) SiO2 (Davicat
SP 550-10022, Worms, Germany), TiO2 (Degussa P25,
Hanau-Wolfgang, Germany) and Nb2O5 (niobic acid,
HY 340 CBMM, Araxá, Brazil). The supports were dried in air at 393 K for 16 h and then heated in air at a heating rate of 10 K min-1 up to 773 K and kept at the final temperature
for 2 h.
A set of 4 wt.% Co catalysts was prepared by incipient wetness impregnation using a solution of Co(NO3)2.6H2O
(Merck, Darmstadt, Germany). After impregnation, the catalysts were dried in air at 393 K for 16 h and then calcined in air for 2 h at 773 K.
Catalyst characterization
X-ray diffractometry (XRD) experiments of the calcined samples were performed in a Rigaku Miniflex
diffractrometer using monochromatic Cu-Kα (1.540 Å)
radiation with a scan rate of 0.05 degree min-1.
Measurements of BET specific surface area, pore volume and pore diameter distribution were performed in an ASAP 2010 Micromeritics apparatus by N2 adsorption.
The samples were evacuated at 493 K during 4 hours before
analysis. Pore volume and pore diameter distribution were calculated from the N2 desorption curve using the
Barrett-Joyner-Halenda (BJH) method.
Temperature programmed reduction (TPR) experiments were performed in a U-shaped tubular quartz reactor coupled to a quadrupole mass spectrometer (Omnistar, Balzers). The catalysts (0.5 g) were dried in He for 30 min at 473 K before TPR analysis. After cooling to room
temperature, a mixture of 5% H2/Ar flowed through the
catalyst (30 sccm) and the temperature was raised at a heating rate of 10 K min-1 up to 1273 K.
H2 and CO chemisorptions were performed using
a volumetric method in a Micromeritcs ASAP 2010C device. The pretreatment of the catalysts consisted of drying at 493 K for 30 min under a 30 sccm of He flow before the reduction. After cooling to room temperature, the catalysts (0.5 g) were reduced under 30 sccm of H2, and the temperature was raised at a heating rate of
10 K min-1 up to 973 K, the same reduction temperature
used in the catalytic runs. The reduced catalysts were outgassed under vacuum at 973 K before cooling to 423 K,
where the H2 chemisorption measurements (activated
chemisorption)16 were performed. Then, the catalysts were
evacuated at 773 K, and finally the CO chemisorption measurements were performed at 308 K. Both total and reversible isotherms were measured at the pressure range
of 10-300 mmHg. The amount of H2 and CO adsorbed in
each measurement was determined by extrapolating the linear part of the isotherm to zero pressure. It is assumed
that the adsorption stoichiometries for H2 and CO are
H:Co = 1 and CO:Co = 1, respectively. The Co particle size (dp) was calculated supposing the Co particles are
spherical. For H2 chemisorption, these calculations were
performed assuming total chemisorption as recommended
by Bartholomew.17
Methane conversion
Catalytic activity was investigated CH4 pulsing over the
catalysts (0.1 g) packed in a quartz reactor attached to a mass spectrometer (Omnistar, Balzers). After the reduction
from room temperature to 973 K at a rate of 10 K min-1
under H2 flow (30 sccm), the catalysts were purged with
He flow (30 sccm) for 15 min before starting the pulses. During CH4 pulses, there was a constant He flow through
the reactor, and the CH4 was flushed with carrier gas.
The time interval between the first and the second pulse was 8 min (4 min for loading the pulse and 4 min for the injection of the pulse) and, thereafter, 6 min between pulses. Each pulse enclosed 0.5 ml of CH4 at 393 K. The methane
(1)
where ABlank is the area monitored by a mass spectrometer
corresponding to the total amount of methane injected in each pulse (without reaction) and AReactor is the area
monitored by a mass spectrometer corresponding to methane left after the reaction step.
CNT production
For the CNT production by the CVD method, 1.0 g of catalyst was put into a quartz boat and then placed in a horizontal tubular quartz reactor. The catalyst was heated in 200 sccm under H2 flow from room temperature to reduction
temperature (973 K) at a heating rate of 10 K min-1. Then,
H2 flow was switched to CH4 flow (200 sccm) for 30 min.
Finally, the sample was cooled to room temperature under Ar flow (200 sccm).
CNT characterization
Raman spectroscopy was used for the characterization of unpurified carbon deposits. Raman spectra were taken in a Jobin-Yvon Raman spectrometer with a 532 nm laser excitation.
Temperature programmed oxidation (TPO) experiments were performed in the same apparatus described for TPR experiments. The samples (0.2 g) were dried in He for 30 min at 473 K before TPO analysis. After sample cooling to room temperature, a 5% O2/He mixture flowed through
the catalyst at 30 sccm as temperature was raised at a heating rate of 10 K min-1 up to 1273 K.
CNT morphology was analyzed by scanning electron microscope (SEM) images. SEM images were performed on a Jeol Mod. JSM-5800 LV with electron beam energy in the 10-30 kV range.
Results and Discussion
Characterization of the calcined catalysts
X-ray diffractometry (XRD)
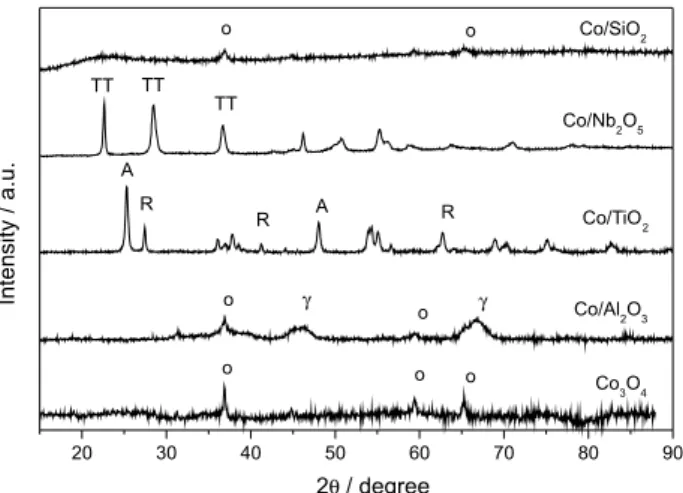
Figure 1 shows the XRD patterns taken from the Co3O4
reference sample and from the calcined catalysts. For the Co/SiO2 catalyst, there is a relatively broad peak at
2θ = 22° characteristic of amorphous silica and another two peaks at 2θ = 37° and 2θ = 65°, which are related to the presence of crystalline Co3O4.3 For this catalyst, only
Co3O4 XRD peaks were observed, confirming that Co3O4
was the main crystalline phase. The average Co3O4 particle
size was calculated to be 18.5 nm from the two most
intense Co3O4 peaks (2θ = 37° and 2θ = 59°) using the
Scherrer equation and considering the sample broadening larger than the instrument broadening.18
The Co/Nb2O5 catalyst exhibited XRD peaks at
2θ = 23º, 28° and 37º, which are indicatives of the T- and TT-Nb2O5 phases.19 The Nb2O5 XRD pattern has a number
of lines that superimpose the Co3O4 XRD lines making
Co3O4 detection impractical.
For a 773 K calcination temperature, a phase composition of 30% anatase and 70% rutile phase TiO2 is
expected.20 However, the anatase XRD peaks (2θ = 25º and
2θ = 48º) were much stronger than the rutile peaks. So, the TiO2 supports may be mainly in the anatase phase. No
Co3O4 XRD peak was observed for this calcined catalyst
indicating that the cobalt particles were highly dispersed on this support.
The Co/Al2O3 catalysts exhibited XRD peaks at
2θ = 46º and 2θ = 68º, which are assigned to the γ-phase of the alumina,19 and peaks at 2θ = 37º and 2θ = 59º, which
are related to the presence of crystalline Co3O4. Using the
Scherrer equation,18 a Co
3O4 particle size equal to 16.8 nm
was determined.
N2 physisorption
Many authors have observed a correlation between the size of the catalyst particles and the CNT diameter.22-27 An
increase in specific surface area of the support can lead to a decrease in Co particle size.28 Among the studied supports,
SiO2 showed the highest specific surface area followed by
Al2O3, TiO2 and Nb2O5 (Table 1). Thus, Co/SiO2 catalyst
was expected to show the lower average Co particle size. However, the XRD analyses showed that Co3O4 particles
supported on alumina are smaller than those supported on silica.
According to Jeong et al.29 and Duesberg et al.,30 when the Co particles were mounted on a porous support, the diameter of the cobalt oxide can be limited by the pore size and, as a consequence, the resulting CNT and the
porous support must have about the same diameter.29,30
Figure 2 shows the pore size distribution for the supports. The Al2O3 and SiO2 supports presented narrow pore size
distributions, while Nb2O5 and TiO2 showed broader ones,
with a high fraction of large pores. Al2O3 displayed the
narrowest pore size distribution. This textural property explains the fact that cobalt particles supported on alumina are smaller than ones supported on silica.
The Co impregnation had no major effect on the pore size distributions of the supports, except for TiO2 (Figure 2).
The average pore diameter and pore volume of TiO2 reduced
by 18 and 19%, respectively (Table 1).
In addition to the specific surface area and the pore size distributions, the pore volume of the support may have an effect on the CNT production due to its function as a carbon trap.31 The specific surface area and the pore volume of
the catalysts increased in the same order (Nb2O5 < TiO2 <
Al2O3 < SiO2).
Temperature programmed reduction (TPR)
The TPR profiles of the catalysts are displayed in Figure 3a. The TPR profile of Co/Nb2O5 catalyst presented
two peaks. The first peak (at 678 K) may be attributed to the reduction of Co3O4 to CoO. The second peak (at 771 K) is
attributed to a parallel reduction of CoO formed from Co3O4
reduction (first peak) and of CoO in strong interaction with the support.32
The TPR profile of Co/TiO2 is analogous to the
Co/Nb2O5, suggesting similar reduction steps as found by
other authors.33
For Co/Al2O3, the reduction profile shows a small
shoulder at 631 K and two reduction peaks at 779 and 1019 K. The small shoulder and the first reduction peak are attributed to the reduction in two steps of Co3O4 particles,
Co3O4→ CoO → Co (Figure 3b). The third peak is associated
with the reduction of CoO linked to the support. The reduction of this species was shifted to higher temperatures. This shift can be explained due the stronger interaction between the support and CoO species. Storsæter et al.34
showed that strong interactions between the support and the smallest cobalt particles exist and increase with a higher dispersion of cobalt on the surface of the supports.
The reduction profile of Co/SiO2 shows two reduction
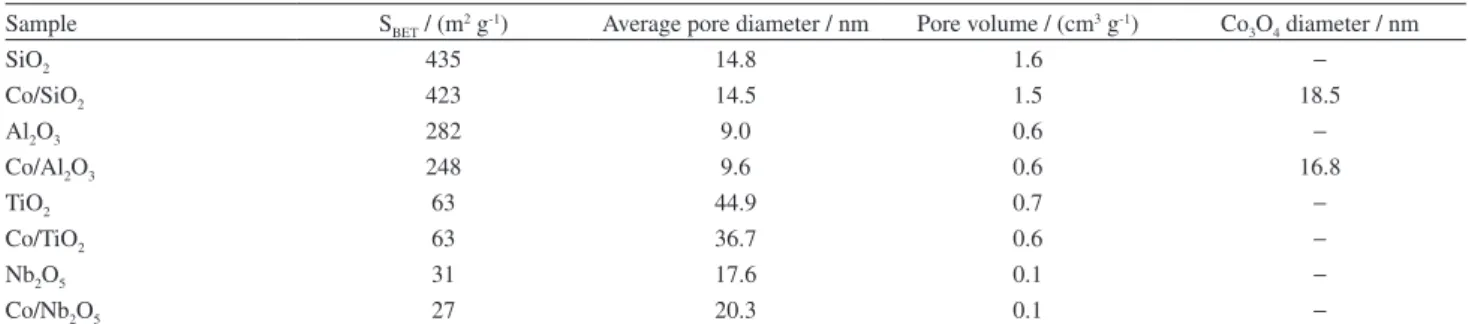
peaks and a shoulder around 958 K. The reduction peaks Table 1. Specific surface area, average pore diameter, pore volume and Co3O4 particle size of supports and catalysts
Sample SBET / (m2 g-1) Average pore diameter / nm Pore volume / (cm3 g-1) Co3O4 diameter / nm
SiO2 435 14.8 1.6 −
Co/SiO2 423 14.5 1.5 18.5
Al2O3 282 9.0 0.6 −
Co/Al2O3 248 9.6 0.6 16.8
TiO2 63 44.9 0.7 −
Co/TiO2 63 36.7 0.6 −
Nb2O5 31 17.6 0.1 −
Co/Nb2O5 27 20.3 0.1 −
SBET: specific surface area.
at 632 and 772 K appear at similar temperatures to the
reduction temperatures of the unsupported Co3O4.32
Therefore, these two peaks are attributed to the reduction in two steps of Co3O4 particles. The reduction at 948 K is
due to the reduction of CoO linked to silica.
The shift of the cobalt reduction peaks to higher temperatures demonstrates the intensity of the precursor/support interaction. Thus, these interactions are different in each support and this interaction is higher in Al2O3 than in the other supports. Storsæter et al.34 studied
cobalt supported on γ-Al2O3, TiO2 and SiO2. They found that
the precursor/support interaction increases in the following order: TiO2 < SiO2 < Al2O3.34 Cassell et al.35 also reported
that the interactions of the precursor catalysts with Al2O3
are stronger than with SiO2 because surface groups on Al2O3
have stronger Lewis acidities than those groups on SiO2.
Another important parameter obtained from the TPR is the degree of reduction of the cobalt oxide. However, different cobalt oxide species need different amounts of hydrogen to be reduced to the metallic form. Thus, to calculate the degree of reduction, it is necessary to know the cobalt species distribution in each catalyst. As several authors,32-37 we propose that in each catalyst two species
may exist, crystalline Co3O4 particles and CoO species. The
fraction of crystalline Co3O4 particles can be estimated from
the hydrogen consumption in the first TPR peak,32 which
corresponds to the reaction Co3O4 + H2→ 3CoO + H2O.
Table 2 demonstrates the fraction of cobalt present as crystalline Co3O4 particles and CoO species. The catalyst
with higher CoO species was Co/Al2O3 followed by
Co/SiO2, Co/Nb2O5 and Co/TiO2.
Many authors28,34,38 used the theoretical molar ratio
1.33 H2/Co (reduction of Co3O4 to Co) to calculate the degree
of reduction. In this case, the authors are assuming that all cobalt in unreduced catalyst is present as Co3O4 particles.
However, the TPR results show that is not true for our catalysts (Table 2). In our work, it was used a theoretical ratio H2/Co considering the fraction of Co3O4 and CoO in each
sample. For example, in Co/Al2O3, 8% of the cobalt present
in the catalyst is in the form of Co3O4, which requires a ratio
of 1.33 mol of H2 to reduce 1 mol of Co, and the other 92%
is in the form of CoO, which needs 1 mol of H2 to reduce
1 mol of Co. Thus, the H2/Co ratio needed to reduce Co/Al2O3
Figure 3. (a) TPR profiles of catalysts (Co/Al2O3, Co/Nb2O5, Co/TiO2 and Co/SiO2) and (b) Co/Al2O3 TPR profile. The reduction was conducted under 5% H2/Ar, using a heating rate of 10 K min-1.
Table 2. Distribution of cobalt species, H2/Co ratio and degree of reduction of catalysts obtained from TPR analysis. Total and irreversible H2 chemisorption, dispersion and particle sizes of catalysts obtained from chemisorption analysis
Catalyst
TPR analysis H2 chemisorption
Fraction of Co3O4
Fraction of Co2+
H2/Co ratio
Degree of reduction / %
H2 chemisorption /
(µmol gcat-1)* H/Co / % dp / nm
Total Irreversible
Co/Al2O3 0.08 0.92 1.0 31 7.2 3.1 6.8 14.7
Co/SiO2 0.50 0.50 1.2 100 6.1 0 1.8 55.2
Co/Nb2O5 0.59 0.41 1.2 82 0.3 0 − −
Co/TiO2 0.72 0.28 1.2 97 12.5 0 3.8 27.1
will be equal to 1.03. Therefore, each catalyst has a different theoretical H2/Co ratio as show in Table 2.
The degree of reduction after the TPR experiments was obtained from these theoretical ratio values. The reduction was close to 100% for catalysts supported on SiO2, Nb2O5 and TiO2, but it was quite low for the Al2O3
supported catalyst. This suggests an existence of irreducible species. Alumina supported cobalt catalysts have partial reducibility as cobalt aluminate species appears on the surface of support.39 Moreover, Ratnasamy and Knozinger41
found that a major fraction of Co in the oxide state is inside the alumina lattice and is not exposed to the gas phase.
For the catalysts supported on niobia and titania, in addition to the reduction of cobalt oxide species, a reduction of these supports was also expected when the temperature is higher than 773 K for niobia32 and higher than 573 K for
titania.41 Thus, TPR analyses of the supports were used to
verify this effect on the catalyst TPR profile. In this way, the degree of reduction of the catalysts was calculated taking into account the support reduction.
H2 chemisorption
Hydrogen chemisorption on the reduced catalyst was used to determine the dispersion and catalyst particle sizes. The results of hydrogen chemisorption for catalysts are shown in Table 2.
The total hydrogen chemisorption on the Nb2O5
supported catalyst was close to zero. This can be explained due to the migration of reduced species of the support to the metal surface, covering the metal and preventing it from hydrogen chemisorption. These results are consistent with those observed by Silva et al.28
The same effect was also expected for Co/TiO2.41
However, this catalyst showed the highest total hydrogen chemisorption among the studied catalysts and the TPR analysis of the support did not show significant reduction. These results indicate that the migration of reduced species
of the support to the surface of the metal in Co/TiO2
catalysts was not as prevalent as in the Co/Nb2O5 catalyst.
Co/Al2O3 was the only catalyst that presented significant
irreversible chemisorption (50% of the total hydrogen adsorption), indicating that the hydrogen was more strongly adsorbed on this catalyst as compared to the other catalysts. Chemisorption is one of the most typical methods for determination of reduced particle size and dispersion. A corrected dispersion and particle size can be calculated based on the degree of reduction.42 The degree of reduction
was obtained from TPR analysis (Table 2). The particle size results were calculated considering total hydrogen
chemisorption as recommended by Bartholomew17 and
are given in Table 2.
A high H2 chemisorption is a signature of a highly
reduced cobalt surface which is responsible for the methane decomposition. However, for CNT production, besides the high specific surface area, it is desired that the metals are in the nanometer range of sizes and are uniforms. As stated before, there is a correlation between the size of the metal nanoparticles and the CNT diameter.
Note that the total H2 chemisorption is similar for
both Co/Al2O3 and Co/SiO2, but the dispersion is very
different resulting in different particle sizes. Particle dispersion is a function of the degree of reduction and since all catalysts have the same cobalt loading (4 wt.%), the catalyst with a lower degree of reduction will result in higher dispersion and lower diameter size of the reduced cobalt particles. The particle size of the reduced cobalt supported in Nb2O5 could not be calculated due to the
coating of cobalt particles by the reduced species of the
support. The cobalt diameter in Co/TiO2 catalyst was
calculated considering that this effect was very small for this catalyst.
For CO chemisorption on Co supported catalysts,
Bartholomew17 recommended the use of irreversible
chemisorption to estimate the particle size. Among all studied catalysts, only Co/Al2O3 and Co/TiO2 catalysts
showed significant irreversible CO chemisorption, 11 and 6 µmol gcat-1, respectively.
Methane conversion
Figure 4a shows the methane conversion as a function of the number of pulses and Figure 4b shows the hydrogen signal obtained from the methane decomposition in each pulse as a function of the time.
Co/Al2O3 was more active than the other catalysts. It
is interesting that the same order of the support effect has been found for similar support series (alumina > silica >
magnesia) on methane decomposition for cobalt43 and
palladium44 catalysts. Co/Nb
2O5 catalyst showed very low
activity. This can be explained due to the covering of the cobalt surface by reduced species of the support.
The Co/SiO2 catalyst showed an increase in hydrogen
produced during the methane pulses (Figure 4b). This result indicates that there was a fraction of unreduced cobalt species after the reduction step, which was reduced in the presence of methane at high temperature.
Characterization of carbon nanotubes
Raman spectroscopy
of ordered carbon like graphite and carbon nanotubes, both having hybridized sp2 carbon system.5
The D band around 1350 cm-1 is associated with
defects or amorphous carbon, giving an indication of the amount of disordered carbon.14,45 Therefore, the ratio of
the D and G band intensities (D/G) is used as qualitative
measurement for the formation of undesired forms of carbon.46,47
Figure 5 shows the Raman spectra obtained from the carbon deposits formed on the catalysts. All samples showed D and G bands, except for the Co/Nb2O5 sample. This one
did not show G or D bands indicating that no significant amount of carbon was deposited on the catalyst. For the other samples, it can be observed that the intensities of the D and G bands in each sample are equivalents. These profiles are typical from MWNT. However, the D/G ratio and the width at a half height of the G peak are smaller for Co/TiO2 as
compared to Co/SiO2 and Co/Al2O3, indicating the presence
of tubes with lower walls. Table 3 summarizes these results.
The presence of the radial breathing mode (RBM)
between 140 and 350 cm-1 gives direct information
about the SWNT diameter. The SWNT diameter can be determined according to the expression d = (238 / λ)1.075
developed by Rols et al.,47 where d is the SWNT diameter
(in nm) and λ is the wavenumber (in cm-1).
The Co/Nb2O5 and Co/TiO2 samples showed peaks at
RBM range, but only the Co/Al2O3 sample is associated
Figure 4 (a) Methane conversion in function of the pulses and (b) hydrogen formed during the methane decomposition reaction in function of the time, the intensity of the signal was divided for the mass of catalyst used in each reaction. The reaction temperature was 973 K, and each pulse enclosed 0.5 ml of CH4 at 393 K.
Table 3. Raman spectroscopy and TPO data of the samples on the support. The diameter of SWNT and FWHM were obtained from Raman analysis. The carbon yield and the selectivity of the carbon deposits were calculated from TPO analysis
Catalyst
Raman analysis TPO analysis
SWNT FWHM / cm-1
(G)
D/G
intensity ratio Yield / %
Amorphous
carbon / % SWNT / % MWNT / %
v / cm-1 d / nm
Co/Al2O3 267 0.9 58 1.02 34.1 30.6 43 26.4
Co/Nb2O5 − − − − 0.5 − − −
Co/TiO2 − − 46 0.88 17 20 80 0
Co/SiO2 − − 56 0.92 3.7 1.2 35.4 63.4
FWHM: full-width at half maximum.
with the presence of SWNT. In the Co/Nb2O5 sample,
the peak at 168.5 cm-1 is due to the TT-Nb
2O5 crystalline
phase.48 In the same way, the peak at 146 cm-1 on Co/TiO 2
catalyst cannot be directly associated with the presence of SWNT, as this peak is associated with the presence of TiO2 rutile phase.49
From the RBM peak observed for the carbon deposits on Co/Al2O3, it was possible to evaluate the size of the SWNT
diameter. These results are show in Table 3.
In spite of all information that Raman spectroscopy can provide, a quantitative amount of the different types of carbon deposited on the catalysts cannot be obtained by this technique. For quantifying the amount of the different types of carbon present on the catalyst, a TPO analysis is necessary.3
Temperature programmed oxidation (TPO)
From the TPO results, it was possible to obtain a quantitative characterization of the different types of carbon present on the catalysts since they oxidize at different temperatures.3 Amorphous carbon is the first
species to be oxidized and SWNT are oxidized in a narrow temperature range, which occurs above the oxidation temperature of amorphous carbon and below the oxidation temperature of MWNT and graphite. The TPO profiles of the carbon species present on the catalysts are illustrated in Figure 6.
The TPO profiles of the carbon species present on Co/SiO2 catalyst clear showed this different oxidation
temperature of each species. The first peak at 479 K is associated with the oxidation of amorphous carbon, the second peak at 680 K is associated with oxidation of
SWNT and the third peak at 931 K is associated with
oxidation of MWNT or graphite.15
The Co/Al2O3 catalyst showed high evolution of CO2
on TPO analyses due its high activity in the methane
decomposition as previously demonstrated by the CH4
pulses. The CO2 peaks are very close to each other.
Therefore, the quantification of the carbon species was made by deconvolution of the TPO profile. The integrated areas under each peak represent the selectivity of each carbon species. The TPO profile of this sample demonstrates the low selectivity of the Co/Al2O3 catalyst due to the large
range of the oxidation temperatures, corresponding to different species (Table 3).
For the Co/Nb2O5 catalyst, only a small peak at 653 K
was observed. This peak may be associated with the oxidation of amorphous carbon since no CNT was observed in SEM images (Figure 7b).
The total carbon yield was defined as the mass of carbon deposited per mass of catalyst. The mass of carbon present in each sample was determined by the evolution of CO2.
There was always O2 in excess to avoid the formation of
carbon monoxide.
Co/Al2O3 presented the highest total yield (34.1%),
followed by Co/TiO2, Co/SiO2 and Co/Nb2O5, respectively.
Figure 7. SEM image of CNT sample prepared on (a) Co/Al2O3 catalyst and (b) Co/Nb2O5 catalyst. Sample was grown at 973 K under 200 sccm of CH4 for 30 min.
The most selective catalyst toward SWNT was Co/TiO2.
Approximately 80% of the carbon in this sample oxidized in the range of the SWNT oxidation.2,15,50
The oxidation reaction in TPO analyses may be catalyzed by the cobalt particles, shifting the peak position to lower temperatures.4 It explains the differences in the
temperature peaks observed for the same carbon species in different catalysts. For example, the SWNT oxidation temperature peak in Co/TiO2 catalyst is lower than in
Co/Al2O3. This occurred because the amount of cobalt
particles exposed to reaction is higher in Co/TiO2 than in
Co/Al2O3. As seen before with TPR analysis, Co/Al2O3
is the catalyst with the lower degree of reduction and a major fraction of Co is inside the alumina lattice and is not exposed to the gas phase.
Scanning electron microscopy (SEM)
SEM has been used to identify the various carbon species present in samples.51 The SEM image in Figure 7a
shows a high density of CNT production on Co/Al2O3
catalysts and there is a larger distribution of the diameter size (from 7 nm to 35 nm, approximately), suggesting the presence of SWNT and MWNT. All these analyses are in agreement with the TPO results, which show higher yield of CNT (34.1%) and the presence of amorphous carbon, SWNT and MWNT. It was also able to verify that the base-growth mode dominates in Co/Al2O3 catalyst. In this
growth mode, cobalt particles interact strongly with the support and remain trapped during growth.52
In contrast to Figure 7a, the SEM image of Co/Nb2O5
after the reaction step (Figure 7b) did not show the presence of CNT or carbon filaments, confirming the TPO and Raman results.
Catalyst properties and CNT production
The results reported in this work show the notable influence that the support has on the methane decomposition and CNT production. For Co/TiO2, it was not possible to detect
Co3O4 XRD peaks due its relatively high Co dispersion.
This suggests that the crystallite size of Co3O4 on TiO2 was
probably below the lower limit for XRD detection. In this way, the size of Co3O4 particles supported on TiO2 should be
smaller than those supported on SiO2 and Al2O3. However,
the particle size obtained from chemisorption analysis was 27 nm. These results suggest that part of the cobalt particles was covered by the reduced support species after reduction step. This effect known as strong metal support effect (SMSI) was also observed by Li et al.41
The cobalt particle diameter for the Co/SiO2 catalyst
obtained from chemisorption was considerably larger than
the value obtained by XRD. The incomplete reduction of the cobalt oxide species after the reduction step at 973 K
seems to be the main reason for the low amount of H2
chemisorption on this catalyst resulting in an incorrect particle diameter value. This is consistent with the methane decomposition pulse experiments, in which a fraction of the cobalt species was not reduced after the reduction step, resulting in a lack of hydrogen production in the initial pulses.
A direct correlation between the average pore diameter and the average cobalt diameter for catalysts has been previously reported. Saib et al.53 found that the
cluster size increases with increasing pore diameter of the SiO2 support. However, contradictory results on the
dependence of the size of Co3O4 clusters and the pore
diameter were found in this work. The results obtained from
physisorption and XRD showed that the TiO2 had larger
pore diameter than the SiO2 and Al2O3 supports, while the
size of Co3O4 particles supported on TiO2 may be smaller
than those supported on SiO2 and Al2O3. A comparable
result was also found by Storsæter et al.34 They studied the distribution of cluster and particle sizes of Co3O4 on
the SiO2, Al2O3 and TiO2 supports and reported that Co3O4
particles were distributed more uniformly over the TiO2
support than on SiO2 and Al2O3. They concluded that Co3O4
particles will exist as agglomerates up to a certain pore size, beyond which no agglomeration will occur.34
The average Co3O4 particle diameters on Co/Al2O3 and
Co/SiO2 catalysts estimated by XRD analysis were larger
than the average pore diameter. In this case, a large fraction of the particles was not found to be inside the single pores, but rather on the outside and occupying interconnected pore cavities as founded by Storsæter et al.34
Since there is a correlation between the size of the metal nanoparticles and the CNT diameter, the control of the distribution of nanoparticle size is an important parameter in CNT production. A large particle size distribution will produce different CNT and other forms of carbon and their oxidation will occur at different temperatures. The carbon deposits on Co/TiO2 sample showed the narrowest oxidation
temperature range (410 K). This result demonstrates the regularity of the CNT yield with Co/TiO2 catalysts. The
Co/Al2O3 and Co/SiO2 samples showed a broad oxidation
temperature range, 560 K for the carbon deposited on Co/SiO2 catalyst and 500 K for the carbon deposited on
Co/Al2O3 catalysts. These results suggest that the Co3O4
particle sizes were distributed relatively more uniformly over the TiO2 support than on SiO2 and Al2O3.
From total H2 chemisorption, it was possible to estimate
followed by Co/Al2O3 (14.4 µmol Co gcat-1) and Co/SiO2
(12.2 µmol Co gcat-1). However, the Co/Al2O3 was the
catalyst that showed higher methane conversion (Figure 4).
The activity for the Co/TiO2 catalyst was probably
influenced by the coating of cobalt particles by the reduced species of the support. This result is supported by the low H/Co ratio (3.8%) found in chemisorption analysis.
From TPR and chemisorption analysis, it was concluded that the reducibility of the Co species is strongly influenced by the support. The degree of Co reduction was smallest for the Co/Al2O3 catalyst, only 31% of the cobalt was reduced
to Co0. In the others, 79% of the cobalt is in the form of
cobalt aluminate or inside the alumina lattice. Another interesting result is that Co/Al2O3 was the only catalyst
that showed irreversible H2 chemisorption, indicating a
strong interaction between the metallic cobalt particle and hydrogen. This interaction should influence the activity of the catalyst since the methane decomposition on cobalt particles is the first step for CNT production.24 Moreover,
the cobalt/support interactions determine the mode of carbon nanotube growth.35 Weak interactions (like in the
Co/SiO2 catalyst) yield tip-grown CNT. In this mode, the
cobalt particles are more exposed to the methane flow, allowing the carbon nanotubes to grow for a longer time, whereas strong interactions (like in the Co/Al2O3 catalyst)
lead to base-growth, limiting the access of methane to cobalt particles deactivating the catalysts. These results are show in Figure 4.
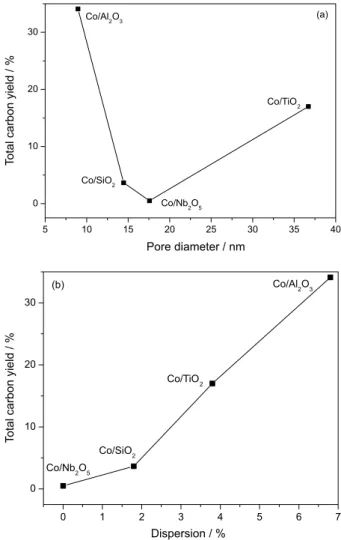
Cassell et al.35 attributed, at least in part, that a more open textural support structure is responsible for an increase in yield due to more efficient diffusion of reactants and intermediate hydrocarbon species. This effect was very small in the catalysts studied in this work. There was not any correlation between the pore structure and the total yield of carbon on CNT reaction. Figure 8a shows the total carbon yield as a function of average pore diameter of the catalysts. Thus, the Co surface area seems to be the main effect responsible for the increase in the activity of the catalysts (Figure 8b).
A fundamental step needed for the production of CNT is a trustworthy characterization of the type and amount of carbon deposited on a given sample. The characterization and quantification of the carbon deposited was done using Raman spectroscopy, TPO and SEM techniques. These techniques united allowed identifying the different carbon species present on the catalysts. It can be concluded that the most selective catalyst toward
SWNT was Co/TiO2. Most of the oxidized carbon (in its
TPO profile) oxidized in the range of SWNT oxidation. The Raman spectroscopy analysis agrees with this results showing lower FWHM (full-width at half maximum) and
D/G ratio. However, the D/G value (0.88) suggests the presence of a small number of tubes with few walls. The Co/Al2O3 catalyst was the most active catalyst, with a
yield of 34.1%. On the other hand, this catalyst produced different forms of carbon. This lack of selectivity may be attributed to the broad distribution of the cobalt particle size. The particle size obtained from Scherrer equation (16.8 nm) is just an average of the most usual particle size. It does not mean that there is not different particle size. The Raman experiments showed the presence of RBM peak, which is typical of SWNT. Therefore, it means that there are SWNT on this sample and SWNT can only grow from small particles. Moreover, the TPO results showed an oxidation of different carbon species (amorphous, SWNT and MWNT) which are formed from different metallic particle sizes.26,54
affected by the support properties, as far as reducibility and precursor/support interactions are concerned. The selectivity toward CNT was in part dependent on the cobalt particle size, which was also dependent on the textural propertie of the support. For better control of the cobalt particles size distribution is necessary that the support has large pore diameters and high specific surface area to avoid the agglomeration of the cobalt particles.
Conclusions
A narrow size distribution of the cobalt particles is necessary to increase the selectivity of CNT formation. The cobalt particle size distribution depended on the nature, specific surface area and pore diameter distribution of the support. Supports with high specific surface area but without large pore diameter (Al2O3 and SiO2) can
lead to agglomeration of cobalt particles on 4 wt.% supported catalyst. This agglomeration will lead to large size distribution of the cobalt particles producing different carbon species. A support with large pore diameter and a strong interaction between cobalt oxide particles and its support can avoid the agglomeration of cobalt particles. Thus, Co/TiO2 catalyst exhibited a high selectivity toward
SWNT production, which results from the uniform size distribution of the Co particles.
The total activity of the catalyst in methane decomposition and consequently in CNT yield was dependent on the total amount of surface Co species. This way, Co/Al2O3 presented the highest activity, and in the
case of Co/Nb2O5 and Co/TiO2 catalysts, the migration of
reduced species of the support to the metal surface inhibited their activity.
Acknowledgements
We would like to thank the Coordenação de Aperfeiçoamento de Pessoal de Nível Superior (CAPES) for financial support, the Instituto Nacional de Tecnologia (INT) for XRD measurements, the Instituto Militar de Engenharia (IME) for SEM images and to the Instituto Nacional de Metrologia, Normalização e Qualidade Industrial (INMETRO) for Raman measurements.
References
1. Cheng, H. M.; Li, F.; Su, G.; Pan, H. Y.; He, L. L.; Sun, X.; Dresselhaus, M. S.; Appl. Phys. Lett. 1998, 72, 3282. 2. Su, M.; Zheng, B.; Liu J.; Chem. Phys. Lett. 2000, 322, 321. 3. Herrera, J. E.; Balzano, L.; Borgna, A.; Alvarez, W. E.; Resasco,
D. E.; J. Catal. 2001, 204, 129.
4. Herrera, J. E.; Resasco D. E.; Chem. Phys. Lett. 2003, 376, 302. 5. Grimm, D.; Gruneis, A.; Kramberger, C.; Chem. Phys. Lett
2006, 428, 416.
6. Qian, W. Z.; Tian, T.; Guo, C. Y.; J. Phys. Chem. C 2008, 112, 7588.
7. Nagaraju, N.; Fonseca, A.; Konya, Z.; Nagy, J. B.; J. Mol. Catal A: Chem. 2002, 181, 57.
8. Chiang, W. H.; Sankaran, R. M.; Nat. Mater. 2009, 8, 882. 9. Irurzun, V. M.; Tan, Y. Q.; Resasco, D. E.; Chem. Mater. 2009,
21, 2238.
10. Liu, Z. M.; Han, B. X.; Adv. Mater. 2009, 21, 825.
11. Meshot, E. R.; Plata, D. L.;Tawfick, S.; Zhang, Y. Y.; Verploegen, E. A.; Hart, A. J.; ACS Nano 2009, 3, 2477.
12. Sugime, H.; Noda S.; Maruyama, S.;Yamaguchi, Y.; Carbon 2009, 47, 234.
13. Dupuis, A. C.; Progr. Mater. Sci. 2005, 50, 929.
14. Saito, R.; Fujita, M.; Dresselhaus, G.; Dresselhaus, M. S.; Appl. Phys. Lett. 1992, 60, 2204.
15. Kitiyanan, B.; Alvarez, W. E.; Harwell, J. H.; Resasco, D. E.; Chem. Phys. Lett. 2000, 317, 497.
16. Zowtiak, J. M.; Bartholomew, C. H.; J. Catal. 1983, 83, 107.
17. Bartholomew, C. H.; Catal. Lett. 1990, 7, 27.
18. Klug, H. P.; Alexander, L. E.; In X-ray Difraction Procedures for Polycrystalline and Amorphous Materials, 2nd ed.; John Wiley & Sons: New York, 1974
19. Ko, E. I.; Weissman, J. G.; Catal. Today 1990, 8, 27. 20. Agoudjil, N.; Benkacem, T.; Desalination 2007, 206, 531. 21. Park, J. W.; Jeong, J. H.; Yoon, W. L.; Jung, H.; Lee, H. T.; Lee,
D. K.; Park, Y. K.; Rhee, Y. W.; Appl. Catal: A Gen. 2004, 274, 25.
22. Dal, H. J.; Rinzler, A. G.; Nikolaev, P.; Thess, A.; Colbert, D. T.; Smalley R. E.; Chem. Phys. Lett. 1996, 260, 471.
23. Willems, I.; Konya, Z.; Colomer, J. F.; Chem. Phys. Lett. 2000, 317, 71.
24. Li, Y. M.; Kim, W.; Zhang, Y. G.; Rolandi, M.; Wang, D. W.; Dai, H. J.; J. Phys. Chem.B 2001, 105, 11424.
25. Cheung, C. L.; Kurtz, A.; Park, H.; Lieber, C. M.; J. Phys. Chem. B 2002, 106, 2429.
26. Zhang, W. D.; Wen, Y.; Tjiu, W.C.; Xu, G. Q.; Gan, L. M.; Appl. Phys. A: Mater Sci. Process.2002, 74, 419.
27. Zhang, Y.; Li, Y.; Kim, W.; Wang, D.; Dai, H.; Appl. Phys. A: Mater. Sci. Process. 2002, 74, 325.
28. Silva, R.; Schmal, M.; Frety, R.; Dalmon, J. A.; J. Chem. Soc., Far. Trans. 1993, 89, 3975.
29. Jeong, S. H.; Hwang, H. Y.; Lee, K. H.; Jeong, Y.; Appl. Phys. Lett. 2001, 78, 2052.
30. Duesberg, G. S.; Graham, A. P.; Liebau, M.; Nano Lett. 2003, 3, 257.
32. Noronha, F. B.; Perez, C. A.; Schmal, M.; Frety, R.; Phys. Chem. Chem. Phys. 1999, 1, 2861.
33. Kraum, M, Baerns, M.; Appl. Catal., A 1999, 186, 189; Madikizela, N. N.; Coville, N. J.; Mol Catal A: Chem. 2002, 181, 129; Kalala, J.; Coville, N. J.; Diane, H.; Glasser, D.; Jewell, L. L.; Fuel 2007, 86, 73.
34. Storsæter, S.; Totdal, B.; Walmsley, J. C.; Tanem, B. S.; Holmen, A.; J. Catal. 2005, 236, 139.
35. Cassell, A. M.; Raymakers, J. A.; Kong, J.; Dai, H. J.; J. Phys. Chem. B 1999, 103, 6484.
36. Chin, R. L.; Hercules, D. M.; J. Phys. Chem. 1982, 86, 360. 37. Ho, S. W.; Cruz, J. M.; Houalla, M.; Hercules, D. M.; J. Catal.
1992, 135, 173.
38. Hinchiranan, S.; Zhang, Y.; Nagamori, S.; Vitidsant, T.; Tsubaki, N.; Fuel Process. Technol. 2008, 89, 455.
39. Zhang, J. L.; Chen, J. G.; Ren, J.; Sun, Y. H; Appl. Catal. A: Gen. 2003, 243, 121.
40. Ratnasamy, P.; Knozinger, H.; J. Catal. 1978, 54, 55. 41. Li, Y. Z.; Fan, Y. N.; Yang, H. P.; Chem. Phys. Lett. 2003, 372,
160.
42. Storsaeter, S.; Borg, O.; Blekkan, E. A.; Holmen, A.; J. Catal. 2005, 231, 405.
43. Avdeeva, L. B.; Kochubey, D. I.; Shaikhutdinov, S. K.; Appl. Catal. A: Gen. 1999, 177, 43.
44. Boskovic, G.; Smith, K. J.; Catal. Today 1997, 37, 25. 45. Alvarez, W. E.; Pompeo, F.; Herrera, J. E.; Balzano, L.;
Resasco, D. E.; Chem. Mater. 2002, 14, 1853.
46. Bandow, S.; Asaka S.; Saito Y.; Rao, A. M.; Grigorian, L.; Richter, E.; Eklund, P. C.; Phys. Rev. Lett. 1998, 80, 3779. 47. Rols, S.; Righi, A.; Alvarez, L.; Eur. Phys. J. B 2000, 18, 201. 48. Heracleous, E.; Lemonidou, A. A.; J. Catal. 2006, 237, 162. 49. Zhao, Z. K.; Yung, M. M.; Ozkan, U. S.; Catal. Commun. 2008,
9, 1465.
50. Brukh, R.; Mitra, S.; J. Mater. Chem. 2007, 17, 619.
51. Rao, C. N. R.; Satishkumar, B. C.; Govindaraj, A.; Nath, M.; ChemPhysChem 2001, 2, 78.
52. Kong, J.; Soh, H. T.; Cassell, A. M.; Quate, C. F.; Dai, H.; Nature 1998, 395, 878.
53. Saib, A. M.; Claeys, M.; van Steen, E.; Catal. Today 2002, 71, 395.
54. Reshetenko, T. V.; Avdeeva, L. B.; Ushakov, V. A.; Appl. Catal. A: Gen. 2004, 270, 87.
Submitted: November 27, 2011