Article
J. Braz. Chem. Soc., Vol. 22, No. 3, 501-510, 2011. Printed in Brazil - ©2011 Sociedade Brasileira de Química
0103 - 5053 $6.00+0.00
A
*e-mail: [email protected]
An Anionic Resin Modiied by di-2-Pyridyl Ketone Salicyloylhydrazone as a New
Solid Preconcentration Phase for Copper Determination in Ethanol Fuel Samples
Samara Garcia and Ivanise Gaubeur*
Centro de Ciências Naturais e Humanas, Universidade Federal do ABC, Rua Santa Adélia, 166, 09210-170 Santo André-SP, Brazil
A adsorção do DPKSH em resina aniônica foi investigada a 25 ± 1 °C e em pH 12 com base em três modelos cinéticos pseudo-primeira ordem, pseudo-segunda ordem e difusão intra-partícula. Os dados experimentais foram aplicados com sucesso aos modelos das isotermas de Langmuir, Freundlich e Dubinin-Radushkevich (D-R). A resina aniônica modiicada com DPKSH foi usada na determinação espectrofotométrica do cobre após pré-concentração em linha. Nas melhores condições, foi observada uma resposta linear entre 20 e 80 µg L-1, limites de detecção e quantiicação
estimados em 0,5 e 1,8 µg L-1, respectivamente, com um nível de coniança de 95%, e um fator de
pré-concentração igual a 11. O desvio padrão relativo foi estimado em 2,6% para a concentração de 32 µg L-1 Cu(II) (n = 20). Os resultados obtidos na determinação de cobre em amostras de
etanol combustível apresentaram concordância, com um nível de coniança de 99%, aos obtidos por espectrometria de absorção atômica com chama (F AAS).
The adsorption of DPKSH onto anionic resin was investigated at 25 ± 1 °C and pH 12 on the basis of three kinetic models including pseudo-irst order, pseudo-second order and intraparticle diffusion. Isotherm equations including Langmuir, Freundlich and Dubinin-Radushkevich (D-R) were successfully applied to model the experimental data. An anionic resin loaded with DPKSH was used in a low system for the in-line concentration of copper prior to spectrophotometric determination. Under optimized conditions, a linear response was observed between 20 and 80 µg L-1, with limits of detection and quantiication estimated at 0.5 and 1.8 µg L-1, respectively,
at the 95% conidence level with an enrichment factor of 11. The relative standard deviation was estimated to be 2.6% for 32 µg L-1 Cu(II) (n = 20). The results obtained for copper determination
in ethanol fuel samples agreed with those achieved by lame atomic absorption spectrometry (F AAS) at the 99% conidence level.
Keywords: preconcentration, DPKSH, low analysis, molecular spectrophotometry, ethanol fuel sample
Introduction
In spite of the recent advances in instrumentation and improvements in selectivity and sensitivity, there is a need for preconcentration and separation of trace elements prior to analyses to achieve low limits of detection and to remove constituents that interfere with the matrix.1-4
Several strategies are used for separation and preconcentration, such as liquid-liquid, solid-liquid and cloud point extraction.4-7 In comparison to other
strategies, solid-liquid extraction provides simplicity, lower
sample contamination and higher enrichment factors, in addition to simple coupling to low systems, improved sampling throughput and minimal sample and reagent consumption.8-11
Recently a number of sorbents have been used for the in-line preconcentration and determination of metal ions including polymeric resins.1,10,12 The Amberlite
Di-2-Pyridyl ketone salicyloylhydrazone (DPKSH) is a complexing reagent that is presently used in spectrophotometric method development. DPKSH was adsorbed onto silica gel and Amberlite resins (XAD-2 and XAD-7), and the adsorption was investigated using kinetic and isotherm models.13-15
In ethanolic/aqueous solution, DPKSH is in tautomeric equilibrium with the (I) ketonic and (II) enolic form, Scheme 1.
DPKSH may be present in solution as different species and is dependent on the pH of the solution. At a pH between 3.6 and 6.7, neutral species represented by RN are predominant. At pH ≤ 3.5, protonation of the pyridine nitrogen occurs (K1 3.16 × 10⁻⁴ mol L-1) and the
protonated species is predominant and is represented by RNH+. At pH ≥ 6.7, anionic species represented by RO− are
predominant (K2 1.41 × 10⁻⁷ mol L-1). Deprotonation of the
enolic form of DPKSH is represented by ROH.16
This study focused on the evaluation of an anionic resin modiied with DPKSH and the utilization of the modiied resin as a solid phase for in-line copper separation and preconcentration. The mechanism of adsorption was obtained through kinetic and isotherm models. A low system with in-line preconcentration on a mini-column packed with an anionic resin modiied by DPKSH was developed. Chemical and hydrodynamic parameters were investigated and the procedure was applied to copper spectrophotometric determination in ethanol fuel samples.
Experimental
Instrumentation
An UV-Vis Cary 50 spectrophotometer (Varian, Palo Alto, CA, USA) equipped with a 1.00 cm quartz cell (Hellma, Müllheim, Germany) was used to determine the absorbance of DPKSH solutions and Cu (II)/DKPSH complexes.
Solutions were mixed (DPKSH and IRA 402) with a MA-140 Marconi shaker (Piracicaba, SP, Brazil) at a
controlled speed. The mixtures were centrifuged with a QM222TM centrifuge (Quimis, São Paulo, Brazil).
The measurement of pH was performed with a Metrohm 654 pHmeter (Herisau, Switzerland) equipped with a Metrohm combined glass electrode. The Ag/AgCl reference electrode was illed with 3 mol L-1 NaCl.
The low system was designed with a Gilson Minipuls Evolution peristaltic pump (Paris, France) equipped with 0.7 mm Tygon® tubes for the propulsion of luid.
An Analyst 200 lame atomic absorption spectrometer (PerkinElmer, Norwalk, CT, USA) equipped with deuterium background correction and copper hollow-cathode lamps as radiation sources was used for the determination of copper in ethanol fuel samples. The instrumental parameters were adjusted according to the manufacturer’s recommendations.
Reagents and solutions
All solutions were prepared with analytical grade reagents and deionized water, obtained from Milli-Q system (Millipore, Billerica, MA, USA). Copper reference solutions were prepared by diluting 1.0 g L-1 stock solutions
Titrisol (Merck, Darmstadt, Germany). Solutions, such as those used to evaluate the proposed method selectivity, were prepared by dissolving their salts into deionized water. Buffer solutions containing CH3COOH/CH3COONa
at pH 4.0 (1.0/0.20 mol L-1), pH 4.7 (0.10/0.10 mol L-1),
pH 5.0 (0.50/1.0 mol L-1), pH 5.5 (0.20/1.3 mol L-1) and
pH 6.0 (0.10/2.0 mol L-1) and CH
3COONH4 at pH 7.0
(1.0 mol L-1) were used for the adjustment of the pH.
DPKSH was synthesized according to a procedure reported in previous paper.7 The solutions of DPKSH were
prepared by dissolving the reagent in ethanol absolute from Merck and diluted in different ethanol concentrations when needed.
Adsorption experiments
DPKSH adsorption kinetics and isotherms were determined using the solution depletion method. In stoppered plastic tubes, 0.200 g of the anionic resin was shaken with 10 mL of a solution comprised of DPKSH and 3% v/v ethanol at pHs 1, 4.7 and 12. In the kinetics study, the mixture was maintained under agitation and an aliquot of supernatant was collected every 20 min up to 240 min, while in the adsorption isotherm study the resulting mixture was then kept in contact for 2 h.
The concentration of DPKSH, at the supernatant aliquots, was determined from the absorption with parameters from the following analytical curves:
pH 1: A332nm = 0.010 + 2.21×10⁴ × CDPKSH, r = 0.9983 (1)
pH 4.7: A319nm = – 0.017 + 1.91×10⁴ × C
DPKSH, r = 0.9989 (2)
pH 12: A315nm = – 0.011 + 1.37×10⁴ × CDPKSH, r = 0.9989 (3)
Preparation of the solid adsorbent and mini-column
Amberlite® IRA 402 (Aldrich Chemical, Saint Louis,
MO, USA), an anion exchanger with a particle size of 0.60-0.75 mm and an exchange capacity of 1.2 equiv. L-1,
was used in this work. The chloride form of the resin was treated with a 1:1:2 v/v/v HCl:ethanol:H2O solution in a
bath for 3 h. The resin was collected on a Büchner funnel with ilter paper and repeatedly washed with deionized water until the iltrate was near neutral (pH ca. 6). The
washed resin was dried in a desiccator for 2 days to remove any adsorbed water.
After the treatment as stated above, resin IRA 402 was modiied by adding 1 g of such in contact with 10 mL of DPKSH 2.2×10⁻⁴ mol L-1 prepared in medium of NaOH
(pH 12) and 3% v/v ethanol. The resulting mixture was under agitation at constant both speed and temperature for 24 h. Finally, the modiied resin was then washed with deionized water.
A mini-column was packed with 95 mg of modiied anionic resin. The ends of the mini-column were itted with glass wool to prevent changes in height bend.
Flow system
In the low system (Figure 1a), a sample (S) of a Cu(II) solution was pumped at 6.3 mL min-1 and merged with
a buffer solution (B, CH3COOH/CH3COONa) at pH 5.5 and also pumped at 4.8 mL min-1. The resulting sample
was then pumped through a mini-column (C) packed with anionic resin modiied by the addition of DPKSH, for 60 s loading time. The injector-commutator valve (IC) was commutated to injection (Figure 1b) and copper was eluted
with 100 µL (EV) of a 0.05 mol L-1 HNO
3 solution (E) at
6.3 mL min-1. The resulting solution was then merged with
4.8 mL min-1 of reagent (R, 1.5 × 10⁻⁴ mol L-1 DPKSH and
7.5% v/v ethanol, pH 5.5). After the solution passed through a 10 cm reaction coil (RC), the Cu(II)/DPKSH complex was detected (D) at 378 nm. Signals were measured as peak heights using the instrument software. Although the proposed system is manually operated, it can be easily automated by modern methods, such as multicommutation.10
Samples
Commercial ethanol fuel samples were acquired from a local gas station and Cu(II) determination was carried out in triplicate by the standard additions method. Volumes of 75 mL of samples were transferred to volumetric lasks and standard Cu(II), NaF (to avoid Fe(III) interference) and Na2SO4 (to recover copper from complexes with organic species)17 solutions were added. Lastly, deionized water was
added so that the inal volume of the solution was 100 mL.
Results and Discussion
Adsorption kinetics
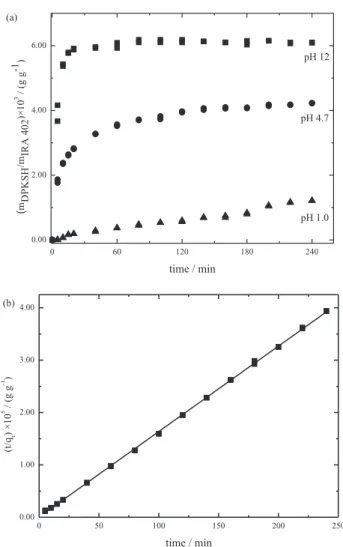
The DPKSH (4.0 × 10⁻⁵ mol L-1) mass variation retained
per gram of resin as a time function is shown in Figure 2a
for solutions with pHs 1, 4.7 and 12. The maximum exchange with DPKSH is achieved after 200 min at pH 4.7 and in 60 min at pH 12. At pH 1, the maximum exchange was not observed until 240 min.
Considering the superior capacity for adsorption of DPKSH onto an IRA 402 resin at pH 12, kinetic and isotherm studies were perfgormed at this pH. To investigate the mechanism of ion exchange, a simple kinetic model was used to test the experimental data. This was achieved by applying the Lagergren expression,13,18,19 which is the
Figure 1. Flow diagram system for copper (II) determination. IC: injector-commutator valve, RC: 10 cm reaction coil, C: mini-column packed with resin modiied by the addition of DPKSH, E: eluent (HNO3, 0.05 mol L-1), EV: eluent volume, S: Cu(II) sample, B: buffer solution (CH3COOH/CH3COONa),
irst equation developed for the description of adsorption in liquid-solid systems based on solid capacity.
(4)
where k1 is the rate constant of a pseudo-first order process, qmax denotes the maximum amount of exchange
(g DPKSH g-1 IRA 402) and indicates the adsorption
capacity corresponding to monolayer coverage, qt is the
amount of DPKSH retained on IRA 402 (g g-1) when t ≠ 0 and
tmax. After integration and application of the initial conditions
where qt = 0 at t = 0 and the conditions at equilibrium where qads = qt for each time, t, equation 4 becomes:
(4a)
The correlation coeficient obtained from the pseudo-irst order model at pH 12 was not satisfactory and the calculated value of qmax,calwas quite different from the value
of qmax observed in the experimental kinetic study, Figure 2a.
These results suggest that adsorption of DPKSH on the anionic resin does not follow a pseudo-irst order model.
The exchange kinetics may be described by a pseudo-second order equation.13,18-21 The differential equation may
be expressed by:
(5)
where k2 is the rate constant of the pseudo-second order process and qtand qmax,calcare as indicated in equation 4.
Integrating equation 5 and applying boundary conditions gives:
(5a)
The second-order constant (k2) and the maximum
amount of DPKSH retained (qmax,calc) may be calculated
from the intercept and the slope of equation 5a between t/qt and t. Figure 2b shows (t/qt) vs. t and the values of k2,
qmax,calc and r2 which are (6.07 ± 1.22) × 103 min-1 g resin
g-1 DPKSH, (6.13 ± 0.01) × 10-4 g DPKSH g-1 resin and 0.9999,
respectively. The qmax,calc agrees with the qmax obtained from kinetic experimental data (6.10 × 10⁻⁴ g DPKSH g-1 resin)
and the value of r2 is excellent. Thus, the adsorption of
DPKSH at pH 12 proceeds according to the pseudo-second order model.
Considering the fact that pseudo-irst order equation 4a and pseudo-second order equation 5a models cannot identify a mechanism involving diffusion, the intraparticle diffusion model14,20,21 was tested using the following equation:
qt = kp t1/2 + C (6)
kp is the rate constant for intraparticle diffusion and C is the intercept.
According to this model, if a straight line that passes through the origin is obtained from a plot of qtvs. t1/2, the
mechanism of adsorption involves diffusion and the slope of the linear curve is the rate constant of intraparticle transport (kp). Experimental data (qt, t1/2) at pH 12 were applied to
equation 6 and a diffusion mechanism did not it the results.
Adsorption isotherms
To describe the adsorption equilibria, three commonly used mathematical expressions were applied to the experimental data. These equations correspond to the Freundlich, Langmuir and Dubinin-Radushkevich (D-R) isotherms models.14,15,18,19
The Langmuir model22 was originally developed
to represent chemisorption on well-defined localized adsorption sites with identical adsorption energies. The Langmuir model also assumes that adsorption is independent of the surface coverage and interaction between adsorbed molecules does not occur. Maximum adsorption is achieved when the surface of the adsorbent is covered with a monolayer of adsorbate. The linearized form of Langmuir isotherm is expressed as follows:
(7)
where mads represents the amount of DPKSH adsorbed per
unit of resin (g g-1
IRA 402), mma a d x
s is the maximum amount of
solute retained (g) per gram of IRA 402 (the adsorption
capacity), Ceq is the equilibrium concentration of DPKSH
in solution (g L-1) and K
L is the Langmuir constant which
is related to the equilibrium constant of adsorption. Figure 3a shows the experimental data for 1/madsvs. 1/Ceq
for IRA 402/DPKSH at pH 12. The curve was fitted using Origin 7.5 software by adjusting the experimental data to equation 7. The parameters KL and mma
a d x s are
(95.5 ± 0.7) L g-1 and (8.58 ± 0.01) 10-4 g (DPKSH) g-1
(IRA 402) at pH 12, respectively. The solid lines shown in Figure 3a were calculated by using parameters obtained from experimental values and an excellent it was observed. The Freundlich adsorption isotherm23 gives an empirical
expression encompassing an exponential distribution of active sites. The model takes either a monolayer or multilayer adsorption that is indeinitely increased irrespective of the adsorbate concentration. This model also assumes that the adsorbent surface is energetically heterogeneous.
The linearized form of Freundlich isotherm is expressed as follows:
(8)
where mads and Ceq are as indicated in the Langmuir isotherm, KF is the empirical constant and 1/n is related to
the energetic heterogeneity of adsorption sites.
The Freundlich constants 1/n and KF were determined
from the slope and intercept of plots of logmadsvs. log Ceq
at pH 12, which are shown in Figure 3b. Numerical values of the adsorption capacity, KF and 1/n, indicate the energy and intensity of adsorption and are (86 ± 9) g g-1 and (0.65 ±
0.02), respectively. A value of n between 1 and 10 indicates that adsorption is favored.19
To distinguish between physical and chemical adsorption, the experimental data were applied to the
Dubinin-Radushkevich (D-R) isotherm model.14,15,19 This
model features energy heterogeneity over the entire surface. The linear form of the D-R isotherm is given by:
lnCads = log KDR – Bε2 (9)
Figure 3. Adsorption isotherms of DPKSH onto IRA 402 at pH 12 (T = 25 ± 1 oC). Solid lines correspond to itting by the (a) Langmuir
where Cads is the amount of DPKSH adsorbed per unit
mass of IRA 402 (mol L-1g-1), K
DR is the maximum amount
of DPKSH adsorbed, B is a constant with dimensions of energy and ε indicates the Polanyi potential (ε = RT ln [1 + (1/Ceq)]), where Ris the gas constant in kJ K-1 mol-1 and T
is the temperature in K.
Figure 3c shows the linear regression of the equation ln Cadsvs. ε2. The values of B and K
DR were obtained from the
slope and intercept yielding (−1.58 ± 0.01) × 10-8 J2 mol-2
and (6.29 ± 0.01) × 10-2 mol g-1 at pH 12.
According to Antonio et al.,14 Freitas et al.15 and Saeed et al.24 if the surface is considered heterogeneous and an
approximation to a Langmuir isotherm is chosen as a local isotherm for sites that are energetically equivalent, then the quantity B1/2 can be related to the average sorption
energy (E) as:
(10)
which is the mean free energy of the transfer of 1 mol of solute from ininity to the surface of IRA 402.
The numerical value of E, calculated from equation 10, is 5.62 kJ mol-1 at pH 12, indicating physical adsorption. 14, 15
Flow injection procedure
Originally, some signiicant parameters in the method development that can also considerably inluence sensitivity, such as preconcentration time, sample low rate, pH, eluent volume, concentration and low rate, reagent volume and concentration, and reaction coil size were optimized.
The loading time effect (preconcentration time) which inluences the sample volume and analyte retention on the solid phase was evaluated ranging from 30 to 90 s (30, 45, 60, 75 and 90 s) with a 63.5 µg L-1 Cu(II) solution at pH 4.7
and with a low rate of 4.0 mL min-1. A linear development
in the analytical signal (A) was observed due to the increase in the preconcentration time (t) to 60 s and can be described by the equation A = (8.7 ± 0.5) × 10-2 + (3.0 ± 0.1) × 10-3 t
(r = 0.996). Thus, under the experimental conditions, the solid phase was not saturated until a 60 s loading time was reached. Therefore, a 60 s loading time was chosen for subsequent experiments.
The analytical signal can also be inluenced by the sample low rate. At a constant loading time, the analytical signal tends to enlarge with an increase in low rate, which is evidenced by an increase in the amount of analyte that interacts with the adsorbent. However, the kinetics of adsorption needs to be considered and the retention eficiency can diminish with low sample residence time in
the column. Excessively high low rates can also cause luid leakage from the connection points due to an increase of backpressure. The low rate (q) between 1.8 and 10.8 mL min-1 was evaluated under experimental conditions similar
to those previously described. The analytical signal varied linearly from 1.8 to 6.3 mL min-1 according to the equation:
A = (7.6 ± 0.2) × 10-2 + 0.133 ± 0.007 q, r = 0.999. Thus,
showing that favorable kinetics is involved in metal retention until a low rate of 6.3 mL min-1 is reached.
The effect of acidity on copper retention was investigated from pH 4.0 to 7.0 using appropriate buffer solutions. An increase in pH led to an increase in the analytical signal, as shown in Figure 4a. The increase in analytical signal was signiicant until pH 5.5 and was approximately 53% higher than observed at pH 4.0. A pH greater than 7.0 was not evaluated due to the fact that the metal hydrolysis was more favorable. Thus, a buffer solution with a pH of 5.5 was chosen for further experiments.
The eficiency of Cu2+ elution was evaluated using
HNO3 in varying concentrations, volumes and flow rates. As shown in Figure 4b, HNO3 concentrations up
to 0.10 mol L-1 were evaluated and the difference in
the resulting analytical signals was not signiicant. The protonation of DPKSH is favorable in the presence of a high concentration of H+ and this leads to competition
between H+ and metal ions for binding sites on the modiied
resin. However, higher eluent concentrations should be avoided to minimize desorption of complexant from the solid phase. Thus, 0.05 mol L-1 HNO
3 concentration was
maintained in further experiments.
A slightly higher analytical signal was achieved with an increase in eluent volume from 100 to 150 µL. However, a decrease in the analytical signal (−2.8%) was observed with 200 µL of HNO3 due to greater dilution of the analyte, as shown in Figure 4c. Therefore, an eluent volume of 100 µL was chosen for subsequent experiments.
The eluent low rate was investigated between 1.8 and 10.4 mL min-1. As shown in Figure 4d, the increase in the
analytical signal was proportional to the eluent low rate to 6.3 mL min-1, demonstrating favorable desorption kinetics.
Excessive low rates may cause luid leakage, which was observed at the sample low rate. For further studies, an eluent low rate of 6.3 mL min-1 was used.
The DPKSH concentration was varied at (1.5, 3.0 and 6.0) × 10-4 mol L-1 at pH 5.5. The differences between
analytical signals were low (ca. 1.4%), therefore, a DPKSH
concentration of 1.5×10⁻⁴ mol L-1 was selected.
Figure 4. Effect of the (a) pH of the buffer solution, (b, c and d) eluent concentration, volume and low rate and (e) reagent low rate on the analytical
4.8 mL min-1
, a signiicant decrease in analytical signal
was observed. Thus, a reagent low rate of 4.8 mL min-1
was chosen for further experiments.
The effect of the reaction coil (RC) length (10, 30 and 50 cm) was evaluated. A decrease in analytical signal was observed with an increase in the length of the reaction coil due to greater dispersion of the sample zone. Therefore, a reaction coil length of 10 cm was chosen.
Analytical features
Using the low system shown in Figure 1, analytical curves were obtained by pumping aliquots of Cu(II) standard solutions of varying concentrations, with measurements made in triplicate. A linear response was observed from 0.31 to 1.26 µmol L-1. This behavior can be
described by the equation A = (2.6 ± 0.4) × 10-2 + (2.48 ±
0.04) × 105 C
Cu(II), r = 0.997, where A is the absorbance
measured as peak height and C is the Cu(II) concentration in mol L-1.
The limits of detection and quantification were estimated at 0.5 and 1.8 µg L-1 of Cu(II) according to IUPAC
recommendations at the 95% conidence level25 with an
enrichment factor of 11. The relative standard deviation was estimated as 2.6% for 20 independent measurements with a 32 µg L-1 Cu(II) solution. The sampling throughput
for a 60 s loading time was 55 samples per hour. The resin
modiied by the addition of DPKSH was used for at least 288 sampling cycles without signiicant variation in the analytical response.
Effect of foreign ions
Under optimized conditions, experiments were conducted to evaluate the selectivity of the proposed procedure. The effect of cations and anions often found in different samples was evaluated and the results are presented in Table 1. The tolerance limit (7.8%) was taken as three times the standard deviation (± 0.004) of the average of analytical signal (0.153) for tenfold measurement for solutions with no interfering species.
Some cations and anions (Na+, K+, Co2+, Cl–, NO 3–,
F–, CH
3COO– and SO42–) yield only a slight interference
when the concentration of interfering ion was 1000 fold greater than the concentration of Cu(II) (63.5 µg L-1).
However, Co2+ was an exception and caused a relevant
interference at concentrations 1000 times greater than the concentration of Cu(II). HCO3– and PO
43– caused
interferences when their concentrations were 100 times greater than Cu(II). Similar effects were observed for Mg2+, Ca2+, Pb2+, Cd2+, Zn2+, Mn2+, Fe3+ and Cr3+ when
present in concentrations that were 10 times higher than Cu(II). Low Cu(II) retention in the presence of these ions may be attributed to competition for adsorption sites. Only Al3+ yields a serious interference when present in
concentrations equivalent to Cu(II).
By comparing the absorption maximum wavelength and molar absorptivity of complexes Cu(II)/DPKSH 3.6×10⁴ L mol-1 cm-1 at 378 nm, Ni(II)/DPKSH
4.9×10⁴ L mol-1 cm-1 at 375 nm and Co(II)/DPKSH
4.3×10⁴ L mol-1 cm-1 at 375 nm,16 the positive interference
caused by Ni2+ and Co2+, at concentrations 10 times greater
than the concentration of Cu2+, may take place as a result
of a competition between these ions for modiied resin active sites resulting in an increased absorbance value from the elution of Cu(II) and Ni2+ or Cu(II) and Co(II).
Zn(II)/DPKSH complex also shows a molar absorptivity value 5.3×10⁴ L mol-1 cm-116 greater than Cu(II)/DPKSH,
however the absorption maximum wavelength of such complex corresponds to 360 nm.
The interference of metallic ions commonly present in ethanol fuel samples, such as Ni, Zn, Cd and Co,26, 27 are
Table 1. Tolerance limit of foreign ions on determination of 63.5 µg L-1
Cu(II), pH = 5.5, λ = 378 nm, 95 mg modiied resin
Foreign ion Tolerance Limit
Ascorbate ≥ 10.000
Na+, K+, Co2+, Cl–, F–, NO 3–,
CH3COO–, SO 42–
≥ 1.000
HCO3–, PO43– ≥ 100
Mg2+, Ca2+, Pb2+, Cd2+, Ni2+,
Zn2+, Mn2+, Fe3+, Cr3+
≥ 10
Al3+ ≥ 1
Table 2. Recovery of copper spiked and determination of copper in ethanol
fuel samples by proposed procedure and F AAS30
Samples Copper amount / (mg L-1)
Added Found Recovery / (%)
A 0.060 0.062 ± 0.002 103 ± 4
0.080 0.077 ± 0.001 97 ± 1
Proposed procedure F AAS
B 0.021 ± 0.004 0.024 ± 0.007
C 0.0042 ± 0.0013 < 0.011*
D 0.017 ± 0.008 0.016 ± 0.008
E 0.018 ± 0.005 0.021 ± 0.003
F 0.045 ± 0.003 0.047 ± 0.003
G 0.037 ± 0.007 0.032 ± 0.005
H 0.028 ± 0.009 0.028 ± 0.006
not relevant to the proposed procedure, since these species are typically found at levels similar or lower than Cu(II). However, Fe(III) is a concomitant commonly present at levels similar or higher than Cu(II) and must be masked. Based on the values of complexes formation constants Fe(III)/DPKSH (β1 2.9×10⁵)28 and Fe(III)/F– (β
6 1.3×10¹⁶),29
Fe(III) ions present in the ethanol fuel samples were masked in these samples by adding F–.
Application to ethanol fuel samples
The recovery of copper spiked into ethanol fuel samples was evaluated to verify the applicability of the proposed procedure (Table 2). Recoveries from 97 to 103% were estimated indicating that the procedure is free from matrix effects.
The results obtained from ethanol fuel samples by the proposed procedure were compared to those attained by F AAS,30 Table 2, and are in agreement at the 99%
conidence level.
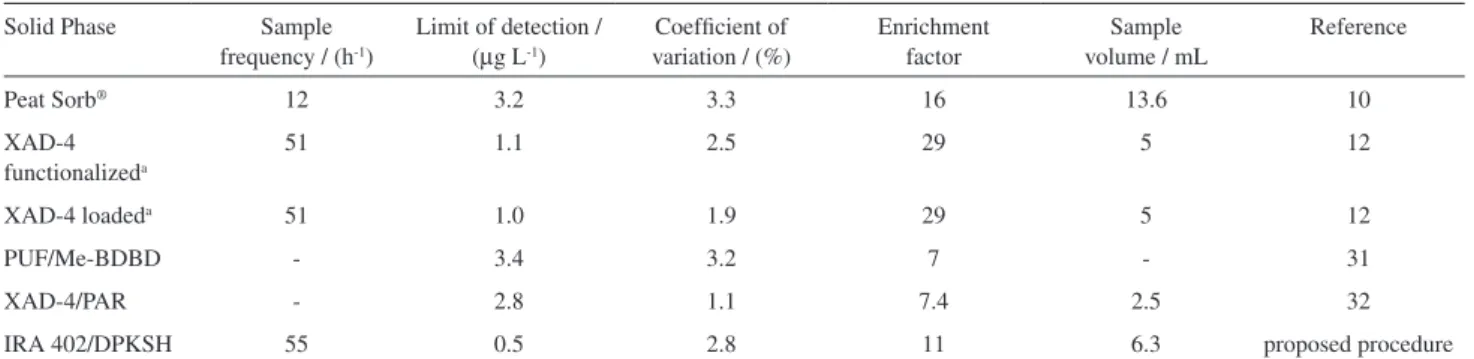
Table 3 shows a comparison of analytical features of the proposed method and established methods for the determination of copper after solid-phase extraction.10,12,31,32 Features such as the limit of detection
and enrichment factor are comparable to those obtained by the proposed method. A relevant number of methods have been proposed for the determination of cations from ethanol fuel samples and most of then use atomization techniques - these procedures also need a preconcentration step.33,34 Advantages of the proposed method include the
determination of copper from ethanol fuel samples without the requirement of a pretreatment step, low consumption of sample and reagents and high limit of detection, as well as the UV-Vis spectrophotometric methods are seen as attractive possibilities for determining metallic ions due to their handling easiness and simplicity, low cost and easy access to instrumentation.35
Conclusions
IRA 402 resin was modified by the addition of DPKSH, and a kinetic and isotherm adsorption study was performed. The modiied resin was used for at least 288 preconcentration/elution cycles to test endurance and reproducibility. The successful application of the proposed method for Cu(II) determination in ethanol fuel samples, without the need for pretreatment such as evaporation, shows the feasibility of IRA 402 resin modiied by DPKSH as a solid phase in solid-liquid extraction.
Acknowledgments
The authors acknowledge fellowships and inancial support from the following Brazilian agencies: Coordenação de Aperfeiçoamento de Pessoal de Nível Superior (CAPES), Conselho Nacional de Desenvolvimento Científico e Tecnológico (CNPq) and Fundação de Amparo à Pesquisa do Estado de São Paulo (FAPESP).
References
1. Lemos, V. A.; Santos, M. S.; Santos, E. S.; Santos, M. J. S.; Santos, W. N. L.; Souza, A. S.; Jesus, D. S.; Virgens, C. F.; Carvalho, M. S.; Oleszczuk, N.; Vale, M. G. R.; Welz, B.; Ferreira, S. L. C.; Spectrochim. Acta, Part B2007,62, 4. 2. Ferreira, S. L. C.; de Andrade, J. B.; Korn, M. G. A.; Pereira,
M. G.; Lemos, V. A.; dos Santos, W. N. L.; Rodrigues, F. M.; Souza, A. S.; Ferreira, H. S.; da Silva, E. G. P.; J. Hazard. Mater.
2007,145, 358.
3. Korn, M. G. A.; de Andrade, J. B.; Jesus, D. S.; Lemos, V. A.; Bandeira, M. L. S. F.; dos Santos, W. N. L.; Bezerra, M. A.; Amorim, F. A. C.; Souza, A. S.; Ferreira, S. L. C.; Talanta2006,69, 16.
4. Camel, V.; Spectrochim. Acta, Part B2003,58, 1177. 5. Ávila-Terra, L. H. S.; Gaubeur, I.; Areias, M. C. C.; Suárez-Iha,
M. E. V.; Spectrosc. Lett.1999,32, 257.
Table 3. Analytical features of some procedures for copper determination
Solid Phase Sample
frequency / (h-1)
Limit of detection / (µg L-1)
Coeficient of variation / (%)
Enrichment factor
Sample volume / mL
Reference
Peat Sorb® 12 3.2 3.3 16 13.6 10
XAD-4 functionalizeda
51 1.1 2.5 29 5 12
XAD-4 loadeda 51 1.0 1.9 29 5 12
PUF/Me-BDBD - 3.4 3.2 7 - 31
XAD-4/PAR - 2.8 1.1 7.4 2.5 32
IRA 402/DPKSH 55 0.5 2.8 11 6.3 proposed procedure
aβ-nitroso-α-naphthol; PUF polyurethane foam; Me_BDBD 6-[2´-(6´-methyl-benzothilazolylazo)]-1,2-dihydroxy-3,5-benzenedisulfonic acid; PAR
6. Xie, F.; Lin, X.; Wu, X.; Xie, Z.; Talanta2008,74, 836. 7. Gaubeur, I.; Ávila-Terra, L. H. S.; Masini, J. C.; Suárez-Iha, M.
E. V.; Anal. Sci.2007,23, 1227.
8. Hansen, E. H.; Miró, M.; TrAC,Trends Anal. Chem.2007,26,
18.
9. Tzanavaras, P. D.; Themelis, D. G.; Anal. Chim. Acta2007,
588, 1.
10. Gonzáles, A. P. S.; Firmino, M. A.; Nomura, C. S.; Rocha, F. R. P.; Oliveira, P. V.; Gaubeur, I.; Anal. Chim. Acta2009,636, 198.
11. Baliza, P. X.; Ferreira, S. L. C.; Texeira, L. S. G.; Talanta2009,
79, 2.
12. Lemos, V. A.; Santos, E. S.; Gama, E. M.; Sep. Purif. Technol.
2007,56, 212.
13. Antonio, P.; Iha, K.; Suárez-Iha, M. E. V.; J. Colloid Interface Sci.2007,307, 24.
14. Antonio, P.; Iha, K.; Suárez-Iha, M. E. V.; Talanta2004,64, 484.
15. Freitas, P. A. M.; Iha, K.; Felinto, M. C. F. C.; Suárez-Iha, M. E. V.; J. Colloid Interface Sci.2008,323, 1.
16. Garcia-Vargas, M.; Belizón, M.; Hernández-Artiga, M. P.; Martinez, C.; Pérez-Bustamante, J. A.; Appl. Spectrosc.1986,
40, 1058.
17. Takeuchi, R. M.; Santos, A. L.; Medeiros, M. J.; Stradiotto, N. R.; Microchim. Acta2009,164, 101.
18. Chen, H.; Zhao, J.; Adsorption2009, 15, 381.
19. Solangi, I. B.; Memon, S.; Bhanger, M. I.; Anal. Chim. Acta
2009,638, 146.
20. Nadeem, M.; Mahmood, A.; Shahid, S. A.; Shah, S. S.; Khalid, A. M.; McKay, G.; J. Hazard. Mater.2006,138, 604.
21. Mall, I. D.; Srivastava, V. C.; Agarwal, N. K.; Dyes Pigm.2006,
69, 210.
22. Langmuir, I.; J. Am. Chem. Soc.1918,40, 1361. 23. Freundlich, H. M. F.; J. Phys. Chem.1906, 57, 385.
24. Saeed, M. M.; Hasany, S. M.; Ahmed, M.; Talanta1999,50, 625.
25. Analytical Methods Committee; Analyst1987,112, 199. 26. Tartarotti, F. O.; Oliveira, M. F.; Balbo, V. R.; Stradiotto, N. R.;
Microchim. Acta2006, 155, 397.
27. Teixeira, L. S. G.; Brasileiro, J. F.; Borges Junior, M. M.; Cordeiro, P. W. L.; Rocha, S. A. N.; Costa, A. C. S.; Quim. Nova2006, 29, 741.
28. Gaubeur, I.; Areias, M. C. C.; Terra, L. H. S. A.; Suárez-Iha, M. E. V.; Spectrosc. Lett. 2002,35, 455.
29. Lurie, J.; Handbook of Analytical Chemistry, English Translation, Mir Publishers: Moscow, 1975.
30. Associação Brasileira de Normas Técnicas ABNT.; Ethanol - Determination of Iron and Copper Content - Flame Atomic
Absorption Spectrometric Method, NBR 11331, 2007. http://www.abntcatalogo.com.br/norma.aspx?ID=38521 31. Lemos, V. A.; Vieira, D. R.; Novaes, C. G.; Rocha, M. E.; Santos,
M. S. S.; Yamaki, R. T.; Microchim. Acta2006,153, 193.
32. Yebra, M. C.; Carro, N.; Moreno-Cid, A.; Spectrochim. Acta, Part B2002, 57, 85.
33. Oliveira, M. F.; Saczk, A. A.; Okumura, L. L.; Stradiotto, N. R.; Energy Fuels2009,23, 4852.
34. Saint`Pierre, T.; Aucélio, R. Q.; Curtius, A. J.; Microchem. J.
2003,75, 59.
35. Matsuokaa, S.; Yoshimura, K.; Anal. Chim. Acta2010,664, 1.
Submitted: June 30, 2010
Published online: November 4, 2010