On the Transferability of the SPC/L Water
Model to Biomolecular Simulation
Alice Gl¨attli
†, Chris Oostenbrink
†, Xavier Daura
‡, Daan P. Geerke
†,
Haibo Yu
†, and Wilfred F. van Gunsteren
††
Laboratory of Physical Chemistry, Swiss Federal Institute of Technology Z ¨urich, ETH-H¨onggerberg, CH-8093 Z¨urich, Switzerland
‡
Instituci´o Catalana de Recerca i Estudis Avancats (ICREA) and Institute of Biotechnology and Biomedicine,
Universitat Aut`onoma de Barcelona, E-08193 Bellaterra, Spain
Received on 08 September, 2003.
We investigated the performance of the recently developed SPC/L model for liquid water, as a pure liquid, in binary mixtures with DMSO, and as a solvent model in a peptide folding simulation. Additionally, in order to test the compatibility with the GROMOS biomolecular force field, free energies of hydration of a set of representative compounds were computed. The results are compared to those for the well established SPC water model, which is generally used as a solvent model in conjunction with the GROMOS force field already for more than two decades. It turns out that as a pure liquid and in binary mixtures with DMSO the SPC/L model outperforms SPC, whereas as solvent in combination with the GROMOS force field both models perform equally well.
1
Introduction
Water is the most abundant compound on the surface of the Earth and the principal constituent of all living organisms. Consequently, it plays a key role in environmental science, industrial technology and biology. Most of the living species contain a large amount of water, varying from 97 % to less than 50 %. The role of water is to act as the most important constituent of body fluids and as a solvent for all kinds of biomolecules. It plays an important role in many biological processes such as molecular transport, folding and aggrega-tion of biopolymers, enzyme-substrate binding and catalysis [1]. On the other hand, water is also one of the substances with most peculiar properties: Water contracts on melting, shows a density maximum in the liquid phase at 4◦C and
1 atm pressure, has high melting, boiling and critical tem-peratures, and a large dielectric constant [2]. It is, therefore, not surprising that water is the liquid by far most studied by computer simulation. Since the first molecular dynamics (MD) simulation of water in 1971 by Rahman and Stillinger [3] a large number of water models have been developed. However, none of the model potentials proposed in the last thirty years is able to reproduce all the properties of water (for a recent review see reference [4]). While there are only a fewab initiomodels, which explicitly include a quantum-mechanical description of the valence electrons, described in the literature [5, 6, 7, 8], most of the models are empiri-cal. They are based on interaction functions and force fields, which are obtained by fitting a suitable functional form to mostly experimental data, but in some cases also to data ex-tracted from ab initio calculations [9]. These models are simpler and computationally less expensive than ab initio
models and therefore more commonly applied. The group of empirical models can be divided into flexible and rigid water models, depending on whether the vibrational degrees of freedom are included or not, and into polarizable or non-polarizable models, depending whether the model explictly accounts for polarization or not. Early effective pair poten-tials for water such as the rigid SPC (simple point charge, with three interaction sites) [10], SPC/E (extended SPC) [11], TIP3P (transferable intermolecular potential with three interaction sites) or TIP4P (TIP with four interaction sites) [12] models describe the thermodynamic, structural and dynamical properties under near-ambient conditions quite well [13], but fail to reproduce the liquid-vapor coexistence curve [14, 15] and the temperature of the density maximum [16, 17]. It turned out that refining the SPC/E model to im-prove the agreement with experimental values for saturated densities and vapor pressure resulted in a model that fails to reproduce the second peak of the oxygen-oxygen radial distribution functiongOO(r)indicating a loosening of the
as most of the other models. Explicit introduction of polar-izability did up to now not show the desired improvement. Polarizable models generally overestimate the dielectric per-mittivity [4, 23] and do not better describe the coexistence curve, in some case even worsen it [24, 25, 26, 27]. Thus, the connection between the microscopic structure of water and its macroscopic properties is still not fully elucidated and the development of the “ultimate” water model remains a challenge for computational physics and chemistry.
The investigation of the stability and dynamics of a biomolecule clearly requires to explicitly account for sol-vent degrees of freedom [28]. In a system consisting of a protein in solution a large fraction of the system is repre-sented by solvent molecules. Since in general the protein is of primary interest, the model used to represent the sol-vent should be computationally as cheap as possible, yet re-produce the basic features of the real solvent well enough. Modeling solvent effects by an implicit representation of the solvent is computationally most efficient, but has shown in some cases to stabilize conformers other than the native structure [29] and to lead to a less realistic dynamic be-haviour than an explicit treatment of the solvent degrees of freedom [30]. Suitable water models for use as a sol-vent in a biomolecular simulation are models that are not only computationally efficient and reproduce the properties of bulk water sufficiently well, but should also be compati-ble with the force field employed to describe the solute in-teractions. Although simple effective pair potentials such as SPC, TIP3P and TIP4P are not able to accurately describe the whole range of water properties, they have proven to successfully model water as a solvent in biomolecular sim-ulation. Their major weakness is the overestimation of the diffusion coefficient and the incomplete description of the dielectric properties. Introducing a correction for the self-polarization energy in the effective pair-potential improved this situation. The extended SPC model (SPC/E) shows both a dielectric permittivity and a diffusion coefficient close to the experimentally measured values [11, 13]. However, it turned out to be less suited for combination with current biomolecular force fields, since these do not include the proper environment-dependent self-polarization correction. [31, 32].
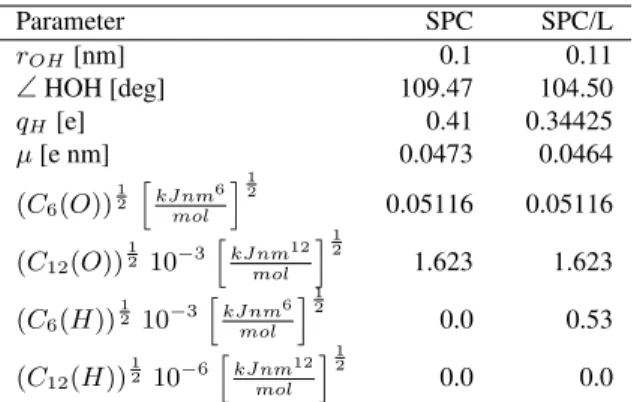
We recently investigated different approaches to refine the SPC water model in order to obtain a model with overall improved properties at room temperature and ambient pres-sure [33, 34]. A simultaneous improvement of diffusion and dielectric properties appeared to be difficult within the class of rigid, nonpolarizable models and without increasing the number of interaction sites [33]. Among the collection of SPC-like water models presented, one model, SPC/L, rep-resents a clear improvement over SPC in the properties of bulk water. However, the question of its range of applica-tion is still open. Compared to SPC, SPC/L is characterized by a longer bond length, a smaller bond angle, a smaller par-tial charge and an attractive van der Waals interaction term for the hydrogen atoms (see Table 1). It is especially the much lower partial charges that might make it incompatible with the GROMOS force field. Here, we wish to investigate the performance of the SPC/L water model as a solvent in
biomolecular simulation.
After a brief description of the SPC/L model and its pure liquid properties, the performance of SPC/L is tested and compared to that of SPC when combined with dimethyl-sulfoxide (DMSO) to a binary mixture and as a solvent in calculations of the free energy of hydration of a number of different compounds. Co-solvents are in practice often used to steer processes such as (un)folding of proteins, membrane permeation, or cell fusion. Consequently, a water model for use in biomolecular simulation should also perform well in binary mixtures with commonly used co-solvents such as DMSO. Finally, we compare the two water models, SPC and SPC/L, in a simulation of the folding/unfolding of aβ-heptapeptide with the sequence H-β-HVal-β-HGlu-β -HLys∗-β-HVal-HLys∗-β-HGlu–β-HVal. (see Fig. 3, panels
A and B). Note that Lys∗stands for a lysine residue with one
carbon atom less in the side-chain. This peptide is shown by NMR to form a left-handed 314-helix in aqueous solution [35] (see Fig. 3, panels A and B). The totality of these tests should give an impression of the performance of SPC/L as a solvent in biomolecular simulation and of its compatibility with the current version of the GROMOS force field [36]. Table 1. Parameters of the SPC and SPC/L water models. rOH:
OH bond length,∠HOH: HOH bond angle, qH: partial charge
on the hydrogen atom2qH =−qO,C6: attractive Lennard-Jones
coefficient,C12: repulsive Lennard-Jones coefficient.
Parameters of the SPC and the SPC/L water models
Parameter SPC SPC/L
rOH[nm] 0.1 0.11
∠HOH [deg] 109.47 104.50
qH[e] 0.41 0.34425
µ[e nm] 0.0473 0.0464
(C6(O))12
h
kJ nm6
mol
i12
0.05116 0.05116
(C12(O))12 10−3
h
kJ nm12
mol
i12
1.623 1.623
(C6(H))12 10−3
h
kJ nm6 mol
i12
0.0 0.53
(C12(H))12 10−6
h
kJ nm12 mol
i12
0.0 0.0
2
Methods
2.1
Pure liquid and binary mixture
simula-tions
For both water models, SPC and SPC/L, MD simulations of pure water and of DMSO-water mixtures at six compo-sitions, with DMSO fractions xDM SO of 1, 0.814, 0.478,
pressure were kept constant by weakly coupling them to a temperature bath at 298 K and to a pressure bath at 1 atm, respectively [40]. The relaxation time for the temperature coupling was set to 0.1 ps, for the pressure coupling to 0.5 ps. The isothermal compressibilities for pure water and pure DMSO were set equal to the experimental values of 7.513 10−4
[(kJ mol−1 nm−3
)−1
] [41] and 8.718 10−4
[(kJ mol−1 nm−3
)−1
] [42]. In the case of mixtures, a linear combina-tion of these two values was taken.
The equations of motion were integrated using the leap frog algorithm and a time step of 2 fs. The pair-wise interaction energy function is expressed by a sum of a Lennard-Jones and a Coulomb term:
U(rij) =
C12(i, j) r12
ij
−C6(i, j)
r6
ij
+ qiqj 4πǫ0rij
(1) whererij is the distance between atomsi andj, qi is the
charge of atom i, ǫ0 is the dielectric permittivity of vac-uum, andC6(i, j) andC12(i, j)are, respectively, the dis-persion and repulsion Lennard-Jones coefficients for the in-teraction between atomsi andj. The interaction between atoms of pairs of molecules was calculated according to a spherical triple-range cutoff scheme: Short-range van der Waals and electrostatic interactions were evaluated at every time step by using a molecular-pair list that was generated with a short-range cutoff radius of 0.8 nm. Longer range van der Waals and electrostatic interactions, between molecules with the oxygen atoms at a distance longer than 0.8 nm and shorter than a long-range cutoff of 1.4 nm, were evaluated every fifth time step, at which point the pair list was also up-dated, and were kept unchanged between these updates. To approximate the electrostatic interactions beyond the long-range cutoff (Rcl = 1.4nm), a reaction field term [43, 44],
URF, was included in (1):
URF(rij) =
qiqj
4πǫ0 "
(ǫRF−1)r
2
ij
(2ǫRF+ 1)Rcl3
− 3ǫRF
(2ǫRF+ 1)Rcl
#
(2) For the simulations of pure water and DMSO, the dielectric constant of the continuum outsideRcl,ǫRF, was set equal
to the experimental values of 78.5 [45] and 46 [42], respec-tively. For the mixtures, a linear combination of these values was taken. At the beginning of the simulation the velocities of the atoms were assigned from a Maxwell-Boltzmann dis-tribution at 298 K.
For pure water, 100 ps equilibration were followed by 3 ns simulation from which a range of bulk properties (see Ta-ble 2) were calculated as described in reference [33]. For the DMSO-water mixtures and pure DMSO, after an equilibra-tion time of 500 ps, data were collected for 2 ns to evaluate the heat of mixing∆Hmix, the excess molar volume of
mix-ing ∆Vmix, the diffusion coefficient of water and DMSO
molecules, and the shear viscosity of the system [38].
Table 2. Bulk water properties of the SPC/L model compared to those of the SPC model and experimentally derived data. T: av-erage temperature of the run,ρ: density,∆Hvap: heat of
vapor-ization,∆Fexs: excess Helmholtz energy. aThis was recomputed
using equation 3, which is slightly different from the one used in reference [33]. Cp: heat capacity at constant pressure,α: thermal
expansion coefficient,κT: isothermal compressibility,r1,g(r1):
position and height of the first maximum of the oxygen-oxygen radial distribution function in the liquid phase, r2, g(r2): posi-tion and height of the second maximum,rmin: minimum energy
oxygen-oxygen distance of the water dimer in the gas phase,Emin:
energy minimum of the water dimer,D: self-diffusion coefficient, τlα: rotational relaxation times of different axes,η: mean value of
the shear viscosity, obtained by averaging over the values forηthat have been calculated from the three independent off-diagonal com-ponents of the pressure tensor,ǫ(0): dielectric permittivity,Gk:
finite-system Kirkwood factor,gk: infinite-system Kirkwood
fac-tor,τD: Debye dielectric relaxation time.
Properties of the SPC and SPC/L water models
Property SPC SPC/L Exp.
T[K] 300.7 299.1 298.15
ρ[g cm−3] 0.972 0.997 0.99741 ∆Hvap[kJ mol−
1
] 43.7 43.95 44.060 ∆Fexs[kJ mol−
1
] 22.7 22.3a 24.050 Cp[J mol−
1 K−1
] 75.6 75.3 75.345 α10−4[K−1] 7.3 7.5 2.041 κT10−
6
[atm−1] 47.4 50.2 45.841 r1[nm] 0.278 0.273 0.27361 g(r1) 2.837 2.875 2.75061 r2[nm] 0.452 0.431 0.45061 g(r2) 1.070 1.076 1.16161
rmin[nm] 0.275 0.273
-Emin[kJ mol] -27.57 -27.37
-D10−9 [m2
s−1
] 4.2 3.9 2.362
τ1HH[ps] 2.9 2.9
τ2HH[ps] 1.7 1.9 2.0 63
τOH
1 [ps] 3.0 3.3
τOH
2 [ps] 1.6 1.7 1.95
64−67 τ1µ[ps] 3.2 3.5
τ2µ[ps] 1.4 1.7 1.92 68
η[cp] 0.49 0.59 0.8545 µ[e nm] 0.0473 0.0464
ǫ(0) 66.6 73.8 78.545
Gk 2.64 2.96
gk 2.51 2.91 2.90
69
τD[ps] 6.2 7.9 8.3
70
2.2
Free energies of hydration
toλ= 1of< ∂H/∂λ >λat every value ofλ. At
interme-diateλ-values all nonbonded interactions were made soft in order to remove singularities at the origin (rij = 0), which
would have led to extremely high energies for partially inter-acting particles[46]. Effectively, the nonbonded interaction functions of equations (1) and (2) can be written as
⌋
U(rij) = (1−λ)
(
C12(i, j)
(αLJλ2C126+r6ij)2
− C6(i, j) (αLJλ2C126+rij6)
+
qiqj
4πǫ0 "
1 (αCλ2+rij2)
1 2
− (ǫRF−1)r
2
ij
(2ǫRF+ 1)(αCλ2+R2cl)
3 2
−
3ǫRF
(2ǫRF + 1)Rcl
¸¾
(3)
⌈
where both the van der Waals and Coulombic soft-core-parameters were set to αLJ = 0.5 and αC = 0.5 nm
2 , respectively, and C126 was defined as C12/C6. For inter-actions involving the SPC/L hydrogen (for whichC12 = 0) this parameter was set to
C126= 1000 µ
αLJλ2C6 kBT(1−αLJλ2)
¶
(4) avoiding the occurrence of spurious minima in the solute-solvent interaction energy. In the calculations involving the neopentane shaped cavity, whereC6= 0,C126was set to
C126= s
C12 kBT(1−αLJλ2)
(5)
The reaction field permittivityǫRF was set to 66.6 for these
simulations.[33]
The solute models were described by standard GRO-MOS parameters (parameter set 45A3) [37, 47]. Bond lengths were constrained using the SHAKE algorithm[39], but bond angles and torsional and improper dihedral angles were described by standard potential energy functions[37]. The solutes were placed in periodic truncated octahedral boxes containing 691 to 951 solvent molecules. The box sizes were chosen such that no solvent molecule could si-multaneously interact with two periodic copies of the solute at any time during the simulation.
2.3
β
-peptide in aqueous solution
The β-heptapeptide was modeled using the GROMOS96 biomolecular force field, parameter set 45A3 [37, 47], along the lines described by Daura et al. [48]. Starting from a fully extended structure (all backbone dihedral angles were set to 180◦) the peptide was solvated in a truncated
octa-hedron with 3919 SPC and in one with 3877 SPC/L water molecules, respectively. The initial minimum distance be-tween peptide atoms and the square walls of the truncated octahedron was chosen to be 1.4 nm.
After relaxation of the systems using steepest descent energy minimization the MD simulations were started by
taking the initial velocities from a Maxwellian distribution at 298 K. The isothermal compressibility was set to 7.768 10−4 (kJ mol−1nm−3)−1for the simulation in SPC and to 8.227
10−4
(kJ mol−1 nm−3
)−1
for the simulation in SPC/L, ac-cording to the values for the isothermal compressibility of the bulk liquid calculated for both models[33]. While the geometry of the solvent was kept rigid, for the solute only the bond lengths were constrained using the SHAKE algo-rithm [39]. Otherwise the above described simulation proto-col was followed. Data were proto-collected for 50 ns for analysis. A conformational cluster analysis was performed using the structures at every 0.01 ns as described by Dauraet al.
[49]. To that end the atom-positional root-mean-square de-viation (rmsd) using the backbone atoms of residues 2 to 6 was calculated for every pair of structures. For each trajec-tory structure the number of structures (neighbours) with a rmsd≤0.1 nm was determined. The structure with the high-est number of (structural) neighbours was then taken as the central member of the cluster of similar structures forming a conformation. After removing the structures belonging to this first, most popula ted cluster from the pool of structures the procedure was repeated to find the second cluster and so on.
3
Results and Discussion
3.1
Properties of SPC/L as pure liquid
0.5 1 1.5 2 2.5 3
g(r
OO
)
0.5 1 1.5 2
g(r
OH
)
0.0 0.2 0.4 0.6 0.8 1.0 r [nm]
0.5 1 1.5 2
g(r
HH
)
Figure 1. Liquid phase radial distribution function g(r) for the oxygen-oxygen, oxygen-hydrogen and hydrogen-hydrogen pairs of the SPC (dashed line) and SPC/L (dot-dashed line) water models along with the curve (solid line) derived from experiment [61].
model was originally developed using a significantly differ-ent simulation protocol (smaller periodic box, smaller cut-off, no reaction field and very short simulation time)[10], it underestimates the experimentally measured value for the density by about 3%using the simulation protocol described in section 2.1. The SPC/L model shows similar thermody-namic properties as SPC, which compare well to the ex-perimentally measured values: The heat capacities Cp of
both models (SPC: 75.6 J mol−1 K−1
, SPC/L: 75.3 J mol−1 K−1
) accurately reproduce the experimental value of 75.3 J mol−1K−1. However, the thermal expansion coefficientα
is for both models much larger than the experimental value of 2.0 10−4
K−1
, indicating that with increasing temperature the density of SPC and SPC/L decreases faster than exper-imentally observed. The isothermal compressibility κT of
SPC/L is 50.2 10−6 atm−1
overestimating the experimental value by 9.6%, while SPC with aκT of 47.4 10−
6 atm−1
shows only a 3.5% larger compressibility than experiment. The excess free energy of SPC/L (22.3 kJ mol−1
) calcu-lated using equation (3) compares well to the value of 22.7 kJ mol−1
obtained for SPC, but is slightly lower than the experimentally derived value [50] of 24.0 kJ mol−1
. The structural properties of water reflected in the radial distri-bution functions for the oxygen-oxygen, oxygen-hydrogen and hydrogen-hydrogen pairs are equally well reproduced by both models (see Table 2 and Fig. 1). The second and third peak of the oxygen-oxygen radial distribution function are in both cases not as pronounced as suggested by exper-iment. For SPC/L, the first peak of the oxygen-hydrogen distribution function is observed to lie slightly too inward, which is probably due to the lengthening of the OH bond length, which for the same density implies a reduction of the distance between the hydrogen atoms and the nearest oxygen to which they are not covalently bound. In terms of diffusion properties such as self-diffusion and rotational relaxation times of HH, OH and water dipole axes, SPC/L shows a slight improvement over SPC, but still diffuses too fast compared to experiment. The shear viscosity for SPC/L was calculated to be 0.59 cp, which signifies an improve-ment over the SPC model. The latter model underestimates the experimental value for the shear viscosity by more than 40%. Even though the dipole moment of SPC/L is smaller than the one of SPC, its dielectric properties show a clear im-provement. Its permittivity, infinite-system Kirkwood fac-tor and Debye relaxation time compare very well to the ex-perimental values. The smaller bond angle combined with the introduction of purely attractive van der Waals interac-tion sites are thought to cause this improvement in dielectric properties as discussed in reference [33]. In summary, while SPC/L has similar thermodynamic and structural properties as SPC, its diffusion properties are slightly closer to the ex-perimental values and it shows a clear improvement in the dielectric properties and the viscosities.
3.2
Performance of SPC/L in DMSO-water
mixtures
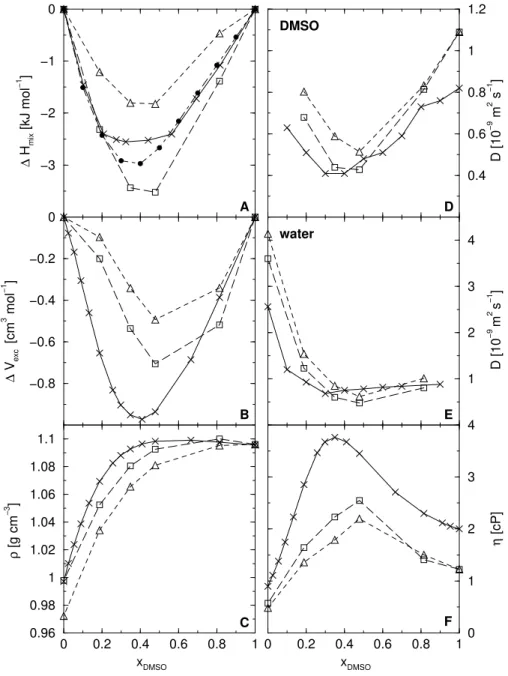
DMSO-water mixtures are non-ideal mixtures. It is ex-perimentally known that the mixing enthalpy,∆Hmix, and
the excess volume of mixing,∆Vexc, are negative over the
complete range of mole fraction DMSO, xDM SO[51, 52].
Adding DMSO to water slows down the self-diffusion of the water molecules and vice versa [53]. Accordingly, the shear viscosity for the mixtures is larger than for the pure liquids[51]. As shown in Figs. 2A-F, both water models, SPC and SPC/L, in combination with the DMSO model by Geerkeet al.[38] reflect the non-ideal behaviour of DMSO-water mixtures over a wide range of mole fraction xDM SO.
that the DMSO-water interactions are slightly better mod-eled by the DMSO-SPC/L model than by the DMSO-SPC model. Figs. 2D and 2E reflect the mobility of the DMSO and the water molecules, respectively, as a function of the molar fraction, xDM SO. The effect of slowing down the
self-diffusion of the water and DMSO molecules is well re-produced for both water models. Similarly, the change in shear viscosity of the DMSO-water mixture as a function of its composition, displayed in Fig. 2F, qualitatively repro-duces the experimental curve, but underestimates the viscos-ity of the system at any composition, This is probably due to the fact that the shear viscosity for the pure liquids is
un-derestimated by both water models as well as by the DMSO model used [38]. For the diffusion properties and the shear viscosity, the DMSO-SPC/L model again performs slightly better than DMSO-SPC. This has also been reported for the relaxation times of the DMSO dipole moment vector and the O-H bond of the water molecules in DMSO-water mix-tures at various compositions and as well as for the static dielectric permittivity of the DMSO-water system [38]. The overall better performance of the DMSO-SPC/L model is only partly due to the improved pure liquid properties of the SPC/L water model compared to SPC. SPC/L seems also to be slightly more compatible with the DMSO model used.
0 0.2 0.4 0.6 0.8 1
xDMSO
0 1 2 3 4
η
[cP]
0 0.2 0.4 0.6 0.8 1
xDMSO 0.96
0.98 1 1.02 1.04 1.06 1.08 1.1
ρ
[g cm
−3 ]
0.4 0.6 0.8 1 1.2
D [10
−9 m 2 s −1 ]
−3 −2 −1 0
∆
H
mix
[kJ mol
−1 ]
−0.8 −0.6 −0.4 −0.2 0
∆
Vexc
[cm
3 mol −1 ]
1 2 3 4
D [10
−9
m
2 s −1 ] A
B
D
E
C F
DMSO
water
Figure 2. Thermodynamic and dynamic properties of DMSO-water mixtures at 298 K and 1 atm, as function of the mole fraction DMSO, xDM SO, using the DMSO model by Geerkeet al.[38] in combination with the SPC (△) and SPC/L (✷) models: (A) enthalpies of mixing
∆Hmix; (B) excess volume of mixing∆Vexc; (C) densitiesρ; (D) diffusion coefficient D of the DMSO molecules; (E) diffusion coefficient
3.3
Free energies of hydration in SPC and
SPC/L
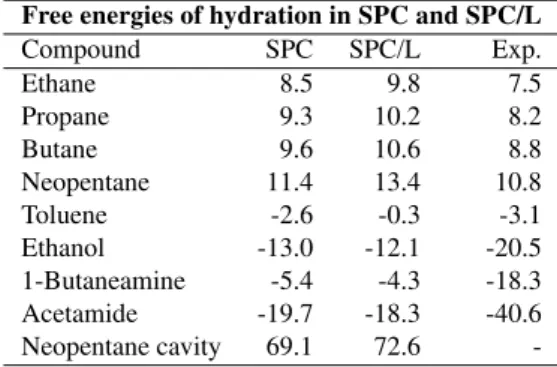
The calculated free energies of hydration in both SPC and SPC/L are compared in Table 3. Experimental values are also listed in this table. In all cases the value obtained for solvation in SPC/L is slightly larger than the one for SPC. When comparing to the experimental data, it is clear that for the three polar compounds the free energies of hydration are strongly underestimated. This was observed for virtually all polar groups that occur in amino acid side chains [54] and was the main driving force for an extensive recalibration of the nonbonded interaction parameters of the polar atoms in the GROMOS force field [55]. Changing the solvent model from SPC to SPC/L, which behaves so similar in its bulk properties, does not correct these large discrepancies with experiment, as expected. Rather, the only slightly different free energies of hydration indicate that the SPC/L model is generally compatible with the GROMOS force field, which has proven itself in many applications of biomolecular sim-ulation.
Table 3. Free energy of hydration for selected compounds in SPC and SPC/L. All values in kJ mol−1. The experimental values for the aliphatic compounds correspond to values averaged over exper-imental data from references [57] and [58]. The experexper-imental val-ues for the polar compounds were derived from equilibrium con-stants between their dilute aqueous solutions and the vapour phase presented in reference [59].
Free energies of hydration in SPC and SPC/L
Compound SPC SPC/L Exp.
Ethane 8.5 9.8 7.5
Propane 9.3 10.2 8.2
Butane 9.6 10.6 8.8
Neopentane 11.4 13.4 10.8
Toluene -2.6 -0.3 -3.1
Ethanol -13.0 -12.1 -20.5 1-Butaneamine -5.4 -4.3 -18.3 Acetamide -19.7 -18.3 -40.6 Neopentane cavity 69.1 72.6
-A naive comparison of the free energies of solvation in both water models, might lead to the expectation that the val-ues obtained for SPC/L should be rather lower than higher. Especially for those solutes that do not possess a dipole in the GROMOS force field such as ethane, propane, butane and neopentane, the solute-solvent interactions involve an additional, purely attractive interaction with the hydrogen atoms and an otherwise unchanged van der Waals interac-tion with the oxygen when going from SPC to SPC/L. The slightly increased density of SPC/L (3%) may hardly ac-count for the observed differences in free energies.
For a closer inspection, we have determined the free en-ergy of the formation of a neopentane shaped cavity. Since the atoms that form this cavity only interact through the repulsive C12 term in equation (1), the interaction with a given water molecule is the same, regardless of whether SPC or SPC/L is used. The free energy difference of 3.5 kJ mol−1
can then be traced to two sources. The first ef-fect is enthalpic; the solute-solvent interaction energy of the
cavity changes from 13.2 kJ mol−1(SPC) to 14.7 kJ mol−1
(SPC/L), which can be explained from the increased den-sity of the SPC/L model, resulting in a slightly larger num-ber of (purely repulsive) solute-solvent interactions. The re-maining 2 kJ mol−1
difference in the solvation of the cavity can then only be explained in terms of entropic effects. Ap-parently it is more difficult to break up the hydrogen bond network to create a cavity in SPC/L than in SPC. For real compounds, interacting fully with all atoms of the solvent models, the first term is offset by an increased attraction due to the hydrogens and attractive solute-solvent oxygen terms, but the entropic term involved in the cavity formation is still likely to give an unfavourable contribution to the free energy of solvation, when going from SPC to SPC/L.
3.4
Simulation of
β
-heptapeptide folding in
SPC and SPC/L
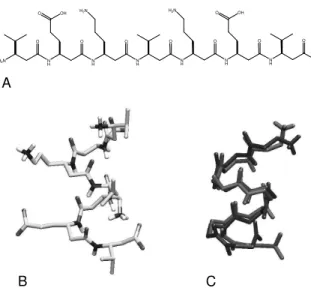
Theβ-heptapeptide displayed in Fig. 3 was simulated with each of both water models as an attempt to compare their performance as a solvent model for water. In both simu-lations, the peptide folds within the first 10 ns into a left-handed 314-helix and thereafter repeatedly unfolds and folds into its helical structure, as illustrated (see Fig. 4, panel A) by the rmsd of the backbone atoms from the NMR model structure displayed in panel B of Fig. 3. Consequently, the most populated conformer corresponds in both cases to the 314-helix (see panel C of Fig. 3). In SPC, the helix is to67%
populated while in SPC/L to 80%. On the other hand the average lifetime of the most populated conformer is found to be shorter in SPC/L (0.44 ns) than in SPC (0.80 ns). These differences in lifetime and population might be rather due to insufficient sampling than due to the differences in the water models. Previousβ-peptide folding studies have illustrated that extending the simulation from 50 ns to 200 ns for in-stance significantly changes the ratio between populations of folded and unfolded conformation [48, 49, 56]
A conformational cluster analysis of the combined tra-jectories shows that the peptide populates more or less the same conformational space in both water models. A total of 44 clusters was found. The two most populated clusters represent more than 85%of the total population. The pop-ulation of the first 10 clusters (larger than 96%of the total population) and the portion of structures in these clusters originating from the trajectory in SPC or the one in SPC/L are shown in Panel B of Fig. 4. The first cluster, of which 54% of the members belong to the simulation in SPC/L, corresponds to the 314-helix, whereas cluster 2 represents a group of essentially unfolded structures. Clusters 3 and 7 show partly unfolded helices. While the first five clusters contain structures from both trajectories, the clusters 6, 7, 9 and 10 hold exclusively structures of one or the other tra-jectory. However, the latter group of clusters represent each only 1%or less of the total population.
B C A
N H H2N N
H O
N H O
N H O
N H O
N H O O O
H2N
OH H2N
OH
O O OH
Figure 3. Molecular formula and structure of theβ-heptapeptide studied in conjunction with the SPC and SPC/L water models. (A) Molecular formula of theβ-heptapeptide. Note that in the simu-lations the N-terminus as well as theβ-lysine type of side-chains were protonated, whereas the C-terminus and theβ-glutamate side-chains were deprotonated in line with the experimental data. (B) NMR model structure of the β-heptapeptide in water[35]. The salt-bridges between theβ-lysine∗and theβ-glutamate side-chains
favour the formation of a left-handed 314-helix. (C) Central mem-ber structure of the most populated cluster of theβ-heptapeptide in SPC (blue) and in SPC/L (red). In both water models the most populated conformer corresponds to the 314-helix. For clarity, only the backbone atoms are drawn.
intramolecular hydrogen bonds are of the type that forms 14-membered hydrogen bonded rings characteristic for the structure. Using the standard GROMOS definition, where a hydrogen bond is considered to exist when the donor-hydrogen-acceptor angle is larger than 135◦ and the
hydrogen-acceptor distance is less than 0.25 nm, it appears that the C-terminal hydrogen bonds occur more often in SPC than in SPC/L, while the N-terminal hydrogen bonds are more frequently formed in SPC/L. The average number of all intramolecular hydrogen bonds per trajectory structure (averaged over the last 30 ns of the trajectory) is slightly larger in SPC, while the average number of intramolecu-lar hydrogen bonds forming 14-membered hydrogen bonded rings is about the same in both solvents. Accordingly, the average number of intermolecular hydrogen bonds between the peptide and the water molecules per trajectory configu-ration is in SPC slightly lower than in SPC/L.
While the conformational and dynamic properties of the peptide are essentially the same in both water models, the energetics of the two systems directly reflect the differences between the two water models (see Table 4). Due to the ad-ditional attractive van der Waals interaction site on the wa-ter hydrogen atoms in SPC/L, the peptide-wawa-ter and the water-water van der Waals interaction energies are more favourable. On the other hand, the total electrostatic contri-bution to the nonbonded energy is for SPC/L less negative,
Figure 4. Comparison of the conformational preference of theβ -heptapeptide when simulated with the SPC or SPC/L water model. (A) Root-mean-square deviation (rmsd) of the backbone atoms (N, CB, CA, C) of residues 2-6 from the (helical) NMR model struc-ture. Black: Simulation in SPC. Red: Simulation in SPC/L. (B) Clustering of the combined trajectories of theβ-heptapeptide in SPC and SPC/L. The plot shows the population in percentage per cluster and the portion of structures per cluster that belong to the trajectory of the peptide in SPC (black) and in SPC/L (red).
which is due to its lower partial charges. Nevertheless, the electrostatic interaction energy between the peptide and the solvent is more favourable for the SPC/L system. This can be explained by the larger density of SPC/L, which re-sults in a larger number of water molecules inside the cut-off radius.
4
Conclusion
Table 4. Hydrogen bonding and energetics of theβ-heptapeptide in SPC and SPC/L. Occurrence of hydrogen bonds in%, the residue sequence number is indicated between parentheses. NH(i)-O(i+2): occurrence of hydrogen bonds characteristic for a 314-helix. No other significantly populated hydrogen bonds (≥5%) were ob-served. HB(p-p): average number of intramolecular hydrogen bonds per trajectory structure (peptide-peptide). HB14(p-p): av-erage number of hydrogen bonds forming 14-membered rings. HB(p-w): average number of intermolecular hydrogen bonds per trajectory configuration (peptide-water). Both numbers were ob-tained by averaging over the last 30 ns of each trajectory. Utot:
total energy of the system. Ukin: total kinetic energy. Upot: total
potential energy. Ubon: total covalent energy. UvdW: total van der
Waals interaction energy. Uele: total electrostatic interaction
en-ergy including the constant and distance-dependent reaction-field contributions. The subscripts p-p, p-w and w-w denote the interac-tion energy between peptide atoms, peptide and solvent atoms and solvent atoms respectively. All energies are in kJ mol−1.
Peptide hydrogen bonds and energetics
Peptide in SPC Peptide in SPC/L
NH(1)-O(3) 9.5 8.7
NH(2)-O(4) 58.6 67.7
NH(3)-O(5) 58.4 69.0
NH(4)-O(6) 61.5 48.2
NH(5)-O(7) 38.2 25.0
HB(p-p) 3.5 3.1
HB14(p-p) 2.3 2.2
HB(p-w) 30.5 31.7
Utot -134640.6 -134381.5
Ukin 29581.7 29135.9
Upot -164222.3 -163517.4
Ubon 201.4 202.1
UvdW 27247.4 23191.5
UvdW−p−p -143.8 -142.4
UvdW−p−w -61.5 -80.0
UvdW−w−w 27452.7 23413.9
Uele -191678.2 -186911.0
Uele−p−p -684.9 -651.5
Uele−p−w -2343.3 -2436.3
Uele−w−w -188643.0 -183823.2
the SPC model. Likewise, in binary mixtures with DMSO the SPC/L model performs slightly better than SPC. It seems that SPC/L is more compatible with the DMSO model by Geerkeet al. [38]. The free energies of hydration of a set of compounds in SPC/L compare well to their correspond-ing values in SPC. The systematic higher free energies in SPC/L can be explained on the one hand by its higher den-sity and on the other hand by its slightly stronger hydrogen bond network. The latter is also reflected in the somewhat lower self-diffusion coefficient, the larger viscosity and the slightly more pronounced local structure of the pure liquid. These findings together with the observation that there is no essential difference in the conformational and dynamic behaviour of a peptide in SPC or SPC/L water lead to the conclusion that SPC/L is as compatible with the GROMOS force field as SPC, while it shows an overall improvement in the bulk water properties as well as in the mixing properties with DMSO.
Acknowledgments
Financial support was obtained from the Schweizer Nationalfonds, project number 2000-063590.00, which is gratefully acknowledged.
References
[1] J. Israelachvili and H. Wennerstr¨om, Nature379, 219 (1996).
[2] Water, a Comprehensive Treatise, edited by F. Franks (Plenum Press, New York, 1972).
[3] A. Rahman and F. H. Stillinger, J. Chem. Phys.55, 3336 (1971).
[4] B. Guillot, J. Mol. Liq.101, 219 (2002).
[5] B. D. Bursulaya and H. J. Kim, J. Chem. Phys.108, 3277 (1998).
[6] B. D. Bursulaya and H. J. Kim, J. Chem. Phys.108, 3286 (1998).
[7] K. Laasonen, M. Sprik, M. Parrinello, and R. Car, J. Chem. Phys.99, 9080 (1993).
[8] P.L. Silvestrelli and M. Parrinello, J. Chem. Phys.111, 3572 (1999).
[9] O. Matsuoka, E. Clementi, and M. Yoshimine, J. Chem. Phys.
64, 1351 (1976).
[10] H. J. C. Berendsen, J. P. M. Postma, W. F. van Gunsteren, and J. Hermans, inIntermolecular forces, edited by B. Pull-man (Reidel, Dordrecht, 1981), p. 331.
[11] H. J. C. Berendsen, J. R. Grigera, and T. P. Straatsma, J. Phys. Chem.91, 6269 (1987).
[12] W. L. Jorgensen, J. Chandrasekhar, J. D. Madura, R. W. Im-pey, and M. L. Klein, J. Chem. Phys79, 926 (1983).
[13] D. van der Spoel, P. J. van Maaren, and H. J. C. Berendsen, J. Chem. Phys108, 10220 (1998).
[14] Y. Guissani and B. Guillot, J. Chem. Phys98, 8221 (1998).
[15] J. Alejandre, D. J. Tildesley, and G. A. Chapela, J. Chem. Phys.102, 4574 (1995).
[16] S.R. Billeter, P.M King, and W.F. van Gunsteren, J. Chem. Phys.100, 6692 (1994).
[17] W. L. Jorgensen and C. Jenson, J. Comp. Chem.19, 1179 (1998).
[18] G. C. Boulougouris, I. G. Economou, and D. N. Theodorou, J. Phys. Chem. B102, 1029 (1998).
[19] J.R. Errington and A.Z. Panagiotopoulos, J. Phys. Chem. B
102, 7470 (1998).
[20] M.W. Mahoney and W.L. Jorgensen, J. Chem. Phys. 112, 8910 (2000).
[21] M.W. Mahoney and W.L. Jorgensen, J. Chem. Phys.114, 363 (2001).
[22] B. Guillot and Y. Guissani, J. Chem. Phys.114, 6720 (2001).
[23] H. Yu, T. Hansson, and W.F. van Gunsteren, J. Chem. Phys.
118, 221 (2003).
[24] A. Wallqvist and P.O. Astrand, J. Chem. Phys. 102, 6559 (1995).
[26] P. Jedlovszky and J. Richardi, J. Chem. Phys. 110, 8019 (1999).
[27] I. M. Svishchev and T.M. Hayward, J. Chem. Phys.111, 9034 (1999).
[28] H. Sch¨afer, X. Daura, A.E. Mark, and W.F. van Gunsteren, Proteins43, 45 (2001).
[29] R. Zhou and B.J. Berne, Proc. Natl. Acad. Sci.99, 12777 (2002).
[30] X. Daura, A.E. Mark, and W.F. van Gunsteren, Comput. Phys. Commun.123, 97 (1999).
[31] D. P. Tieleman and H. J. C. Berendsen, J. Chem. Phys.105, 4871 (1996).
[32] A. R. van Buuren, S.-J. Marrink, and H. J. C. Berendsen, J. Phys. Chem.97, 9206 (1993).
[33] A. Gl¨attli, X. Daura, and W.F. van Gunsteren, J. Chem. Phys.
116, 9811 (2002).
[34] A. Gl¨attli, X. Daura, and W.F. van Gunsteren, J. Comput. Chem.24, 1087 (2003).
[35] M.A. Rueping, Ph.D. thesis, Diss. ETH No. 14677, ETH Z¨urich, Switzerland, 2002.
[36] L.D. Schuler, X. Daura, and W.F. van Gunsteren, J. Comput. Chem.22, 1205 (2001).
[37] W. F. van Gunsteren, S. R. Billeter, A. A. Eising, P. H. H¨unenberger, P. Kr¨uger, A. E. Mark, W. R. P. Scott, and I. G. Tironi,Biomolecular Simulation: The GROMOS96 Manual and User Guide(vdf Hochschulverlag, ETH Z¨urich, Switzer-land, 1996).
[38] D.P. Geerke, C. Oostenbrink, N.F.A. van der Vegt, and W.F. van Gunsteren, J. Phys. Chem. B,in press(2003).
[39] J.-P. Ryckaert, G. Ciccotti, and H. J. C. Berendsen, J. Com-put. Phys.23, 327 (1977).
[40] H. J. C. Berendsen, J. P. M. Postma, W. F. van Gunsteren, A. DiNola, and J. R. Haak, J. Chem. Phys.81, 3684 (1984).
[41] G. S. Kell, J. Chem. Eng. Data12, 66 (1967).
[42] J. A. Riddick, W. B. Bunger, and T. K. Sakano,Organic Sol-vents: Physical Properties and Methods of Purification (Wi-ley, New York, USA, 1986).
[43] M. Neumann, J. Chem. Phys.82, 5663 (1985).
[44] I. G. Tironi, R. Sperb, P. E. Smith, and W. F. van Gunsteren, J. Chem. Phys.102, 5451 (1995).
[45] Handbook of Chemistry and Physics, 56 ed., edited by R. C. Weast (CRC press, Boca Raton, USA, 1976).
[46] T. C. Beutler, A. E. Mark, R. C. van Schaik, P. R. Gerber, and W. F. van Gunsteren, Chem. Phys. Lett.222, 529 (1994).
[47] W. F. van Gunsteren, X. Daura, and A. E. Mark, in En-cyclopaedia of Computational Chemistry, edited by P. von Ragu´e Schleyer (Wiley-VCH, Chichester, 1998), Vol. 2, pp. 1211–1216.
[48] X. Daura, B. Jaun, D. Seebach, W.F. van Gunsteren, and A.E. Mark, J. Mol. Biol.280, 925 (1998).
[49] X. Daura, W.F. van Gunsteren, and A.E. Mark, Proteins: Struct. Funct. & Genet.34, 269 (1999).
[50] J. Hermans, A. Pathiaseril, and A. Anderson, J. Am. Chem. Soc.110, 5982 (1988).
[51] J.M.G. Cowie and P.M. Toporowski, Can. J. Chem.39, 2240 (1961).
[52] J. Kenttamaa and J.J. Lindberg, Suomen Kemist 33, 98 (1960).
[53] K.J. Packer and D.J. Tomlinson, Trans. Faraday Soc.67, 1302 (1971).
[54] A. Villa and A.E. Mark, J. Comp. Chem.23, 548 (2002).
[55] C. Oostenbrink, A. Villa, A.E. Mark, and W.F. van Gunsteren,
for submission toJ. Comp. Chem. (2003).
[56] W. F. van Gunsteren, R. B¨urgi, C. Peter, and X. Daura, Angew. Chemie Intl. Ed.40, 351 (2001).
[57] S. Cabani, P. Gianni, V. Mollica, and L. Lepori, J. Solut. Chem.10, 563 (1981).
[58] A. Ben-Naim and Y. Marcus, J. Chem. Phys.81, 2016 (1984).
[59] R. Wolfenden, L. Andersson, P.M Cullis, and C.C.B. South-gate, Biochemistry20, 849 (1981).
[60] J. P. M. Postma, Ph.D. thesis, Rijksuniversiteit, Groningen, The Netherlands, 1985.
[61] A. K. Soper, Chem. Phys.258, 121 (2000).
[62] K. Krynicki, C. D. Green, and D. W. Sawyer, Faraday Dis-cuss. Chem. Soc.66, 199 (1978).
[63] B. Halle and H. Wennerstr¨om, J. Chem. Phys. 75, 1928 (1981).
[64] J. R. C. van der Maarel, D. Lankhorst, J. de Bleijser, and J. C. Leyte, Chem. Phys. Lett.122, 541 (1985).
[65] R. P. W. J. Struis and J. C. Leyte, J. Phys. Chem.91, 1639 (1987).
[66] T. W. N. Bieze, J. R. C. van der Maarel, and J. C. Leyte, Chem. Phys. Lett.216, 56 (1993).
[67] R. Ludwig, Chem. Phys.195, 329 (1995).
[68] M. S. P. Sansom, I. D. Kerr, J. Breed, and R. Sankararanakr-ishnan, Biophys. J.70, 693 (1996).
[69] M. Neumann, Mol. Phys.57, 97 (1986).
![Figure 1. Liquid phase radial distribution function g(r) for the oxygen-oxygen, oxygen-hydrogen and hydrogen-hydrogen pairs of the SPC (dashed line) and SPC/L (dot-dashed line) water models along with the curve (solid line) derived from experiment [61].](https://thumb-eu.123doks.com/thumbv2/123dok_br/18981088.457045/5.892.171.399.85.709/figure-liquid-distribution-function-hydrogen-hydrogen-hydrogen-experiment.webp)