René Oliemans
Emeritus Professor Multiphase Flow Multi-scale Physics department Delft University of Technology Prins Bernhardlaan 6, 2628 BW DelftThe Netherlands
Oil-Water Liquid Flow Rate Determined
from Measured Pressure Drop and
Water Hold-up in Horizontal Pipes
Stimulated by rapid progress in down-hole measuring techniques production engineers wonder whether in the near-future monitoring of oil/water production rates for horizontal wells can become possible on the basis of measured oil/water pressure losses and water hold-ups. A complicating issue is that these measured data depend on the oil and water flow patterns. The question then is if we use a flow-pattern-dependent model for pressure drop and water hold-up in an inverse mode, what then will be the accuracy by which production rates can be determined? In this review the progress with the inverse modeling will be investigated. Keywords: flow-pattern-dependent models, oil and water production rates, oil-water horizontal flow
Introduction
The option to drill horizontal wells has considerably enhanced the production capability for oil reservoirs. The rapid progress in down-hole measuring techniques may create the possibility to optimize production by combining a preferred set of wells to produce the required volume and fluid mixture. As an alternative to multiphase metering this could become possible when a means is available to measure down-hole multiphase pressure gradients and phase hold-ups and derive from these the production rates of oil/gas/water. To achieve this, a flow-pattern-dependent model for three-phase flow should be used in a reverse mode: from the observed three-phase pressure gradient and phase hold-ups one wants to compute the corresponding production rates. As a prerequisite to such an ambitious project in this review, attention is paid to the flow of oil and water only with emphasis on horizontal wells.
Rodriguez et al. (2004) presented the principle of inverse modeling and applied it to available oil-water horizontal pipe flow data (Elseth, 2001; Trallero, 1995). On the basis of their promising results they performed additional oil-water experiments to enhance the data set with the aim of further model refinements. Guet et al. (2006) used a subset of dispersed flow data from the Rodriguez and Oliemans (2006) measurements to assess the capability of applying the inverse technique to determine oil-water flow rates for that flow pattern. Hadžiabdić and Oliemans (2007a) finally concentrated on horizontal stratified oil/water pipe flow and performed parametric studies for the two-fluid model of that flow pattern to identify model refinements that would improve the calculation accuracy of the oil/water flow rates by the inverse model.
In this review paper, after discussing in section 2 the literature on three-phase oil/water/gas flow in inclined pipes, we will concentrate on horizontal oil/water pipe flow and address the relevant flow-pattern-dependent model capabilities to compute oil/water pressure loss and hold-up. Section 3 deals with the inverse oil/water flow model comparisons with experimental results from oil and brine flow in an 8.28 cm diameter steel pipe, representative of the fluids flowing in an oil well. Oil-water interface phenomena that may contribute to an improved model performance are reviewed in Section 4. This review concludes with an outlook on future research directions.
Nomenclature
dp/dx = pressure gradient, Pa/m Q = volume flow rate, m3/h
Re = Reynolds number, dimensionless Us = superficial velocity, m/s
Greek Symbols µ = viscosity, Pa.s ɛ = hold-up, dimensionless Subscripts
G = gas o = oil w = water
Three-phase Oil/Water/Gas and Two-Phase Oil/Water Pipe Flows
As stated by Hewitt (1997) in his keynote speech, held at the BHR Conference on Multiphase Production in 1997, entitled: “Gas -liquid-liquid flow: a phase too far?” the physics of a three-phase inclined pipe flow condition is still too complex to provide reliable engineering tools. To become more specific let us consider an interesting set of experiments by Oddie et al. (2003) and a comparison with a flow-pattern dependent model. The measurements have been performed in a 0.15 m diameter, 11 m long pipe that could be operated at angles from horizontal to vertical. Observations on flow patterns and liquid hold-up were reported for three-phase (oil-water-gas) and two-phase (water-gas and water-oil) systems. Video, gamma densitometers and 10 electrical probes in a test section were used as measuring devices.
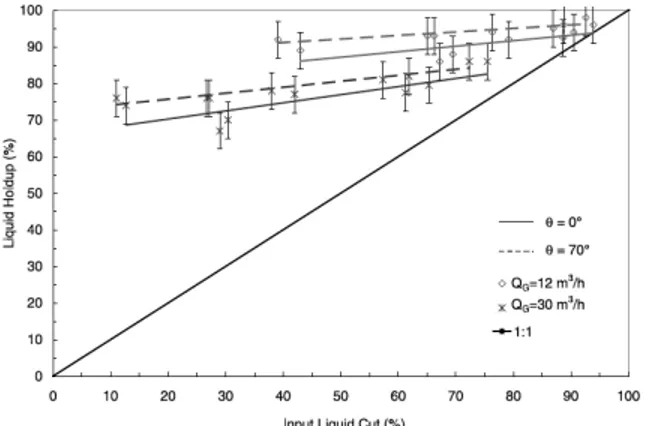
Figure 1 shows for a three-phase system the liquid (oil-water) hold-up for the vertical pipe position (indicated by = 00, i.e. zero degrees deviation from the vertical) and a pipe at 70 degrees from the vertical. It is clear that for both gas rates shown, the measured liquid hold-ups deviate strongly from the 45 degrees line, indicating that the liquid mixture experiences considerable slip. Figure 2 for the oil-water measurements shows that also in this case the water hold-up at modest oil velocities has slip. Only at the highest oil flow rate of 40 m3/h, corresponding to a superficial oil velocity of 0.6 m/s, a no-slip condition is reached. One then wonders whether the assumption of zero slip used in the determination of hold-up values with the gamma densitometer is justified. Apparently, the slip between oil and water for modest oil velocities is quite appreciable and increases when deviating the pipe from the vertical.
Figure 2. Water hold-up for oil-water systems for vertical and 45 degrees inclined flows at three oil rates (Oddie et al., 2003).
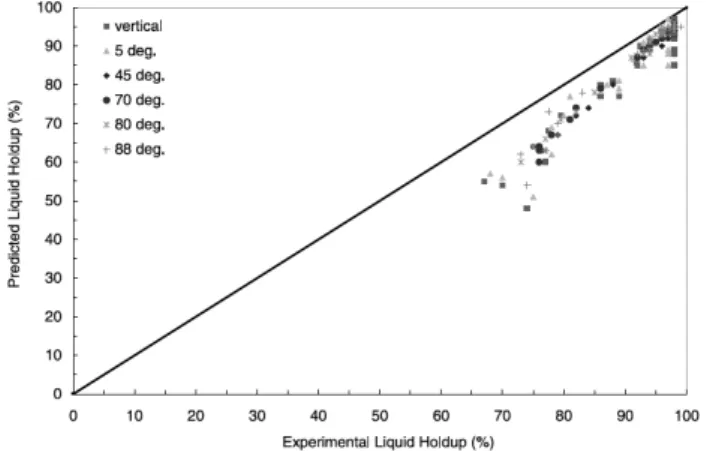
Oddie et al. (2003) subsequently compare their data with the flow-pattern-dependent model from Petalas and Aziz (2000). In order to apply this model, developed and validated for two-phase gas/liquid flow, to their three-phase system they assume the oil and water phases to flow as a homogeneous mixture. As illustrated above this assumption is in conflict with their measurements for oil/water flow. Of course, the gas present could enhance the mixing of the oil and water. However, whether this really happens is not reported. Figure 3 shows the predicted liquid hold-up for the oil-water-gas system at pipe angles ranging from 0 to 88 degrees from the vertical. Note that the liquid hold-up is systematically under-predicted by the model for all pipe angles shown (the gas rate at which these measurements have been obtained has not been indicated, unfortunately).
Figure 3. Predicted liquid hold-up for oil-water-gas systems for vertical and deviated pipe positions (Oddie et al., 2003).
In their paper, Petalas and Aziz (2000) show that for a huge two-phase gas-liquid database for about 60% of the hold-up data their model is capable of predicting the liquid hold-up with an accuracy of 15%. Moreover, the total hold-up data set does not show a bias for under- or over-prediction. The reason for the bias for the three-phase liquid hold-up data that Oddie et al. (2003) report when applying the Petalas-Aziz model to a three-phase system is not clear. It should be noted that also the water hold-up data for the two-phase (water-gas) data of Oddie at al. are systematically under-predicted when they apply this two-phase flow model. The reasons for this bias must be investigated by carefully exploring the experimental procedures and experimental set-up used. A point of concern is the rather low L/D ratio of only 73 of the facility, which could result in data collection at not fully developed two- or three-phase flow conditions. Development lengths are known to vary with flow pattern.
The uncertainties present for measuring and modeling three-phase systems have led the multithree-phase flow community to concentrate on the flow of two liquids (oil and water). The idea is to collect information on such systems to aim insights and models reaching a level of sophistication comparable to that of gas/liquid flows. A next step then would be to combine the two approaches to create a better starting point for three-phase flow engineering models. After the pioneering work on oil-water flow patterns in a horizontal pipe by Trallero (1995), a number of transition criteria have been added by Brauner (2001). Typically in a horizontal oil-water pipe flow one can distinguish the set of flow patterns displayed in Fig. 4.
Figure 4. Artist impression of oil-water flow patterns in a horizontal pipe (Brauner, 2002).
At the flow conditions we meet in horizontal oil wells only a subset of these is considered here: stratified flow subdivided in stratified smooth (ST), stratified wavy (SW), stratified flow with mixing at the interface (ST&MI) and the various dispersed flow patterns: dispersion of oil in water and water (Do/w & w), dispersion of oil in water (Do/w), dispersion of water in oil (Dw/o) and dispersion of water in oil and oil in water (Dw/o & Do/w). In Fig. 4 these can be recognized with labels (a)-(f) and (g)-(j), respectively.
(2004) with a viscosity ratio of 6 in a 3.8 cm pipe and Elseth (2001) with a viscosity ratio of 1.6 in a 5.63 cm pipe. Figure 5 presents the results obtained with the flow-pattern dependent model for horizontal pipe flow, when applied to the oil-water measurements by Rodriguez and Oliemans (2006).
Figure 5. (a) The flow map predicted by the Trallero model; (b) the water hold-up predicted by the two-fluid model; (c) the pressure drop predicted by the two-fluid model; (d) the water hold-up predicted by the homogeneous model; (e) the pressure drop predicted by the homogeneous model (ref. Hadžiabdić and Oliemans, 2007a).
Predictions of the flow patterns by the Trallero model are shown in Fig. 5(a) (small symbols) with the experimental data plotted as large symbols. The oil-in-water and water-in-oil dispersed flow patterns (Do/w & Dw/o, Do/w and Dw/o) are more accurately predicted (21% error) than the stratified (ST, ST & MI and Do/w & w) patterns, for which an error of 32% is found. The most pronounced disagreement appears in the prediction of the border between the stratified (ST) and stratified with mixing (ST & MI) regions. The model significantly overestimates the size of the stratified region in the flow map: the measurements indicate that already at modest oil/water velocities the interface becomes wavy and oil and water drops are formed and entrained in the other layers, giving a dual continuous stratified flow of two dispersions with high drop concentrations at the interface. Since in the current version of the two-fluid model for stratified flow the ST pattern with complete separation of the phases is used, it may be expected that such a simple model will lead to inaccurate results for the phase hold-ups and oil/water pressure loss. This is clear from the comparisons between model calculations and measurements in Figs. 5(b) and 5(c). The average error for the water hold-up of 10% is satisfactory, but a maximum error of 50% is a point of concern. It occurs for the experimental points with water hold-ups smaller than 0.1. Very much larger errors are obtained with the pressure drop calculations shown in Fig. 5(c): an average error of 31% with a maximum as high as 91%.
The high prediction errors occur for experimental points with pressure gradients less than 100 Pa/m. These belong to the ST and
ST&MI region with mismatch between the stratified and dual continuous flow patterns. The average errors for the water hold-up and the oil/water pressure loss for the dispersed flow patterns are quite satisfactory as shown in Figs. 5(d) and 5(e). However, also here the maximum errors, especially for the water hold-up, are large.
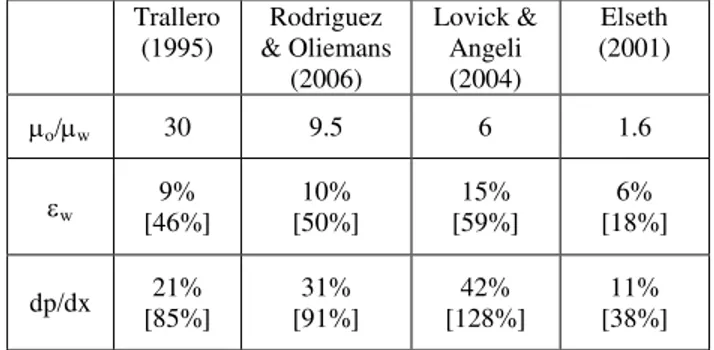
A comparison of these results with the accuracy of the two-fluid model for oil/water pipe flows with other oil/water viscosity ratios presented in Table 1 (from Hadžiabdić and Oliemans 2007b) shows that all calculations suffer from large maximum errors.
Elseth‟s data with the lowest viscosity ratio give the best
performance. However, also for these data the spread is quite large.
Table 1. Accuracy of two-fluid model for oil/water stratified pipe flow.
Trallero (1995)
Rodriguez & Oliemans
(2006)
Lovick & Angeli (2004)
Elseth (2001)
o/w 30 9.5 6 1.6
w 9%
[46%]
10% [50%]
15% [59%]
6% [18%]
dp/dx 21% [85%]
31% [91%]
42% [128%]
11% [38%]
Although the average error of the water hold-up calculations with the two-fluid model for stratified flow is acceptable, that of the pressure drop calculations is certainly too large for practical use. As shown in Fig. 5(c) the base two-fluid model for stratified flow systematically under-predicts measured pressure gradients lower than 100 Pa/m. The under-prediction holds both for the ST and ST&MI flow patterns that in the base version of the model are treated in the same way. Clearly, there is scope for model improvement, since a systematic measuring error is unlikely. This would require a further analysis of the data with regard to correct flow pattern prediction and closure relations.
The Inverse Oil/Water Flow Model
experimental velocities. For production engineers this is an undesired situation leading to too optimistic production rates for the oil and too pessimistic estimates for the amount of water produced from the well.
Figure 6. (a) The flow map predicted by the Trallero model; (b) the oil superficial velocities predicted by the two-fluid model; (c) the water superficial velocities predicted by the two-fluid model; (d) the oil superficial velocities predicted by the homogeneous model; (e) the water superficial velocities predicted by the homogeneous model (ref.
Hadžiabdić and Oliemans, 2007a).
A remarkable feature with the application of the inverse two-fluid model for the stratified flow patterns is that in Fig. 6(b) a specific experimental oil superficial velocity corresponds to a wide range of calculated superficial oil velocities for ST, ST&MI and Do/w&w flows. Will that disappear when different model versions become available for these sub-regimes of stratified flow? The same can be observed in Fig. 6(c) for the water superficial velocities.
Table 2. Accuracy of the inverse two-fluid model for oil/water stratified pipe flow.
Trallero (1995)
Rodriguez & Oliemans
(2006)
Lovick & Angeli (2004)
Elseth (2001)
o/w 30 9.5 6 1.6
Uos 56%
[330%]
45% [195%]
26% [59%]
14% [37%]
Uws 53%
[817%]
43% [293%]
14% [52%]
11% [66%]
Table 2 shows that also for the literature oil/water pipe flow data with other oil/water viscosity ratios the inverse model for
stratified flow predicts inaccurate values for the oil and water velocities. Acceptable average errors, but still large maximum errors, are found for the data with the lowest oil/water viscosity ratio. The inaccuracy seems to increase with oil/water viscosity ratio.
The poor model accuracy shown in Fig. 6, especially for the data in the ST and ST&MI regions, is surprising, since the maximum deviation when the pressure drop and water hold-up are calculated, is an order of magnitude smaller. To try to understand this, Hadžiabdić studied the sensitivity of the calculated variables to a small change in the values of the input variables (Hadžiabdić and Oliemans 2007a). Figures 7(c) and 7(d) show the estimated uncertainties in the calculated water hold-up and superficial water velocity for a range of superficial oil velocities from 0.02-0.2 m/s. The estimated uncertainty for the water hold-up is smaller than 1% for all considered values of water and oil flow rates. However, Fig. 7(d) reveals that even 1% change in the value of the water hold-up can cause a calculation uncertainty for the water velocity as high as 40%. It is interesting to mention that the estimated uncertainty for the water flow-rate is the same for all oil velocities. It increases with increasing water hold-up. Knowing that the highest uncertainty in measuring w (around 8%) is present for small and high values of the water hold-up (Rodriguez and Oliemans 2006), it can be expected that the measuring error can significantly influence the calculation error.
Figure 7. (c) Estimated uncertainty for the two-fluid calculation of the water hold-up and (d) estimated uncertainty for the inverse two-fluid model results for the water superficial velocity (from Hadžiabdić and Oliemans, 2007a, Fig. 4).
Oil-Water Interface Related Phenomena
the lower water layer would be closer to reality. Figs. 8a and b schematically describe the two flow patterns: stratified flow without mixing of the phases and the dual continuous flow with droplets of the opposite phase in the upper and lower layers. Entrainment of one phase into the other occurs when the interfacial-shear stress becomes sufficiently large to drag part of the fluid into the continuous layer of the opposite phase. The high-amplitude interfacial waves observed by Rodriguez and Oliemans (2006) can create a condition for entrainment to occur.
Figure 8. Schematic description of (a) stratified flow without drop entrainment; (b) stratified flow with drop entrainment used in parametric study by Hadžiabdić and Oliemans (2007a).
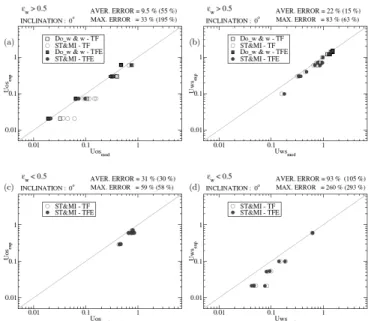
Hadžiabdić adopted two different routes in a parametric study of drop entrainment. The two-dispersion model assumes that drop entrainment leads to formation of upper and lower dispersions. The mixture properties of these dispersions are calculated as in the homogeneous model. At the modest velocities one encounters in oil wells, it is very unlikely that the turbulence in the oil and water layers is strong enough to fully disperse the droplets. So, rather than obtaining a homogeneous dispersion of drops in each layer, one expects strong concentration gradients for the dispersed drops with maxima near the interface. Therefore, in another approach drop entrainment is taken into account by an extra term in the phase momentum equations. This term represents the exchange of the entrained-drop momentum with the host layer. The oil-velocity results are improved significantly for the experimental points with water hold-ups greater than 0.5, while the water velocity is still predicted with a similar, relatively high inaccuracy as by the standard model without entrainment (see Figs. 9(a) and 9(b)). The errors in oil and water velocities for thin water layers shown in Figs. 9(c) and 9(d) remain as high as with the standard model. The conclusion has to be that the high prediction errors for the experimental points with water hold-ups less than 0.5 cannot be explained by entrainment. For water hold-ups greater than 0.5 only the oil flow rate prediction is improved by the allowance for drop entrainment. The maximum percentage of entrained droplets of about 12% (as percentage of the water or oil rate) selected to improve the superficial oil velocity (as shown in Fig. 9(a)) is in line with experimental findings by Valle and Kvandal (1995).
Hadžiabdić also considered the effect on the calculation errors with the two-fluid model for stratified flow by comparing the wall shear stresses for a wavy interface with the results of the base case, in which a smooth interface is used. The results for the error in the wall shear stresses for the oil-wetted case with a small oil layer on top of a thick water layer (w > 0.5) are shown in Fig. 10(a), while Fig. 10(c) shows the wave amplitude relative to the oil-layer thickness one has to choose to achieve the error reduction displayed in Fig. 10(a). No firm data for wave amplitudes and velocities are available, unfortunately. However, the recorded movies of the oil-water flow, made by Rodriguez and Oliemans (2006), reveal that the values of the wave amplitudes that minimize the calculation errors are not unrealistic at least for some of the experimental points. The
results of the wave effects on calculation error reductions for the case of a small water layer ((w < 0.5) are similar.
Figure 9. Comparison of the superficial-velocity results obtained by the two-fluid model with entrainment (TFE) with experimental data for water hold-ups greater and smaller than 0.5, respectively (ref. Hadžiabdić and Oliemans 2007a); errors with the two-fluid model without entrainment (TF) between brackets.
Outlook
The application of a two-fluid model concept to stratified flow and a homogeneous model to dispersed flow in oil/water pipe flow for horizontal oil wells has been reviewed, after concluding that a three-phase approach in this stage is certainly a „phase too far‟.
The oil/water model approach has been verified in detail by using pipe flow data for an oil/brine system with a viscosity ratio of 9.5. Literature data with other oil/water viscosity ratios have been used in a more global comparison only. Two very simple modeling approaches have been considered: the two-fluid model for stratified oil/water flow with complete phase separation and the homogeneous model for dispersed oil/water pipe flow conditions. Clearly idealizations of the flow patterns expected in horizontal wells at low to intermediate production rates. Only horizontal flow has been considered. In the flow pattern map the transition to dispersed flow is quite accurate. That is not the case for the transitions between stratified-flow and stratified-flow with mixing. The current flow pattern map over-estimates the stratified flow region. A transition to stratified-flow with mixing occurs already at much lower phase velocities than currently predicted.
The calculation errors for the two-fluid model version for stratified flow are quite large, in particular for the oil/water pressure losses. Typically, average errors of 20-40% and maximum errors of about 100% are quite common. Although the average errors for the water hold-ups are lower (about 10%), here the calculations are also rather inaccurate with maximum errors of 50%. When the model is used in an inverse mode to compute from measured water hold-up and oil/water pressure loss the oil and water superficial velocities, the errors are unacceptably high: average errors of 45% with maximum errors of 200-300% clearly make these results not suitable to determine production rates in oil wells in a reliable way.
The analysis of the data reveals that improvements for the two-fluid model of stratified flow may come from interface related phenomena. Drop entrainment and the effect of large amplitude interfacial waves on oil or water wetted shear stresses can considerably reduce the calculation errors for the water hold-ups. The values for the entrained fractions and wave amplitudes seem realistic. However, more quantitative data on these variables are badly needed to confirm the model improvement capabilities. For the inverse mode of the model such refinements only have a modest effect. Still possible improvements for oil/water velocity predictions are expected when sub-regimes in the stratified flow region can be better predicted and modeled. However, this will not necessarily lead to an acceptable engineering tool to estimate production rates by applying the inverse model, since the exceptionally large errors in oil/water velocity predictions are caused by relatively small measuring errors for the water hold-up.
Acknowledgements
I wish to warmly acknowledge that the research progress presented is the result of the enthusiastic and dedicated work of Oscar Rodriguez, Sébastien Guet and Muhamed Hadžiabdić as
Post-docs in our Multi-Scale Physics Department at Delft University of Technology. Particular thanks are due to Neima Brauner for stimulating scientific discussions, Alex van der Spek for initiating the project sponsored by Shell and Roel Kusters for his guidance of the experiments at Shell Rijswijk.
References
Brauner, N., 2001, “The prediction of dispersed flow boundaries in liquid-liquid and gas-liquid systems”, International Journal of Multiphase Flow, Vol. 27, pp. 885-910.
Brauner, N., 2002, “Modelling and control of two-phase phenomena: liquid-liquid two-phase flow systems”, Course notes Udine, PDF available on Internet.
Elseth, G., 2001, “An experimental study of oil-water flow in horizontal pipes”, Ph.D. thesis, The Norwegian University of Science and Technology, Norway.
Guet, S., Rodriguez, O.M.H., Oliemans R.V.A. and Brauner, N., 2006,
“An inverse dispersed multiphase flow models for liquid production rate determination”, Interntational Journal of Multiphase Flow, Vol. 32, pp. 553-567.
Hadžiabdić, M. and Oliemans, R.V.A., 2006, “A model for determining
the liquid flow rates from the pressure drop and hold-up in oil/water flows”, Proceedings 5th North American Conference on Multiphase Technology,
Banff, Canada, 1-2 June 2006, pp. 247-261, edited by Garry Gregory, published by BHR Group Limited, Cranfield, UK, ISBN: 1 855598 074-6.
Hadžiabdić, M. and Oliemans, R.V.A., 2007a, “Parametric study of a
model for determining the liquid flow rates from the pressure gradient and water hold-up in oil/water flows”, International Journal of Multiphase Flow, Vol. 33, pp. 1365-1394.
Hadžiabdić, M and Oliemans, R.V.A., 2007b, “A systematic error
analysis of the two-fluid model”, Programme and abstracts of ICMF 2007 of the 6th Int. Conference on Multiphase Flow, Congress Centre Leipzig, Germany, 9-13 July 2007, pp. 338, CD-ROM with Proceedings, paper 199 S5_Wed_D44.
Hewitt, G.F., 1997, Keynote Speech: “Gas-liquid-liquid flow: a phase
too far”, Proceedings BHR Conference Multiphase ‟97, Cannes, France, pp.
215-239.
Lovick, J. and Angeli, P., 2004, “Experimental studies on the dual continuous flow pattern in oil-water flows”, International Journal of Multiphase Flow, Vol. 30, pp. 139-157.
Oddie, G., Shi H., Durlofski, L.J., Aziz K., Pfeiffer B. and Holmes J.A., 2003, “Experimental study of two- and three-phase flows in large diameter inclined pipes”, International Journal of Multiphase Flow, Vol. 29, pp. 527-558.
Petalas, N. and Aziz, K., 2000. “A mechanistic model for multiphase flow in pipes”, Journal of Canadian Petroleum Technology, Vol. 39, pp. 43-55.
Rodriguez, O.M.H., Mudde, R.F. and Oliemans, R.V.A., 2004,
“Inversion of multiphase flow models for horizontal and inclined oil/water well logging”, Proceedings 4th North American Conf. on Multiphase
Technology, Banff, Canada, 3-4, June, pp. 23-44.
Rodriguez, O.M.H. and Oliemans, R.V.A., 2006, “Experimental study on oil/water flow in horizontal and slightly inclined pipes”, International Journal of Multiphase Flow, Vol. 32, pp. 323-343.
Trallero, J.L., 1995, “Oil-water flow patterns in horizontal pipes”, Ph.D. thesis, The University of Tulsa, Tulsa, Oklahoma, USA