Article
Printed in Brazil - ©2016 Sociedade Brasileira de Química 0103 - 5053 $6.00+0.00
*e-mail: [email protected]
#These authors contributed equally to this work.
Comparison of Gold CD-R Types as Electrochemical Device and as Platform for
Biosensors
Marcos V. Foguel,a,# Glauco P. dos Santos,a,# Antonio A. P. Ferreira,*,a Marina Magnani,a
Marcello Mascini,b Petr Skladal,c Assis V. Benedettia and Hideko Yamanakaa
aInstituto de Química, Universidade Estadual Paulista “Júlio de Mesquita Filho” (UNESP),
14800-900 Araraquara-SP, Brazil
bFaculty of Bioscience and Technology for Food, Agriculture and Environment,
University of Teramo, 64023 Teramo, Italy
cDepartment of Biochemistry, Masaryk University, 61137 Brno, Czech Republic
The construction of gold electrodes using 3 kinds of gold recordable compact discs (CDtrodes) and characterization by electrochemical and spectroscopic techniques are herein reported. Following a surface pretreatment in 0.5 mol L−1 sulfuric acid (H
2SO4),the electrochemical experiments were
performed in the presence of redox couple ferro/ferricyanide [Fe(CN)6]3−/4−. The immobilization of
an oligopeptide bio-inspired by acetylcholinesterase onto the CDtrode was also evaluated. Surface characterization was done by cyclic voltammetry, electrochemical impedance spectroscopy, diffuse reflectance infrared Fourier transform spectroscopy and atomic force microscopy. CDtrodes are known to be of low cost, fast and simple construction. They are suitable for immobilizing biological molecules and could be used as disposable transducer for the construction of biosensors.
Keywords: gold, recordable compact discs, biosensors, surface characterization, CDtrode
Introduction
There is increased interest toward the use of alternative materials as transducer for develop electrochemical biosensors capable of providing a good analytical performance, simplicity of construction and low cost.1-3
Gold surface is extensively applied for electrochemical purposes owing to its inertness, high purity, great stability and its strong affinity towards thiol compounds,4-6 which
render these electrodes very suitable for clinical diagnosis, food and environmental analysis, besides other applications. The properties provided by the alkanothiolate self-assembled monolayers (SAM) as stability and highly organized structure on gold also allow them to be employed as model systems in long-range electron-transfer kinetics studies.7
Gold electrode constructed using recordable compact disc (CDtrodes) was a pioneer technique proposed by Angnes et al.,4 which presents a very attractive performance,
great versatility and the possibility of being disposable
when the surface becomes deteriorated by oxidation or contamination. These electrodes are user-friendly thanks to the fact that surface polishing is not necessary and chemical etching with piranha solution is also not required. Its surface oxides are not stable,7 being reduced via electrochemical
procedure. Conventional pure gold-based electrodes (not obtained from CDtrodes) are easily cleaned by means of a chemical etching with piranha solution at 90 oC for
about 5 min, since physically or chemically adsorbed contaminants are chemically removed. CDtrodes provide similar behavior as commercial gold electrodes and have been applied in different electrochemical studies.8,9
The development of a new methodology for the construction of flow cells for the determination of mercury employing thin gold layer of recordable compact disc (CD-R) has been reported by Richter et al.10 A wide range
of articles about the application of CDtrode have been published, though the characterization of such bare surface still remains a subject of investigation.4,7,11-15
diffuse reflectance infrared Fourier transform spectroscopy (DRIFTS)20 and atomic force microscopy (AFM).21-23
By using these techniques, it is possible to obtain information on the surface of the bare electrode, redox properties, estimation of surface coverage, distribution of structural defects like pinholes and also the mechanism and kinetic of the process involved in the formation of the monolayer.24
The bare CDtrodes characterization was done mainly by means of CV, contact angle measurements, scanning electron microscopy (SEM) and scanning tunneling microscopy (STM).4,7 Similar cyclic voltammograms
were obtained in the potential range of –0.25 to 1.75 (V vs. Ag|AgCl|KClsat) for a commercial gold electrode and
CDtrode (recordable CDs from Nipponic and Basf brand) in 0.2 mol L−1 H
2SO4 solution.4 The contact angles for the bare
commercial gold electrode and CDtrode measured after 4-6 min of surface cleaning (until this time the contact angle is time-dependent) were the same within the experimental uncertainties. The anodic to cathodic peak potentials separations in the cyclic voltammograms, recorded in the potential range from –0.20 to 0.5 (V vs. Ag|AgCl|KClsat) at
50 mV s−1 in 1.0 mmol L−1 K
3Fe(CN)6 and 0.1 mol L−1 KCl
aqueous solution, were the same, around 100 mV. The non-ideal diffusion-limited one-electron redox process behavior was attributed to cell geometry.7 However, it is
possible that some ohmic drop contribution and slower charge transfer reaction are present in the 0.1 mol L−1 KCl
solution.16 The track trails on the gold CD-R observed by
large-scale AFM images practically did not influence the wetting properties and infrared (IR) results, and a close look at the STM images of both CDtrode (Kodak CD-R Gold Ultima, Eastman Kodak Company, Rochester, NY, USA) and commercial gold electrodes showed similar rolling hills topology. The author also concluded from STM studies that the CDtrode surface is slightly more uniform than the evaporated gold films.7 The CDtrode surface was
also treated after the removal of the polymeric protective film with concentrated nitric acid by electropolishing, applying 10 cycles between the decomposition potentials of a 1.0 mol L−1 H
2SO4 solution, and then a constant
potential of 0.25 V vs. Ag|AgCl|KClsat. to reduce the gold
oxide on the surface.25 Recently, Foguel et al.11 used gold
CDtrodes to develop an immunosensor for Chagas disease modifying the electrode surface with 4-(methylmercapto) benzaldehyde (SBZA). After removing the polymeric layer with nitric acid, they observed that the electrode response improved after cycling in sulfuric acid and then in ferro-ferricyanide-containing solution. An aptamer biosensing array for thrombin detection constructed by self-assembling a thiol-modified thrombin binding aptamer
onto a CDtrode surface was developed by Castilho et al.26
Uliana et al.13 employed factorial design experiments
for the development of a disposable amperometric desoxyribonucleic acid (DNA) biosensor based on the immobilization of DNA molecules on gold CDtrodes for the detection of hepatitis C virus in samples from patients.
In recent studies, the compact disc electrodes were used for thrombin detection26 by measuring the electrochemical
impedance upon aptamer-protein formation on the surface of CDtrodes in the presence of the redox couple ferro/ ferricyanide [Fe(CN)6]3−/4−, for the non-enzymatic detection
of glucose by chronoamperometry27 and for electrocatalyst
material for dye degrading by depositing pure ZnO onto a gold substrate.28 The CD electrodes were also modified
with different reflective materials offering new working perspectives, such as new bioanalytical platforms.29
In this contribution, three types of gold CD-R (Inkjet MAM-A, MAM-A, and Archive MAM-A) of the CD MAM-A Inc. trade (Colorado, CO, USA) were evaluated. These CD-Rs are being used for biosensor development after a proper surface modification. To that aim, these CD-R types are characterized using different techniques and the electrochemical response was analyzed to verify whether the surface is adequate enough for sensor development. Having knowledge of the morphological and chemical features of the surface of different regions of the CD-R is, thus, indispensable in order to have a better idea regarding the homogeneity of the physical parameters and the gold particles distribution. Our interest here is not related to the evaluation of the quality of CD-Rs for data recording purposes, and all comments made in this work are never related to the recording properties. The essence of this work lies in the characterization of gold CDtrodes by electrochemical and spectroscopic techniques, from the construction (bare CDtrode) to the immobilization of an oligopeptide which mimics the active site of the acetylcholinesterase enzyme. For these studies, different CD-R types and regions of CDs produced by MAM-A Inc. were cleaned to remove the polymeric protective layer, subjected to electrochemical treatment and subsequently modified with oligopeptide. The system was characterized employing different non-electrochemical and electrochemical techniques and the results have been critically discussed herein.
Experimental
Chemicals
Disodium hydrogen phosphate (Na2HPO4), sodium
dihydrogen phosphate (NaH2PO4) and potassium
purchased from Sigma-Aldrich (St. Louis, MO, USA). Sulfuric and nitric acids were obtained from J. T. Baker (Tokyo, Japan). All the solutions were prepared with ultrapure water (resistance > 18 MΩ cm; Millipore Inc., Bedford, MA, USA) Milli-Q quality.
Instrumentation
For electrochemical experiments, a digital potentiostat/ galvanostat PGSTAT 302/FRA 2 (Metrohm Autolab B.V., Utrecht, UT, The Netherlands) controlled with the general purpose electrochemical system (GPES) and frequency response analyzer (FRA2) 3.0 software was employed. An electrochemical cell containing 5 mL of phosphate buffer solution at pH 7.0 and a three-electrode system were used: gold CDtrode (geometric area, Ageom = 0.071 cm2),
Ag|AgCl|KClsat and platinum wire as working, reference
and auxiliary electrodes, respectively.
AFM images (tapping mode) were obtained using the Ntegra Vita AFM microscope (NT-MDT Co. Zelenograd, MO, Russia) equipped with the SFC100LNTF measuring head and non-contact composite probes: silicon body, polysilicon lever and silicon high resolution tip. Typical settings: tip curvature radius 10 nm, cantilever length 87 ± 5 µm, width 32 ± 5 µm, force constant 5.6 (± 20%) N m−1
and resonant frequency 180 (± 10%) kHz.
DRIFTS spectra were recorded using a Shimadzu FTIR-8300 spectrophotometer (Tokyo, Japan) controlled with the HYPER IR 1.51 software, by accumulating 40 scans from 500 to 4000 cm−1. The spectra were treated
using the Kubelka-Munk algorithm.
Construction of gold CDtrodes
Recordable compact discs (Gold CD-R; MAM-A Inc., Colorado, CO, USA) were used for construction of the working electrodes, named gold CDtrodes.4,30 Three CD-R
types were used namely: Inkjet MAM-A, MAM-A and Archive MAM-A, and to shorten the wording we shall adopt the following for the CDs: Inkjet, MAM-A and Archive.
First, concentrated HNO3 was added to the CD-R
surface (Figure 1bI) and after five minutes of exposure
(Figure 1bII), the polymeric layers were removed followed
by rinsing the surface with ultrapure water. This treatment shall hereafter be termed treatment A. Then, the CD-Rs were cut, as shown in Figure 1a for non-electrochemical characterization and for electrochemical studies, as depicted in Figure 1bIII. So, for electrochemical studies,
only the outer parts of the CD-Rs, indicated by number 3 in Figure 1a, were used. The electrochemical working area of the electrode was delimited with drilled galvanoplastic tape 470 (3M®, Saint Paul, MN, USA; Figure 1b
IV), and
for electrical contact, a laminated copper wire was fixed with polytetrafluoroethylene (PTFE) tape (Figure 1bV).30
For the construction of the working electrodes and their surface treatments and modifications, Inkjet, MAM-A and Archive CD-R types were used. In all the cases only the outer part of the cut CD was used to surface modifications.
Electrochemical measurements with CDtrodes
After treatment A, a voltammetric pretreatment of gold CDtrode surfaces was done by performing 10 successive
cycles in 0.5 mol L−1 sulfuric acid solution in the potential
range of 0.2 to 1.5 V vs. Ag|AgCl|KClsat at a scan rate of
100 mV s−1,31 and from now onwards this treatment shall be
denoted treatment B. Cyclic voltammograms were recorded in sulfuric acid before and after treatment B.
For the surface characterization, cyclic voltammograms were obtained in the potential range of –0.4 to 0.7 V vs. Ag|AgCl|KClsat at a scan rate of 50 mV s−1 in the
presence of 1 × 10⁻³ mol L−1 [Fe(CN)
6]3−/4− in 0.1 mol L−1
phosphate buffer solution at pH 7.0, owing to the fact that this solution is often used in sensors and in biosensors development.
The impedance spectra were obtained by applying a sine wave of 10 mV (rms) on open circuit potential (Eoc), from
100 kHz to 100 mHz frequency range recording a total of 50 points. EIS measurements were performed in the same phosphate buffer solution containing 1.0 × 10⁻³ mol L−1
[Fe(CN)6] 3−/4−.
All electrochemical measurements were performed at least three times at 25 ± 1 °C and impedance measurements were done inside a Faraday cage. All the potentials given in this work are referred to Ag|AgCl|KClsat (0.197 V/SHE
(standard hydrogen electrode) at 25 oC).
Oligopeptide immobilization
CDtrodes subjected to both treatments A and B were used to immobilize an oligopeptide bio-inspired by acetylcholinesterase enzyme, aiming its future application in the construction of biosensors.32
The immobilization of the oligopeptide sequence (NH3+-Cys-Glu-His-Gly-Gly-Pro-Ser-COO−) on
the electrode surface was done by the addition of 10 µL 1 × 10⁻³ mol L−1 oligopeptide solution on the
delimitated area and incubation for 1 h at 25 ºC. Afterwards, the electrode was rinsed with ultrapure water in order to remove the biomolecules weakly adsorbed on the electrode surface. All the CDtrodes were modified with the oligopeptide.
Results and Discussion
AFM surface characterization of gold CDtrodes for electrochemical purposes
As aforementioned, the CD-R types were analyzed only for electrochemical purposes, the quality of the CD-Rs for recording applications was not considered at all. The surfaces of the inner, center and outer edge regions of the 3 types of CD-Rs were analyzed by AFM images conducted in the non-contact mode. Different aspects of the surface, such as
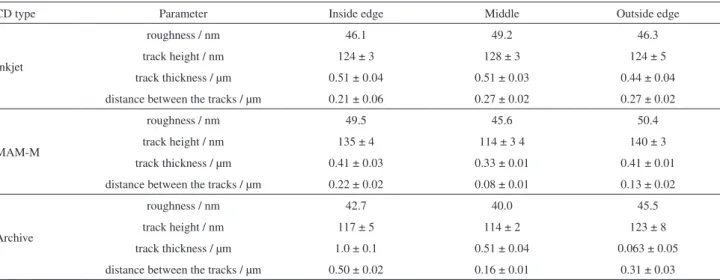
the surface roughness, CD track height (peak-vale distance), the track thickness (track top thickness) and the distance between the tracks (cavity thickness) were investigated. Figure 2 illustrates AFM images obtained for the outer edge of the three CD-R types investigated: MAM-A (Figures 1a and 1d), Inkjet (Figure 1c) and Archive (Figure 1e). The top of the tracks (pre-grooves) was different mainly for Archive, which was found to be flattered compared to the others.
Table 1 shows the values of the different parameters measured with AFM for the different CD-R types in their varying regions (inner, center and outer edges). These parameters were obtained from section analysis of each CD, as schemed in Figure 2b. The values of all parameters, except the surface roughness, are the average of at least 5 measurements.
As shown in Table 1, for the Inkjet CD-R type there was no significant difference in the track height, track thickness, distance between the tracks and roughness for the three analyzed regions, suggesting a well-uniform CD surface. The uniformity of the surface parameters of this gold CD-R indicates that any part of such CD can be used for the electrode construction.
For the MAM-A CD-R type, the inner and outer edges have similar tracks height, tracks thickness and roughness, though they present significant differences in the distance between the tracks. On the other hand, the center of this CD-R showed significant differences in all these parameters in relation to the other two regions of the CD.
For the Archive CD-R, similar height and roughness in the three different regions were observed, but a big difference between the thicknesses of the tracks was measured, which was found to decrease in the following order: inner edge > outer edge > center. A further observation worth pointing out is that there was a greater distance between the tracks compared to the other regions of the CD. The measured distance between the tracks was three times higher for the inner edge compared to the center and twice for the outer edge in relation to the center. The measured surface roughness was slightly lower than that of the others.
All the CD-R surfaces are formed by a sinuous gold layer (peaks and valleys) and present certain porosity. These features can also be responsible for an increase in the surface area determined from oxide monolayer reduction when compared to the geometric area.
Therefore, when a gold CD is chosen to be used as working electrode, the following recommendations are worthy of consideration: (i) a surface analysis of the CD to know the gold distribution, the presence of other metals, and the measurement of different physical parameters of the CD tracks; (ii) the same region of CD (the outer edge, the center or the inner edge) should always be used unless they have similar parameters; and (iii) check the repeatability of the electrochemical response of a series of electrodes using a well-known system before beginning immobilization and sensors construction.
Electrochemical characterization of gold CDtrodes surfaces
The electrochemical performance of the constructed gold CDtrodes was investigated using CV and EIS in the
presence and absence of [Fe(CN)6]3−/4− redox couple. After
treatment A, the electrodes were subjected to repetitive potentiodynamic polarizations (treatment B) in 0.5 mol L−1
sulfuric acid solution at 100 mV s−1, and the 1st and 10th
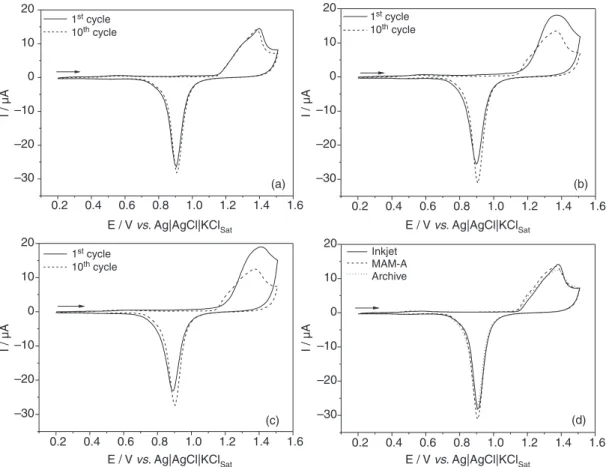
cycles are displayed in Figure 3.
In the absence of ferri-ferrocynide ions in sulfuric acid solution, all investigated CDtrodes exhibited a typical large anodic peak corresponding to the gold oxide formation at around 1.4 V and a cathodic peak corresponding to the reduction of gold oxides at around 0.90 V. In a simple view, they are similar to the conventional gold CVs in sulfuric acid solutions.33 However, a close observation of
the I-E profiles makes it evident that both MAM-A and Archive CDtrodes showed similar I-E profile, though slightly different from that recorded for Inkjet in the same conditions. The main different features are: (i) the anodic current peak decreases from the 1st to the 10th cycle for
MAM-A and Archive, while no significant differences were observed for both cycles of the Inkjet CDtrode; (ii) a shoulder was observed on the foot of the anodic current-potential curve at the 10th cycle for MAM-A and Archive,
while this shoulder is present near the anodic peak in both I-E profiles, practically retraced each other, for the Inkjet (Figure 3a); (iii) for all the electrodes, the huge increase of the anodic current commences at around 1.15 V at the 1st cycle, while such upsurge begins at around 1.12 V for
MAM-A and Archive CDtrodes at the 10th cycle; (iv) in the
positive-going scan, the current at the double layer region (0.2 to 1.0 V) is found to be greater for the 1st than for the
10th cycle for both MAM-A and Archive CDtrodes, while
the same current was measured for Inkjet; all CDtrodes showed no appreciable difference in the current at the double layer region on the 10th cycle; (v) more rounded and
Table 1. Parameters obtained from atomic force microscopy (AFM) images of the recordable compact disc (CD-R) types in their different regions: inner edge, center and outer edge (area 10 × 10 µm)
CD type Parameter Inside edge Middle Outside edge
Inkjet
roughness / nm 46.1 49.2 46.3
track height / nm 124 ± 3 128 ± 3 124 ± 5
track thickness / µm 0.51 ± 0.04 0.51 ± 0.03 0.44 ± 0.04
distance between the tracks / µm 0.21 ± 0.06 0.27 ± 0.02 0.27 ± 0.02
MAM-M
roughness / nm 49.5 45.6 50.4
track height / nm 135 ± 4 114 ± 3 4 140 ± 3
track thickness / µm 0.41 ± 0.03 0.33 ± 0.01 0.41 ± 0.01
distance between the tracks / µm 0.22 ± 0.02 0.08 ± 0.01 0.13 ± 0.02
Archive
roughness / nm 42.7 40.0 45.5
track height / nm 117 ± 5 114 ± 2 123 ± 8
track thickness / µm 1.0 ± 0.1 0.51 ± 0.04 0.063 ± 0.05
higher anodic current peaks were recorded at the 1st than
the 10th cycle for MAM-A and Archive CDtrodes, while
all CDtrodes showed only slightly differences on the 10th;
and, (vi) in the negative-going scan the cathodic current peak is found to be slightly lower for the 1st than for the
10th cycle and the peak potential values are shifted to more
negative values for MAM-A and Archive, but all of them showed the almost same cathodic current peak and at the same potential on the 10th cycle. It is important to note
that observing the cyclic voltammograms of Figure 3d the differences in charge can be considered negligible.
Cyclic voltammograms recorded on gold, platinum and other similar metals in acidic solutions mainly in sulfuric and perchloric acids showed typical CVs well-described in literature.33 CVs of gold obtained in the potential range
of 0.2 to 1.5 V vs. Ag|AgCl|KClsat are characterized by
formation of an oxide monolayer at around 1.4 V with its reduction at around 0.9 V. In the potential ranges of 0.2 to 1.0 V and 0.7 to 0.2 V for the positive-going and negative-going scans, respectively, the gold surface is normally considered practically oxides-free.6,34 This
is the conventional response, which is assumed to be related to relatively high coordinated atoms, which through oxidation in aqueous solutions produce α-oxide
(a monolayer oxide species).35 The CVs in this range can
be mainly modified by the presence of impurities in the electrolyte, which accumulate on the electrode surface during potential cycling or pretreatment. Many different CVs can also be obtained not as a result of the presence of impurities, but rather to surface modifications, where more active atoms are present leading to the formation of the so-called hydrous oxide species. This surface activation can be produced by different ways, including extensive cathodic polarization, heat treatment, extending the anodic upper limit potential values, such as 1.8 V/RHE (reversible hydrogen electrode),35 or even by repetitive
potentiodynamic perturbation.36
The different features mentioned above could be associated, firstly, with an incomplete removal of the protective layer (which is unlikely) or with oxides/hydroxides formation that alter the CV response of gold in sulfuric acid or [Fe(CN)6]3−/4− containing phosphate buffer solutions.
In the presence of [Fe(CN)6]3−/4− redox couple in sulfuric
acid solution, the cyclic voltammograms (not shown) recorded CDtrodes depicts flattened and wide current peaks, which are not supposed to be obtained. Therefore, the flattened and wide current peaks obtained for both MAM-A and Archive CDs could be related to the modification of the
0.2 0.4 0.6 0.8 1.0 1.2 1.4 1.6
–30 –20 –10 0 10 20
(d)
0.2 0.4 0.6 0.8 1.0 1.2 1.4 1.6
–30 –20 –10 0 10 20
0.2 0.4 0.6 0.8 1.0 1.2 1.4 1.6
–30 –20 –10 0 10 20
I / µA I / µA
I / µA I / µA
(a) (b)
Inkjet MAM-A Archive
(c)
0.2 0.4 0.6 0.8 1.0 1.2 1.4 1.6
–30 –20 –10 0 10 20
E / Vvs. Ag|AgCl|KClSat E / Vvs. Ag|AgCl|KClSat
E / Vvs. Ag|AgCl|KClSat E / Vvs. Ag|AgCl|KClSat
1 cyclest 1 cyclest
1 cyclest
10 cycleth 10 cycleth
10 cycleth
Figure 3. Successive cyclic voltammograms of gold electrode constructed using recordable compact disc (CDtrodes) recorded in 0.5 mol L−1 H
properties of the electrode surface. Such modification can be associated with the growth of Au2O3 formed during the
removal of the protective film, which could lead to a more active surface, or change in the electrode conductivity of the electrode due to the acid attack to the components of the electrode other than the protective film. This means that a subsequent surface treatment should be applied, especially for MAM-A and Archive CDtrodes. As described by Foguel
et al.,30 the best cleaning result was achieved for the gold
CDtrode subjected to an electrochemical pretreatment with sulfuric acid (treatment B). Following this treatment, the peak intensities, attributed to the formation of Au2O3,were
found to diminish significantly.
In order to try explaining the difference observed among the CVs in the first and during successive cycling, the effect of possible impurities present in the electrolyte could be ruled out, since the electrolyte was the same for the three CD-R electrodes. Changes in the nature of the dye layer could modify the electrochemical response, for instance, if it be attacked by the chemical treatment. It is well-known that dye modifications can deteriorate CD-Rs.37 The MAM-A
and Archive CDs might have dye layer different than of Inkjet CD; however, it is also known that phthalocyanine dye is largely used due to its high stability to temperature, light and humidity,37 which leads to suppose that all
commercial CDs have the same kind of dye. Therefore, a possible explanation lies on the structure and morphology of the deposited gold particles and consequently the gold layer. Thus, in this sense, the resulting electrodes should be considered slightly different from each other. It is also well-known that cycling electrochemically gold and other metals, under certain conditions, their surfaces are reconstructed and an electrochemical reproducible response can be obtained depending on the cycling conditions.35,36
The surface reconstruction process is based on gold oxide formation followed by its reduction, leading to another atomic organization on the surface, which tends to minimize the differences presented on the original surface. Then, it seems to be reasonable suppose that a higher anodic current obtained for MAM-A and Archive in the 1st cycle is due to
the presence of a more active and irregular surface, which resulted in higher oxide formation that was not complete reduced in the reverse scan, and during successive cycles, a surface more homogeneous was being constructed. As consequence, Figure 3d shows that all electrodes gave similar CV responses after cycling, including the intensity of the cathodic current peak. This leads to believe that the successive cycling process was able to produce surfaces that tend to show similar I-E profiles. On this point of view, the original gold surface of MAM-A and Archive CDs was different from that after cycling, while there was no
significant difference between original and cycled surface to Inkjet. So, the small difference in the I-E profile still observed for CDtrodes can be related to the structure of the gold layer achieved after cycling.
Another important parameter that can be obtained from the charge needed to reduce the gold oxide reduction (Figure 3d) in sulfuric acid solutions after treatment B is the active surface area (Aactual).38 The following values
for the active area were determined: 0.0717 cm2 (Inkjet);
0.0779 cm2 (MAM-A) and 0.0743 cm2 (Archive). The
difference among these areas is lower than 8%. Comparing the data in Table 1, mainly those related to the electrodes used (outer edge), it can be observed that the surface roughness is the same for the three CDtrodes, the track thickness is higher for Archive, while the height track is a little higher and distance between tracks is smaller for MAM-A in comparison to the others, which may justify the slightly changes in their active surface area.
Figure 4 shows the CVs recorded at 50 mV s−1, potential
range from −0.4 to 0.7 V, in 0.1 mol L−1 phosphate buffer
solution pH 7.0, containing 1 × 10⁻³ mol L−1 [Fe(CN) 6]3−/4−
before and after treatment B.
As can be seen in Figure 4, before treatment B, the anodic and cathodic current peaks for the redox couple were flattened and wide for both MAM-A and Archive, and after this treatment MAM-A and Archive showed CVs similar to that recorded for Inkjet CD-R. On the other hand, CVs for Inkjet showed no changes before and after treatment B. In Figure 4 it is also observed that after treatment B, the current peaks (Ipa and Ipc) values recorded for all CDtrodes
are similar and Inkjet showed slightly more reversible behavior than the others. On the other hand, electroactive species like [Fe(CN)6]3−/4− ions should respond equally
independent if the geometric area or the electroactive surface area is considered, unless adsorption is found to be present on the electrode surface. The differences in reversibility for the CDtrodes (Table 2) when treatment A was extended up to 20 min for MAM-A and Archive CDtrodes continued and then, treatment A was maintained in 5 min, and were explained above. This outcome is an evidence that the protective polymeric layer was totally removed after 5 min in nitric acid.4 After treatment B, the
CVs obtained for [Fe(CN)6]3−/4− in phosphate buffer solution
showed small differences, mainly in the reversibility and cathodic/anodic current peak (Ipc/Ipa) ratio values (Table 2).
The treatment B improved the reversibility of the charge transfer reaction involving the [Fe(CN)6]3−/4− redox couple,
the small differences in reversibility of the electrodes post treatment B.
After cycling MAM-M CDtrode in sulfuric acid solution, the repeatability of the gold CDtrode construction was evaluated by comparing the values of anodic and cathodic current peaks associated with the [Fe(CN)6]3−/4− couple.
The relative standard deviation for 5 different electrodes constructed in the same day and working conditions was
1.1%, showing that the electrode areas are very similar. This result indicates a good repetitive construction of CDtrodes.
The influence of treatments A and B on the CDtrodes behavior also become evident upon employing the electrochemical impedance (Figure 5) in 0.1 mol L−1
phosphate buffer solution, pH 7.0, containing 1 × 10⁻³ mol L−1 [Fe(CN)
6]3−/4−. All EIS diagrams show
one capacitive semicircle at the middle frequency range followed by a diffusion impedance, which is more evident for diagrams recorded after treatment B. Except for Inkjet CD-R, the impedance was found to decrease at least 50% after treatment B, which indicates that by cycling these electrodes in sulfuric acid solution, the surface facilitates the charge transfer process of ferri-ferrocyanide species. The changes in capacitive semicircle observed after treatments A and B confirm the results obtained with CV in sulfuric acid solution and the explanation is the same. It is possible that treatment B (i) reduces the oxide formed in nitric acid and/or (ii) removes and redeposits the more active atoms that are responsible for forming gold oxides at lower potentials,38 thereby renewing the electrode surface.
Coherently with the CVs results, after treatment B, the size of the capacitive semicircle related to the charge transfer
–0.4 –0.2 0.0 0.2 0.4 0.6 0.8
–8 –6 –4 –2 0 2 4 6 8
(d) (c)
(b)
–0.4 –0.2 0.0 0.2 0.4 0.6 0.8
–8 –6 –4 –2 0 2 4 6 8
–0.4 –0.2 0.0 0.2 0.4 0.6 0.8
–8 –6 –4 –2 0 2 4 6 8
–0.4 –0.2 0.0 0.2 0.4 0.6 0.8
–8 –6 –4 –2 0 2 4 6 8
Before treatment B After treatment B
(a)
Before treatment B After treatment B
Before treatment B After treatment B
Inkjet MAM-A Archive
I / µA I / µA
I / µA I / µA
E / Vvs. Ag|AgCl|KClSat
E / Vvs. Ag|AgCl|KClSat
E / Vvs. Ag|AgCl|KClSat
E / Vvs. Ag|AgCl|KClSat
Figure 4. Cyclic voltammograms obtained for the outer edge of gold electrode constructed using recordable compact disk (CDtrodes) in 0.1 mol L−1 phosphate buffer solution, pH 7.0, containing 1 × 10⁻³ mol L−1 [Fe(CN)
6]3−/4− at 50 mV s−1, before and after treatment B: (a) Inkjet; (b) MAM-A; (c) Archive.
(d) Cyclic voltammograms of CDtrodes after treatment B in the same conditions.
Table 2. Parameters obtained from cyclic voltammetry (CV) recorded in phosphate buffer solution with ferro-ferricyanide at 20 mV s−1 for gold electrode constructed using recordable compact disc (CDtrodes) before and after treatment B
CD-R Epaa / V Epcb / V ∆Epc / mV Ipc/Ipad
Inkjet before 0.251 0.170 81 0.95
after 0.250 0.171 79 0.95
MAM-A before 0.430 0.038 392 0.85
after 0.269 0.155 114 0.95
Archive before 0.439 −0.066 505 0.65
after 0.275 0.155 120 0.90
–3 –2 –1 0 1 2 3 4 5 6 –10
0 10 20 30 40 50 60 70 80 90
0 20 40 60 80 0
20 40 60 80
Archive MAM-A Inkjet Archive
MAM-A Inkjet
0 10 20 30 40 50 60 70
0 10 20 30 40 50 60 70
Archive MAM-A Inkjet Archive
MAM-A Inkjet
–3 –2 –1 0 1 2 3 4 5 6 2.0
2.5 3.0 3.5 4.0 4.5 5.0
–3 –2 –1 0 1 2 3 4 5 6 2.0
2.5 3.0 3.5 4.0 4.5 5.0
–3 –2 –1 0 1 2 3 4 5 6 –10
0 10 20 30 40 50 60 70 80 90
Archive MAM-A Inkjet
−
Zim
/
k
Ω
−
Zim
/
k
Ω
Zre / kΩ
Before treatment B (a
1)
(a2)
Before treatment B Before treatment B (a
3)
−
φ
/
d
e
g
re
e
s
−
φ
/
d
e
g
re
e
s
lo
g
(|
Z
|)
/
(W
c
m
−
2 )
lo
g
(|
Z
|)
/
(W
c
m
−
2 )
log (f) / Hz log (f) / Hz
Archive MAM-A Inkjet
After treatment B (b
1)
Zre / kΩ
(b2) (b3)
After treatment B After treatment B
log (f) / Hz log (f) / Hz
process for the [Fe(CN)6]3−/4− redox couple decreased. But,
the size of the capacitive semicircle obtained after treatment B followed the order: Archive > MAM-A > Inkjet, which means that electrochemical impedance technique is still more sensitive to changes in the surface structure of the electrodes. The maximum phase angle of the time constant associated with the charge transfer process was around −70 degrees for Archive and MAM-A, and around –45 degrees for Inkjet. It is evident that the electrochemical behavior of Inkjet CDtrode is the closest to that expected for a reversible charge transfer process controlled by the diffusion of electroactive species from the solution to the electrode surface.
Based on the results described here, the Inkjet can be said to be the electrode with the seemingly best electrochemical performance. Thus, the next step was the immobilization of the bio-inspired oligopeptide on the CDtrodes surfaces, bearing in mind that the same conditions were used for all the electrodes.
Characterization of gold CDtrodes after immobilization of the bio-inspired oligopeptide
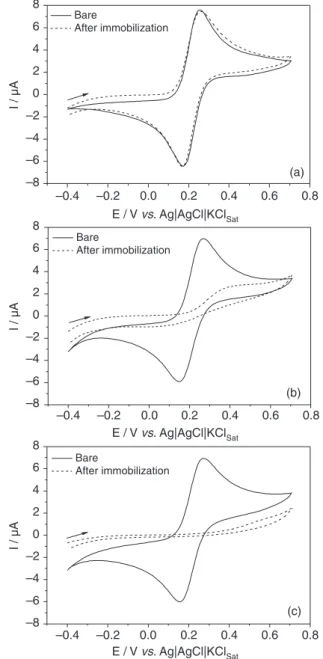
Figure 6 shows the CVs recorded for CDtrodes submitted to treatment A followed by treatment B and modified with oligopeptide. The analysis by cyclic voltammetry, based on the comparison between the anodic current peak obtained before and after immobilization, indicates a negligible distortion of CVs for Inkjet and strong distortion for MAM-A and Archive. The fact that the cyclic voltammogram of ferro-ferricyanide on modified Inkjet CDtrode was only slightly distorted suggests that the electron-transfer reaction occurred without any significant barrier effect, and that the oligopeptide did not block the electrode surface, an unexpected result compared to MAM-A and Archive. The same analysis led to a percentage of surface coverage around 70% for MAM-A and more than 95% for Archive. The flattened peaks indicate a decrease in charge transfer reaction rate.
Electrochemical impedance was also used to characterize the modified CDtrodes in the same conditions used for the CVs. Figure 7 depicts complex plane plots recorded in 0.1 mol L−1 phosphate buffer solution, pH 7.0, containing
1 × 10⁻³ mol L−1 [Fe(CN)
6]3−/4− for gold CDtrodes after
treatment B (bare) and after peptide immobilization for all the CDtrodes.
The main features are: (i) the estimated charge transfer resistance (RCT) increased after immobilization from 0.75
to 31.5 kΩ (Inkjet), from 38.6 to 293.8 kΩ (MAM-A) and from 22.7 to 160.2 kΩ (Archive); (ii) the modulus of impedance increased for all modified electrodes compared
to the electrodes subjected to treatment B; (iii) the frequency at the maximum phase angle in bode plots shifted to lower frequency values for all CDtrodes after immobilization as following: from 43 to 238 Hz (Inkjet), from 7.5 to 100 Hz (MAM-A) and from 18 to 421 Hz (Archive); and (iv) the phase angle at the maximum also increased after immobilization from −45 to –70 degrees (Inkjet), from −70 to −80 degrees (MAM-A) and from
−70 to −75 degrees (Archive). Therefore, the impedance results clearly indicate that all the CDtrodes underwent modification with the oligopeptide though the conclusion drawn for Inkjet was apparently different from the CVs.
–0.4 –0.2 0.0 0.2 0.4 0.6 0.8
–8 –6 –4 –2 0 2 4 6 8
(a)
–0.4 –0.2 0.0 0.2 0.4 0.6 0.8
–8 –6 –4 –2 0 2 4 6 8
–0.4 –0.2 0.0 0.2 0.4 0.6 0.8
–8 –6 –4 –2 0 2 4 6 8
I / µA
I / µA
I / µA
Bare
After immobilization
(b)
(c) Bare
After immobilization
Bare
After immobilization
E / Vvs. Ag|AgCl|KClSat
E / Vvs. Ag|AgCl|KClSat
E / Vvs. Ag|AgCl|KClSat
Figure 6. Cyclic voltammograms obtained for bare electrode after treatment B, and immobilized peptide gold electrode constructed using recordable compact disk (CDtrodes) in 0.1 mol L−1 phosphate buffer solution, pH 7.0 containing 1 × 10⁻³ mol L−1 [Fe(CN)
6]3−/4−, at 50 mV s−1.
The relative increase in the charge transfer resistance caused by the peptide immobilization can be evaluated by the equation 1:
(RCT(immob) – RCT(treatment B)) / RCT(treatment B) (1)
where RCT(immob) is the charge transfer resistance after the
immobilization of the oligopeptide on the CDtrode surface and RCT(treatment B) is the charge transfer resistance before the
immobilization of the oligopeptide and after the treatment B. The following values were obtained from the equation 1: 41 (Inkjet); 6.6 (MAM-A) and 6.1 (Archive), which suggest that Inkjet underwent the highest influence of the oligopeptide immobilization in relation to the charge transfer resistance, a parameter used to evaluate impedimetric biosensors.
It is known that surface coverage values estimated from cyclic voltammetry are always lower than those obtained from other techniques, including electrochemical impedance.34 It has additionally been demonstrated that
cyclic voltammetry is mainly an inappropriate technique when the radial diffusion close to each pinhole or defect site dominates the mass transfer.39 Depending on the inactive
area/pinhole ratio the charge transfer reaction occurs without significant impediment. Other possibility is that the potential scan in the cyclic voltammetric experiments lixiviates the oligopeptide partially or totally from the Inkjet, which seems to be little likely to occur. Indeed more work ought to be done to arrive at any meaningful conclusion whether this is the case of Inkjet CDtrode.
The immobilization of the oligopeptide on CDtrodes was also investigated by non-electrochemical techniques. The modification of gold CDtrode surface was investigated by the vibrational DRIFTS spectra obtained following the immobilization of oligopeptide, in the range of 500 to 4000 cm−1 (Figure 8).
The attribution of the main infrared peaks was done according to Silverstein et al.40 A band within the range
of 3650 to 3584 cm−1 associated with free O−H bond
stretching can be seen. The bands in the 3500-3180 cm−1
range are related to N−H stretch. The band at 2940 cm−1
can be attributed to the C−H vibration from alkanes. The strongest and broad band between the range of 3333 and 2380 cm−1 is related to the overlapping O−H and N−H
bond stretching. The band at 1740 cm−1 is characteristic
of C=O stretch from carboxylic acid, while bands between 1500 and 1250 cm−1 are attributed to N−H vibration
from amide and amine groups. The presence of bands in the 1250-1020 cm−1 range is related to the C−N bond
stretching. The absorption from 800 to 666 cm−1 can
be attributed to N−H stretch from amide or C−S bond
0 100 200 300 400
0 100 200 300 400
Z / kre W Z / kre W
Z / kre W
0 10 20 30 40 50
0 10 20 30 40 50
0 50 100 150 200
0 50 100 150 200
After treatment B-bare
After treatment B-bare
After treatment B-bare Immobilized peptide
Immobilized peptide
Immobilized peptide
–
Z im
/
k
W
–
Z im
/
k
W
–
Z im
/
k
W
(a)
(b)
(c)
Figure 7. Complex plane plots recorded in 0.1 mol L−1 phosphate buffer solution, pH 7.0 containing 1 × 10⁻³ mol L−1 [Fe(CN)
6]3−/4− for gold electrode
stretching from oligopeptide. The immobilization of the oligopeptide on the gold CDtrode surface was done covalently using the thiol group from the cysteine residue of the synthesized sequence.
The results described here have put in evidence the main fundamental challenges involved in the initial steps of developing a bio or immunosensor, which are
outlined as follows: the choice of CD type, how to make a convenient choice regarding the part of CD to be used for constructing the CDtrode, the best process for removing the plastic film that protects the gold layer, the surface treatment to enable the stabilization of the gold surface in order to get reproducible measurements, and the choice of the techniques to characterize the CDtrode in its different stage of preparation prior to the construction of the desired bio or immunosensor. This study also points out some apparent inconsistency between the electrochemical results obtained for the same CDtrode, for instance Inkjet, which may depend on the technique used for characterizing the surface. As aforementioned, MAM-A and Archive were found to show similar behavior, which differed from the result obtained for Inkjet, and studies are in progress to unravel the reason behind these differences.
Conclusions
The characterization of each step vis-à-vis the construction of gold electrodes (CDtrode) from recordable CD-Rs (MAM-A, Archive and Inkjet), as well as the immobilization of the oligopeptide, was demonstrated by using different electrochemical and spectroscopic techniques.
The AFM investigations indicated that the tracks presented varying heights from the peripheral to the central part of the CD-Rs.
The electrochemical results points to differences in physical parameters of the CDtrodes surface as responsible for the changes observed in the electrochemical response, mainly after treatment B, and the differences in the original CDtrodes surface as responsible for the type of CVs obtained after cleaning the gold layer with nitric acid (treatment A).
The use of different electrochemical and non-electrochemical techniques is strongly recommended with regard to confirming the immobilization of biological molecules on the transducer surface and electrochemical impedance seems to be more sensitive to changes on the electrode surface.
The merits including low cost, fast and simple construction of CDtrodes have made gold CD become a disposable transducer. The CDtrode is also a good platform for immobilizing biological molecules and the best type among the CD-Rs studied here was the Inkjet CD-R.
Acknowledgements
The authors would like to express their heartfelt gratitude to Fundação de Amparo à Pesquisa do Estado de São Paulo
4000 3500 3000 2500 2000 1500 1000 500
–0.1 0.0 0.1 0.2 0.3 0.4 0.5 0.6 0.7
Before immobilization After immobilization
Before immobilization After immobilization
4000 3500 3000 2500 2000 1500 1000 500
–0.1 0.0 0.1 0.2 0.3 0.4 0.5 0.6 0.7
C-S N-H
C-N N-H C=O N-H O-H C-H
N-H N-H
Wavenumber / cm–1
Wavenumber / cm–1
Wavenumber / cm–1
O-H
4000 3500 3000 2500 2000 1500 1000 500
–0.1 0.0 0.1 0.2 0.3 0.4 0.5 0.6 0.7
N-H C-S
C-N N-H
C=O O-H N-H
C-H N-H
O-H
N-H
Before immobilization After immobilization
KM
KM
KM
C=O
N-H C-N
C-H O-H
C-S N-H N-H
O-H
(a)
(b)
(c)
(FAPESP, Proc. 2008/07729-8 and 2010/04663-6), Marie Curie International Research Staff Exchange Scheme (IRSES, FP7-PEOPLE-IRSES-2008-230849) and Conselho Nacional de Desenvolvimento Científico e Tecnológico (CNPq, Proc. 305890/2010-7 and 313307/2009-1) for the financial support granted for this project.
References
1. Pingarrón, J. M.; Yáñez-Sedeño, P.; González-Cortés, A.;
Electrochim. Acta2008, 53, 5848.
2. Díaz-Díaz, G.; Antuña-Jiménez, D.; Blanco-López, M. C.; Lobo-Castañón, M. J.; Miranda-Ordieres, A. J.; Tuñón-Blanco, P.;
TrAC, Trends Anal. Chem.2012, 33, 66.
3. Yao, J.; Sun, Y.; Yang, M.; Duan, Y.; J. Mater. Chem.2012, 22, 14313.
4. Angnes, L.; Richter, E. M.; Augelli, M. A.; Kume, G. H.; Anal. Chem.2000,72, 5503.
5. Godinez, L. A.; Rev. Soc. Quim. Mex.1999, 43, 219. 6. Ulman, A.; Chem. Rev.1996, 96, 1533.
7. Yu, H.-K.; Anal. Chem.2001, 73, 4743.
8. Lowinsohn, D.; Richter, E. M.; Angnes, L.; Bertotti, M.;
Electroanalysis2006, 18, 89.
9. Yu, H.-Z.; Chem. Commun. (London)2004,23, 2633. 10. Richter, E. M.; Augelli, M. A.; Kume, G. H.; Mioshi, R. N.;
Angnes, L.; Frenesius’ J. Anal. Chem.2000, 366, 444. 11. Foguel, M. V.; Santos, G. P.; Ferreira, A. A. P.; Yamanaka, H.;
Benedetti, A. V.; Electroanalysis 2011,23, 2555.
12. Ghaderi, S.; Mehrgardi, M. A.; Bioelectrochemistry2014,98, 64.
13. Uliana, C. U.; Tognolli, J. O.; Yamanaka, H.; Electroanalysis
2011, 23, 2607.
14. Westbroek, P.; Strycker, J.; Dubruel, P.; Temmerman, E.; Schacht, E. H.; Anal. Chem.2002, 74, 915.
15. Santana, P. P.; Oliveira, I. M. F.; Piccin, E.; Electrochem. Commun.2012,16, 96.
16. Ferreira, A. A. P.; Fugivara, C. S.; Barrozo, S.; Suegama, P. H.; Yamanaka, H.; Benedetti, A. V.; J. Electroanal. Chem.2009,
634, 111.
17. Caetano, F. R.; Gevaerd, A.; Castro, E. G.; Bergamini, M. F.; Zarbin, A. J. G.; Marcolino-Junior, L. H.; Electrochim. Acta
2012, 66, 265.
18. Ciani, I.; Schulze, H.; Corrigan, D. K.; Henihan, G.; Giraud, G.; Terry, J. G.; Walton, A. J.; Pethig, R.; Ghazal, P.; Crain, J.; Campbell, C. J.; Bachmann, T. T.; Mount, A. R.; Biosens. Bioelectron.2012, 31, 413.
19. Chullasat, K.; Kanatharana, P.; Limbut, W.; Numnuan, A.; Thavarungkul, P.; Biosens. Bioelectron. 2011, 26, 4571. 20. Marquez-Linares, F.; Uwakweh, O. N. C.; Lopez, N.;
Chavez, E.; Polanco, R.; Morant, C.; Sanz, J. M.; Elizalde, E.;
Neira, C.; Nieto, S.; Malherbe-Roque, R.; J. Solid State Chem.
2011, 185, 655.
21. Molina, J.; Fernandez, J.; Del Rio, A. I.; Bonastre, J.; Cases, F. C.; Appl. Surf. Sci.2012, 17, 6246.
22. Cattani-Scholz, A.; Liao, K. C.; Bora, A.; Pathak, A.; Hundschell, C.; Nickel, B.; Schwartz, J.; Abstreiter, G.; Tornow, M.; Langmuir2012, 28, 7889.
23. Grosan, C. B.; Varodi, C.; Vulcu, A.; Olenic, L.; Pruneanu, S.; Almasan, V.; Electrochim. Acta2012, 63, 146.
24. Chaki, N. K.; Vijayamohanan, K.; Biosens. Bioelectron.2002,
17, 1.
25. Westbroek, P.; de Strycker, J.; Dubruel, P.; Temmerman, E.; Schacht, E. H.; Anal. Chem. 2002, 74, 915.
26. Castilho, G.; Trnkova, L.; Hrdy, R.; Hianik, T.; Electroanalysis
2012, 24, 1079.
27. Chena, Y.; Liua, L.; Wanga, M.; Wanga, C.; Hua, X.; Wang, G.;
Sens. Actuators, B2013, 177, 555.
28. Brun, E. M.; Puchades, R.; Maquieira, A.; Anal. Chem.2013,
85, 4178.
29. Silva, L. J. V.; Foletto, E. J.; Dorneles, L. S.; Paz, D. S.; Frantz, T. S.; Gündel, A.; Braz. J. Chem. Eng.2013, 30, 155. 30. Foguel, M. V.; Uliana, C. V.; Tomaz, P. R. U.; Marques,
P. R. B. O.; Yamanaka, H.; Ferreira, A. A. P.; Ecl. Quím.2009,
34, 59.
31. Akram, M.; Stuart, M. C.; Wong, D. K. Y.; Anal. Chim. Acta
2004, 504, 243.
32. dos Santos, G. P.; Silva, B. F.; Garrido, S. S.; Mascini, M.; Yamanaka, H.; Analyst (Cambridge, U. K.)2014, 139, 273. 33. Wood, R. In Electroanalytical Chemistry: a Series of Advances;
Bard A. J., ed.; Dekker: New York, 1976, ch. 1.
34. Campuzano, S.; Pedrero, M.; Montemayor, C.; Fatás, E.; Pingarrón, J. M.; J. Electroanal. Chem.2006, 586, 112. 35. Burke, L. D.; Mullane, A. P. O.; J. Solid State Electrochem.
2000, 4, 285.
36. Rdova, R. C.; Orellana, M. E.; Martins, M. E.; Arvía, A. J.;
Electrochim. Acta1998, 24, 489.
37. Rollet, F.; Morlat-Thérias, S.; Gardette, J.-L.; Polym. Degrad. Stab.2009, 94, 877.
38. Khrushcheva, E. K.; Tarasevich, M. R.; Russ. Chem. Rev.1978,
47, 416.
39. Amatore, C.; Saveant, J. M.; Tessler, D. J.; J. Electroanal. Chem.
1983, 147, 39.
40. Silverstein, R. M.; Bassler, G. C.; Morrill, T. C.; Spectrometric Identification of Organic Compounds, 5th ed.; John Wiley &
Sons: New York, 1991.
Submitted date: August 25, 2015
Published online: November 13, 2015


![Figure 4. Cyclic voltammograms obtained for the outer edge of gold electrode constructed using recordable compact disk (CDtrodes) in 0.1 mol L −1 phosphate buffer solution, pH 7.0, containing 1 × 10 −3 mol L −1 [Fe(CN) 6 ] 3−/4− at 50 mV s −1 , before a](https://thumb-eu.123doks.com/thumbv2/123dok_br/19000186.463493/8.892.153.763.111.589/voltammograms-obtained-electrode-constructed-recordable-cdtrodes-phosphate-containing.webp)
![Figure 5. Electrochemical impedance spectroscopy (EIS) diagrams recorded in 0.1 mol L −1 phosphate buffer solution, pH 7.0 containing 1 × 10 −3 mol L −1 [Fe(CN) 6 ] 3−/4− for gold electrode constructed using recordable compact disc (CDtrodes): (a) after](https://thumb-eu.123doks.com/thumbv2/123dok_br/19000186.463493/9.892.146.725.110.1064/electrochemical-impedance-spectroscopy-phosphate-containing-electrode-constructed-recordable.webp)
![Figure 7. Complex plane plots recorded in 0.1 mol L −1 phosphate buffer solution, pH 7.0 containing 1 × 10 −3 mol L −1 [Fe(CN) 6 ] 3−/4− for gold electrode constructed using recordable compact disk (CDtrodes) after treatment B and after peptide immo](https://thumb-eu.123doks.com/thumbv2/123dok_br/19000186.463493/11.892.74.407.101.1034/complex-phosphate-containing-electrode-constructed-recordable-cdtrodes-treatment.webp)

